The role of introgression and ecotypic parallelism in delineating intraspecific conservation units
- PMID: 32567754
- PMCID: PMC7496186
- DOI: 10.1111/mec.15522
The role of introgression and ecotypic parallelism in delineating intraspecific conservation units
Abstract
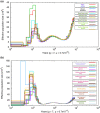
Parallel evolution can occur through selection on novel mutations, standing genetic variation or adaptive introgression. Uncovering parallelism and introgressed populations can complicate management of threatened species as parallelism may have influenced conservation unit designations and admixed populations are not generally considered under legislations. We examined high coverage whole-genome sequences of 30 caribou (Rangifer tarandus) from across North America and Greenland, representing divergent intraspecific lineages, to investigate parallelism and levels of introgression contributing to the formation of ecotypes. Caribou are split into four subspecies and 11 extant conservation units, known as designatable units (DUs), in Canada. Using genomes from all four subspecies and six DUs, we undertake demographic reconstruction and confirm two previously inferred instances of parallel evolution in the woodland subspecies and uncover an additional instance of parallelism of the eastern migratory ecotype. Detailed investigations reveal introgression in the woodland subspecies, with introgressed regions found spread throughout the genomes encompassing both neutral and functional sites. Our investigations using whole genomes highlight the difficulties in unequivocally demonstrating parallelism through adaptive introgression in nonmodel species with complex demographic histories, with standing variation and introgression both potentially involved. Additionally, the impact of parallelism and introgression on conservation policy for management units needs to be considered in general, and the caribou designations will need amending in light of our results. Uncovering and decoupling parallelism and differential patterns of introgression will become prevalent with the availability of comprehensive genomic data from nonmodel species, and we highlight the need to incorporate this into conservation unit designations.
Keywords: adaptive introgression; conservation legislation; demographic history; introgressed populations; management units; parallel evolution.
© 2020 The Authors. Molecular Ecology published by John Wiley & Sons Ltd.
Figures


Similar articles
-
The eastern migratory caribou: the role of genetic introgression in ecotype evolution.R Soc Open Sci. 2016 Feb 3;3(2):150469. doi: 10.1098/rsos.150469. eCollection 2016 Feb. R Soc Open Sci. 2016. PMID: 26998320 Free PMC article.
-
Reconstruction of caribou evolutionary history in Western North America and its implications for conservation.Mol Ecol. 2012 Jul;21(14):3610-24. doi: 10.1111/j.1365-294X.2012.05621.x. Epub 2012 May 22. Mol Ecol. 2012. PMID: 22612518
-
Inferring the demographic history underlying parallel genomic divergence among pairs of parasitic and nonparasitic lamprey ecotypes.Mol Ecol. 2017 Jan;26(1):142-162. doi: 10.1111/mec.13664. Epub 2016 Jul 12. Mol Ecol. 2017. PMID: 27105132
-
A SCOPING REVIEW OF THE RANGIFER TARANDUS INFECTIOUS DISEASE LITERATURE: GAP BETWEEN INFORMATION AND APPLICATION.J Wildl Dis. 2022 Jul 1;58(3):473-486. doi: 10.7589/JWD-D-21-00165. J Wildl Dis. 2022. PMID: 35675481 Review.
-
Adaptive introgression in animals: examples and comparison to new mutation and standing variation as sources of adaptive variation.Mol Ecol. 2013 Sep;22(18):4606-18. doi: 10.1111/mec.12415. Epub 2013 Aug 1. Mol Ecol. 2013. PMID: 23906376 Review.
Cited by
-
Genomic population structure and inbreeding history of Lake Superior caribou.Ecol Evol. 2023 Jul 7;13(7):e10278. doi: 10.1002/ece3.10278. eCollection 2023 Jul. Ecol Evol. 2023. PMID: 37424935 Free PMC article.
-
Parallel introgression, not recurrent emergence, explains apparent elevational ecotypes of polyploid Himalayan snowtrout.R Soc Open Sci. 2021 Oct 27;8(10):210727. doi: 10.1098/rsos.210727. eCollection 2021 Oct. R Soc Open Sci. 2021. PMID: 34729207 Free PMC article.
-
Adaptive markers distinguish North and South Pacific Albacore amid low population differentiation.Evol Appl. 2021 Feb 23;14(5):1343-1364. doi: 10.1111/eva.13202. eCollection 2021 May. Evol Appl. 2021. PMID: 34025772 Free PMC article.
-
Genomic and morphological data shed light on the complexities of shared ancestry between closely related duck species.Sci Rep. 2022 Jun 17;12(1):10212. doi: 10.1038/s41598-022-14270-2. Sci Rep. 2022. PMID: 35715515 Free PMC article.
-
Adaptation to the High-Arctic island environment despite long-term reduced genetic variation in Svalbard reindeer.iScience. 2023 Sep 3;26(10):107811. doi: 10.1016/j.isci.2023.107811. eCollection 2023 Oct 20. iScience. 2023. PMID: 37744038 Free PMC article.
References
-
- Allendorf, F. W. , Leary, R. F. , Spruell, P. , & Wenburg, J. K. (2001). The problems with hybrids: Setting conservation guidelines. Trends in Ecology and Evolution, 16, 613–622. 10.1016/S0169-5347(01)02290-X - DOI
-
- Andrews, S. (2010). FastQC: A quality control tool for high throughput sequence data. Retrieved from http://www.bioinformatics.babraham.ac.uk/projects/fastqc
-
- Banfield, A. W. F. (1961). A Revision of the Reindeer and Caribou, Genus Rangifer. National Museum of Canada, Bulletin No. 177, Queen’s Printer: Ottawa, ON, Canada.
Publication types
MeSH terms
LinkOut - more resources
Full Text Sources

