. 2020 Mar;1(3):291-301.
doi: 10.1038/s43018-020-0036-4. Epub 2020 Mar 9.

Long-distance modulation of bystander tumor cells by CD8+ T cell-secreted IFNγ

Affiliations

Long-distance modulation of bystander tumor cells by CD8+ T cell-secreted IFNγ

Mirjam E Hoekstra et al. Nat Cancer. 2020 Mar.

Erratum in

Abstract

T cell-secreted IFNγ can exert pleiotropic effects on tumor cells that include induction of immune checkpoints and antigen presentation machinery components, and inhibition of cell growth. Despite its role as key effector molecule, little is known about the spatiotemporal spreading of IFNγ secreted by activated CD8+ T cells within the tumor environment. Using multiday intravital imaging, we demonstrate that T cell recognition of a minor fraction of tumor cells leads to sensing of IFNγ by a large part of the tumor mass. Furthermore, imaging of tumors in which antigen-positive and -negative tumor cells are separated in space reveals spreading of the IFNγ response, reaching distances of >800 µm. Notably, long-range sensing of IFNγ can modify tumor behavior, as both shown by induction of PD-L1 expression and inhibition of tumor growth. Collectively, these data reveal how, through IFNγ, CD8+ T cells modulate the behavior of remote tumor cells, including antigen-loss variants.

Keywords: CD8+ T cells; IFNγ receptor signaling reporter; IFNγ spreading; intravital imaging; tumor immunology.


Conflict of interest statement

Competing interests The authors declare no competing financial interests.

Figures
Extended Data Fig. 1
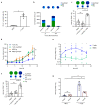
Extended Data Fig. 1. In vitro IGS reporter cell characteristics.
a) Median Katushka fluorescence intensity of IGS reporter-modified CFP+ OVCAR5 cells upon incubation with recombinant IFNγ under the indicated conditions. Bar graph shows mean of n=3 technical replicates, representative data of two independent experiments are depicted. b) CFP+ IGS reporter modified OVCAR5 cells proficient or deficient for the IFNγR were incubated for 48h with the indicated concentrations of recombinant IFNγ or IFNα and Katushka expression was analyzed by flow cytometry. Bar graphs show mean of technical duplicates data obtained from one experiment. c) Percentage IR-Dye positive IGS reporter-modified CFP+ OVCAR5 cells upon incubation with recombinant IFNγ under the indicated conditions. Bar graph shows mean of n=3 technical replicates. Representative data of two independent experiments are depicted. d) Percentage of IR-Dye positive Ag-CFP+ or Ag-IFNγR-/- OVCAR5 cells after 72h incubation with 100 ng/mL IFNγ. Bar graph shows mean of n=3 technical replicates. Representative data of three independent experiments are depicted.
Extended Data Fig. 2
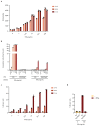
Extended Data Fig. 2. IFNγ-induced IGS reporter and PD-L1 expression in MDA-MB-231 cells.
a) Median Katushka fluorescence intensity of IGS reporter-modified CFP+ MDA-MB-231 cells upon incubation with recombinant IFNγ under the indicated conditions. Bar graph shows mean of n=3 technical replicates. Representative data from two independent experiments are depicted. b) Median fluorescence intensity of PD-L1 staining as a function of median Katushka fluorescence intensity of CFP+Ag- IGS MDA-MB-231 reporter cells incubated for 24h with recombinant IFNγ under the indicated conditions. Plot depicts representative data three technical replicates of two independent experiments. c) 20% GFP+ Ag+ cells and 80% CFP+ IGS reporter bystander MDA-MB-231 tumor cells (5 x 10⁵ total) were subcutaneously injected in NSG-β2m-/- mice. Mice were treated with HBSS (control), 5 x 10⁶ control CD8+ T cells or with 5 x 10⁶ CDK4R>L-specific CD8+ T cells, and tumors were harvested at day 3 after treatment. Bar graphs depicting mean percentage plus SD of Katushka+ reporter cells in control and tumor-specific T cell treated mice, n=5 mice per group. Representative data of two independent experiments are depicted. Two tailed Mann-Whitney U test was performed, with: p= 0.3095 (ns); p= 0.0317 (*); p= 0.0079 (**). d) Percentage of PD-L1-expressing cells of IGS reporter-modified CFP+ MDA-MB-231 cells from tumors as described in c. Bar graphs depict mean percentage of PD-L1 positive Ag- IGS cells plus SD, n=5 mice per group. Representative data of n=2 independent experiments are depicted. Two tailed Mann-Whitney U test was performed, with: p> 0.9999 (ns); p= 0.0317 (*); p= 0.0079 (**).
Extended Data Fig. 3
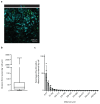
Extended Data Fig. 3. Distance from Ag- IGS cells to the nearest Ag+ cell upon tumor cell co-injection.
Analysis of the distance between Ag- IGS tumor cells and the nearest Ag+ tumor cell for the imaging experiments depicted in Fig. 3. a) Representative image of a tumor with intermingled Ag- and Ag+IGS cells. Scale bar is 100 mm b) Plots show the min., max., and mean of 25th and 75th percentile plus the median for n=4 mice. c) Percentage of Ag-IGS reporter cells in the indicated distance bins to the nearest Ag+ cell, depicted mean plus SD for n=4 mice. Data obtained from three independent experiments.
Extended Data Fig. 4
Extended Data Fig. 4. CD8+ T cell dependent Katushka signaling in IGS reporter cells in vivo.
a) Flow cytometric analysis of Katushka expression in CFP+ IGS reporter (left panel) and GFP+ Ag+ (right panel) cells derived from mixed tumors described in Fig. 2b. Data from mice treated with HBSS are depicted in blue, data from mice treated with CDK4R>L-specific CD8+ T cells are depicted in red, n=4 mice per condition, data obtained from one experiment. b) Representative images of tumors before and 120h after injection of CDK4R>L-specific CD8+ T cells (left panel, three independent experiments with n=1 mouse each) or HBSS (right panel, two independent experiments with n=1 mouse each), for the imaging experiments described in Fig. 3. SHG: Second-harmonic generation. Scale bar is 200 mm.
Extended Data Fig. 5
Extended Data Fig. 5. Analysis of T cell mediated loss of Ag-presenting tumor cells over time.
a) Relative GFP+ volume in tumors from imaging experiments described in Fig. 2 quantified over time. Mean and SEM are depicted for n=5 mice (n=5 mice for time 0, 16, 24, and 32 h; n=4 for 40, 48, and 72 h; n=3 for 120 h, from data obtained in all independent experiments. b) The distance between CFP+ bystander tumor cells and the closest GFP+ Ag+ tumor cell was determined at indicated time points from tumors described in Fig. 2 for n=2 mice. Data are obtained from two independent experiments, boxplot presenting the minimum, 25th percentile, median, 75th percentile and the maximum For total sample size per timepoint see Source Data ED_Fig5_source table.
Extended Data Fig. 6
Extended Data Fig. 6. CD8+ T cell quantification in Ag+ and Ag- IGS reporter tumor areas.
a) Quantification of mOrange2+ CD8+ T cells in tumors with spatially separated GFP+Ag+ (green) and CFP+Ag- IGS reporter cell (cyan) islands obtained by sequential injection, as described in Fig. 4d and e. Number of mOrange2+ T cells was determined in multiple three-dimensional stacks of 2.5*107 mm3 in either Ag+ or Ag- areas. Symbols represent individual mice, and mean and SD for n=4 mice are depicted, obtained from two independent experiments. Normal distribution was confirmed by D'Agostino and Pearson omnibus normality test. Two tailed unpaired t-tests were performed, p=0.0003 (***). b) Estimate of the ratio of tumor cells to T cells in Ag+ and Ag- areas under the assumption that the diameter of an average tumor cell is 24 mm. c) Purified CD8+ T cells were activated with plate-bound anti-CD3/anti-CD28 antibodies for 2h. Subsequently, cells were either left untreated or were treated with 5nM LCKi inhibitor for the indicated times. Cells were washed to remove previously secreted IFNγ, and fresh control medium or medium containing 5nM LCK inhibitor was added to the cells. After 3h incubation, supernatants were collected and IFNγ concentrations were analysed. Bar graph shows mean IFNγ concentrations of n=3 technical replicates. Representative data of four independent experiments are depicted. d) As in c, depicting the IFNγ concentration in supernatants obtained from 2h LCK inhibitor treated cell cultures as a percentage of IFNγ concentration in control, non treated cell cultures. Dots represent four independent experiments, using different T cell donors in each experiment.
Extended Data Fig. 7
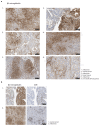
Extended Data Fig. 7. Distinct β2m positive and negative areas in human cancers.
a) Immunohistochemical staining of β2m and b) β2m and CD8 proteins on FFPE tissue of indicated human tumors. Heterogeneous β2m signal was observed in 16/51 tumors analyzed, one representative slide per tumor (obtained from resection material) was assessed and representative images are depicted in a. a. Scale bars are 100 mm. Note that CD8+ T cells in tumors predominantly localize to β2m high regions, representative images are depicted in b. Scale bars are 250 mm.
Extended Data Fig. 8
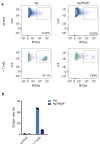
Extended Data Fig. 8. CD8+ T cell mediated killing of bystander OVCAR5 tumor cells.
A mixture of GFP+ Ag+, CFP+ Ag- IFNγR proficient and CFP+ Ag- IFNγR deficient OVCAR5 cells (2:1:1 ratio) was treated with CDK4R>L-specific CD8+ T cells at a 2:1 T cell: tumor cell ratio, or left untreated, and cell survival was analyzed by staining with IR-Dye and subsequent flow cytometry. a) Representative plots depicting the percentage of IR-Dye+ cells for the indicated groups. b) Quantification of a, bar graph shows mean of n=3 technical replicates. Representative data of two independent experiments are depicted.
Figure 1
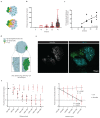
Figure 1. Characterization of the IFNγR signaling (IGS) reporter system.
a) Schematic representation of IGS reporter system. b) Percentage Katushka-expressing cells of IGS reporter-modified CFP+ OVCAR5 cells upon incubation with the indicated concentrations of recombinant IFNγ. Bar graph shows mean of n=3 technical replicates. Representative data of two independent experiments. c) Median fluorescence intensity of PD-L1 staining as a function of median Katushka fluorescence intensity of CFP+Ag- IGS reporter cells incubated for 24h with recombinant IFNγ under the indicated conditions. Representative data of two independent experiments are depicted.
Figure 2
Figure 2. In vivo identification of IFNγ sensing bystander cell.
a) Schematic representation of experimental setting in which Ag-positive and Ag- IGS reporter bystander tumor cells are intermingled. b) NSG-β2m-/- mice injected subcutaneously with a mixture of 80% GFP+Ag+ cells and 20% CFP+ IGS reporter bystander OVCAR5 tumor cells (8 x 10⁶ total) were treated with HBSS (control) or with 5 x 10⁶ CDK4R>L-specific CD8+ T cells, and tumors were harvested at day 4 after treatment. Plots show representative flow cytometry analyses used to identify Katushka+ cells within the IGS reporter cell population. c) Quantification of b, with bar graphs depicting mean percentage plus SD of Katushka+ reporter cells in control and T cell treated mice, n=6 mice per group. Representative data from three independent experiments are depicted. p= 0.0022 (**) d) Mouse tumors consisting of a mixture of GFP+Ag+ tumor cells (10%) and CFP+ IGS reporter cells (90%) (left two bars), or solely consisting of CFP+ IGS reporter cells (right two bars) were generated as in b. Mice were then treated with either HBSS (control) or 5 x 10⁶ CDK4R>L-specific CD8+ T cells, and tumors were harvested at day 3 after treatment. Bar graphs depict mean percentage of Katushka+ reporter cells with n=3 mice per group plus SD. Representative data of two biologically independent experiments are depicted. Fold differences (F.D.) were calculated by dividing the means of T cell treated and HBSS treated groups. e) Mouse tumors consisting of 10%-90% mixtures of GFP+Ag+ tumor cells and IFNγR deficient or IFNγR proficient CFP+ IGS reporter cells were generated as in b. Mice were then treated with 5 x 10⁶ CDK4R>L-specific CD8+ T cells, and tumors were harvested at day three after treatment. Bar graphs depict mean percentage of Katushka positive reporter cells plus SD, n=5 mice per group. Representative data of two independent experiments are depicted p= 0.0079 (**). Two-tailed Mann-Whitney U-tests were performed for all statistical analyses.
Figure 3
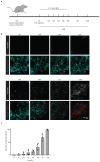
Figure 3. Kinetics of IFNγ sensing by bystander tumor cells.
a) Illustration of imaging window setup and experimental timeline. At the indicated time points in the 0h – 120h time window, intravital imaging of tumor lesions was performed. b) Sequential intravital 2-photon imaging of tumors consisting of 10% GFP+ Ag+ tumor cells (green) and 90% CFP+ IGS reporter bystander tumor cells (cyan) was initiated 14 days following injection of tumor cells (8 *106 cells total) into the mouse mammary gland. Upon IGS reporter activation, cells gain Katushka signal (white in upper panel, red in lower panel). A representative imaging series of a tumor region with Katushka reporter expression (top panel) and merge of GFP+Ag+ (green), CFP+Ag- (cyan) and Katushka reporter (red) (lower panel) signal is depicted over time. Scale bar is 100 mm. Data are representative of c. c) Quantification of the percentage of IGS Katushka+ cells in the Ag- cell population showing the mean plus SD over time. Symbols represent data from different animals (n=5 mice for time 0, 16, 24, and 32h; n=4 mice for 40, 48, and 72h; n=3 mice for 120, obtained in all independent experiments. IVM: intravital microscopy.
Figure 4
Figure 4. Long distance spreading of CD8+ T cell derived IFNγ from sites of antigen presentation.
a) Cartoon depicting the distances (yellow arrows) between individual Katushka+ cells and the nearest Ag+ cell, as measured in b and c. b) Distance between Katushka+ reporter tumor cells and the closest GFP+ Ag+ tumor cell at the indicated time points for the imaging experiments shown in Fig. 3 are depicted in a boxplot presenting the minimum, 25th percentile, median, 75th percentile and the maximum. Data from a representative tumor are depicted, dots represent individual Katushka+ cells. For total sample size per timepoint see Source Data Fig 4. c) 75th percentile of the distances between Katushka+ cells and the closest Ag+ cell as a function of time, using data from n=5 mice obtained in all independent experiments. Symbols represent different mice, and a logarithmic regression analysis of the data is depicted (R2= 0.4249). d) Schematic representation of experimental setting in which large islands of Ag-positive tumor cells and IGS reporter Ag- bystander cells are spatially separated. e) Representative 2-photon confocal images of Katushka signal (left panel, white) in a tumor with spatially separated GFP+Ag+ (green) and CFP+Ag- IGS reporter cells (cyan) islands, obtained by sequential injection of Ag- and Ag+ cells. Scale bar is 500 mm. Note the spreading of the Katushka signal (white) far into the CFP-Ag- tumor area. f) Quantification of relative fluorescence intensity of Katushka (black) and CFP (grey) at the indicated distances from the Ag+ area. Mean fluorescence intensity was normalized to the mean intensity measured between 200-400 mm. Left panel: dots represent individual tumors, and mean and SD for n=7 mice are depicted, using data from two independent experiments. Right panel: regression line for data presented in the left panel, for signals above background. Note the significant decrease of Katushka signal proportional to the distance to the Ag+ area, p<0.00001 and R2=0.625, while CFP signal is unaltered, p=0.521 (ns) and R2=0.092. P-values determined by one-tailed F-test, testing if the slope is different from zero.
Figure 5
Figure 5. Functional consequences of CD8+ T cell derived IFNγ.
a) NSG-β2m-/- mice injected subcutaneously with a mixture of 10% GFP+Ag+ cells and 90% CFP+ IGS reporter bystander OVCAR5 tumor cells (8 x 10⁶ total) were treated with HBSS (control) or with 5 x 10⁶ CDK4R>L-specific CD8+ T cells, and tumors were harvested at day 3 after treatment. Bar graphs depict mean percentage of PD-L1+ Ag- IGS cells plus SD from n=5 mice per group. Representative data from three independent experiments are depicted. Two-tailed Mann-Whitney U-tests was performed p=0.0079 (**) .b) A mixture of 50% GFP+Ag+ cells, 25% CFP+ bystander and 25% CFP+ Katushka+ IFNγR-/- bystander OVCAR5 tumor cells was cocultured with CDK4R>L-specific CD8+ T cells at a T cell - tumor cell ratio of 5:1, and cells were analyzed by flow cytometry at the indicated time points. Representative data of three independent experiments are depicted, symbols represent technical duplicates. Cell counts were normalized to counting beads. Pie chart representations above the bar graphs depict the ratio of bystander and IFNγR-/- bystander cells under the indicated conditions. c) GFP+ Ag+, CFP+ Ag- and CFP+ Katushka+Ag- IFNγR-/- OVCAR5 cells were mixed (80%-10%-10%) and 8 x 10⁶ cells were injected subcutaneously into NSG-β2m-/- mice. At day 7, mice were either treated with 5 x 10⁶ CDK4R>L-specific CD8+ T cells or control T cells, or received HBSS. At day 21 post treatment, tumors were harvested and the ratio between the indicated cell populations was determined by flow cytometry. Each dot represents one tumor, bar graphs show mean of the indicated groups plus SD, n=6 mice per group. Representative data of three independent experiments are depicted. p=0.0931 (ns); p= 0.0022 (**) d) NSG-β2m-/- mice were injected subcutaneously with 50% GFP+Ag+ and 50% CFP+Ag-Luc+ cells (8 x 10⁶ total) in one flank and 50% GFP+Ag+ and 50% CFP+Ag-IFNγR-/-Luc+ (8 x 10⁶ total) OVCAR5 cells in the other flank. At day 7, mice were treated with HBSS (control) or 5 x 10⁶ CDK4R>L-specific CD8+ T cells. Data represent mean tumor volume, error bars indicate SEM of biological replicates, n=4 mice for group HBSS Ag-IFNγR-/- n=5 mice for other groups. Two-tailed Mann-Whitney U-tests were performed for all timepoints, with significant differences from day 14 onwards. p=0.0047 (**); p=0.979 (ns). Representative data from three independent experiments are depicted. e) Growth of CFP+Ag-Luc+ and CFP+Ag-IFNγR-/-Luc+ cells was monitored by bioluminescence imaging from tumors described in d. Graph depicts the ratio of CFP+Ag-IFNγR-/-Luc+ to CFP+Ag-Luc+ photon flux/s measured in the same animal. Two-tailed Mann-Whitney U-tests were performed for each time point, p=0.0159 (*). f) As in c, but using CFP+Ag- and CFP+Ag-IFNγR-/- tumor cells that were deficient in HLA-A*02. Each dot represents one tumor, bar graphs represent mean of the indicated groups plus SD, n=5 mice per group. Representative data of two independent experiments are depicted. Two-tailed Mann-Whitney U-tests were performed for all statistical analyses, p= 0.064 (ns); p= 0.0022 (**). g) Mixed tumors consisting of intermingled GFP+Ag+, Ag- bystander cells and Ag-IFNγR deficient bystander cells, and island tumors in which GFP+Ag+ were separated from intermingled Ag- bystander cells and Ag-IFNγR deficient bystander cells were generated. Ratio between CFP+Ag-IFNγR-/- and CFP+Ag- in both spatial arrangements were determined by flow cytometry 14 days after HBSS (control) or T cell treatment. Bar graph depicts mean of the indicated groups plus SD, n=5-6 mice per group. Representative data of two independent experiments are depicted. p= 0.222 (ns); p< 0.005 (**)

Comment in

  • Carpet-bombing tumors with IFN-γ.
    Hu KH, Krummel MF. Hu KH, et al. Nat Cancer. 2020 Mar;1(3):270-272. doi: 10.1038/s43018-020-0042-6. Nat Cancer. 2020. PMID: 35122031 No abstract available.

Similar articles

Cited by

References

    1. Durgeau A, Virk Y, Corgnac S, Mami-Chouaib F. Recent Advances in Targeting CD8 T-Cell Immunity for More Effective Cancer Immunotherapy. Front Immunol. 2018;9:14. - PMC - PubMed
    1. Hadrup S, Donia M, Thor Straten P. Effector CD4 and CD8 T cells and their role in the tumor microenvironment. Cancer Microenviron. 2013;6:123–133. - PMC - PubMed
    1. Galon J, et al. Type, density, and location of immune cells within human colorectal tumors predict clinical outcome. Science. 2006;313:1960–1964. - PubMed
    1. Ribas A, Wolchok JD. Cancer immunotherapy using checkpoint blockade. Science. 2018;359:1350–1355. - PMC - PubMed
    1. Tumeh PC, et al. PD-1 blockade induces responses by inhibiting adaptive immune resistance. Nature. 2014;515:568–571. - PMC - PubMed

Publication types

MeSH terms