. 2020 Aug 10;38(2):198-211.e8.
doi: 10.1016/j.ccell.2020.05.010. Epub 2020 Jun 18.

Altered RNA Splicing by Mutant p53 Activates Oncogenic RAS Signaling in Pancreatic Cancer

Affiliations

Altered RNA Splicing by Mutant p53 Activates Oncogenic RAS Signaling in Pancreatic Cancer

Luisa F Escobar-Hoyos et al. Cancer Cell. .

Abstract

Pancreatic ductal adenocarcinoma (PDAC) is driven by co-existing mutations in KRAS and TP53. However, how these mutations collaborate to promote this cancer is unknown. Here, we uncover sequence-specific changes in RNA splicing enforced by mutant p53 which enhance KRAS activity. Mutant p53 increases expression of splicing regulator hnRNPK to promote inclusion of cytosine-rich exons within GTPase-activating proteins (GAPs), negative regulators of RAS family members. Mutant p53-enforced GAP isoforms lose cell membrane association, leading to heightened KRAS activity. Preventing cytosine-rich exon inclusion in mutant KRAS/p53 PDACs decreases tumor growth. Moreover, mutant p53 PDACs are sensitized to inhibition of splicing via spliceosome inhibitors. These data provide insight into co-enrichment of KRAS and p53 mutations and therapeutics targeting this mechanism in PDAC.

Keywords: GAP17; GTPase signaling; KRAS; RNA splicing; SF3B1; hnRNPK; oncogenes; p53; pancreatic cancer; splicing inhibitors.


Conflict of interest statement

Declaration of Interests L.F.E.-H. is a consultant for KDx Diagnostics Inc and OncoGenesis Inc. O.A.-W. served as a consultant for H3B Biomedicine, Foundation Medicine Inc, Merck, and Janssen, and is on the scientific advisory board of Envisagenics; O.A.-W. received prior research funding from H3B Biomedicine unrelated to the current manuscript and serves on the Scientific Advisory Board of Envisagenics Inc. S.D.L. is a member of the Scientific Advisory Board for Nybo Pharmaceuticals and co-founder of Episteme Prognostics.

Figures
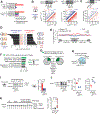
Figure 1:
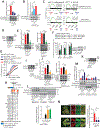
Figure 1:. p53R175H promotes C-rich cassette exons, impacting expression of GAP isoforms in pancreatic cancer.
A. Differentially spliced exons in PDAC patients with missense hotspot mutations in p53 compared to those with WT TP53 and nonsense/frameshift mutations in p53 (“Trunc”). RNA-Seq from the ICGC (Bailey et al., 2016). B-C. Differentially spliced exons whose inclusion was significantly promoted (red circles) or repressed (blue circles) in p53R175H versus control cells with knockdown of p53R175H. Splicing events quantified using ‘percent spliced in’ (PSI, or Ψ) value. Promoted and repressed exons are defined as those whose Ψ values are increased or decreased ≥10%, respectively (N). Grey circles: exons where ΔΨ is <10%. Statistical significance calculated using Kolmogorov-Smirnov test. PDAC patient organoids (KRASG12D/+; p53R172H/−) and murine KPC cells following transduction with doxycycline-inducible control (shR) or anti-p53 shRNAs (sh1 and 2) (B). RNA-seq and westerns performed after 5 days of doxycycline, n = 3. Murine PanIN organoids (KrasG12D/+; WT p53; Mist1-Cre) bearing p53R172H/+ introduced by CRISPR, compared to WT p53 (C). RNA-seq and westerns performed 20 days after confirmation of genome editing, n= 3. D. Nucleotide motifs enriched in repressed and promoted exons by p53R175H identified from comparisons in B-C. E. Spatial distribution and relative frequency of CCC and AAA motifs in exons promoted versus repressed by p53R172H in murine PDAC cells. Shading, 95% confidence interval by bootstrapping. F. Left, Gene Ontology analysis of mRNAs with polyC exons based on the comparisons in B-C. p values for multiple comparisons. Green bars, biologic processes involving GAPs of RAS GTPases. Right, schema of how GAPs terminate signaling by inducing GTP hydrolysis of GTP-bound RAS. G. Percentage of GAPs that undergo alternative splicing (AS) in the presence of p53R175H in patient and murine PDAC. GAP mRNAs with exon splicing events in both human and murine PDACs listed. H. Intersection of GAP mRNAs that gain polyC exons by p53R175H from A-C comparisons. Fisher’s exact test p= 0.0007. I. Qualitative and quantitative RT-PCRs of GAP17 AS in KPC cells in the presence or absence of mutant p53. Left, schematic of primers that flank the two exons (exons 16 and 18) surrounding the polyC exon (exon 17). Upper band denotes inclusion of polyC exon, while lower band corresponds to isoform lacking the polyC exon. Right, qRT-PCR quantification of inclusion of exon 17 using primers that flank the exon junctions. Mean ± s.d, n = 3 replicates/condition. Student’s t-test. J. Western blot and quantifications demonstrating loss of GAP17 isoforms +/− polyC exons under p53R172H knockdown or renilla control in KPC cells. Mean ± s.d, n = 3 replicates/condition. Student’s t-test. K. RT-PCR (left) and qRT-PCRs (right) of GAP17 AS revealing distinct isoforms in patient PDAC organoids with WT p53, truncated p53 (Trunc), and hotspot mutations (using same primer approach as in (I)). Mean ± s.d, Student’s t-test. s.d, standard deviation; n, number of repetitions. *p < 0.05, **p < 0.01, ***p < 0.001, **** p < 0.0001. See also Figures S1–S2. Tables S1–S3.
Figure 2:
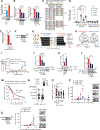
Figure 2:. GAP17 isoforms promote GTP-hydrolysis of RAS small-GTPases and impact membrane localization.
A. Affinity precipitation of GTP-bound KRASG12D in KPC cells following transduction with doxycycline-inducible control (shR) or anti-p53 shRNAs (sh1 and 2). Analysis performed after 5 days of doxycycline. Precipitation using GST-Raf1-RBD fusion protein, blotting using RasG12D antibody. Mean ± s.d, n= 3 replicates/condition. Student’s t-test. B. Affinity precipitation of GTP-bound KRASG12D in murine PDAC cells with null p53 (KPFLC cells) overexpressing human wild-type p53 (WT), p53R175H (R175H) and empty vector (EV). Precipitation and blotting performed as in A. Mean ± s.d, n= 3 replicates/condition. Student’s t-test. C. GSEA plots showing p53R175H tumors positively associated with small GTPase and RAS-activated gene signatures in PDAC patients (Bailey et al., 2016). D. Western demonstrating overexpression of + polyC or −polyC GAP17 isoforms or EV in KPC cells. E. Left, affinity precipitation of GTP-bound active KRASG12D in KPC cells following overexpression of +polyC and −polyC GAP17 isoforms. Precipitation and blotting performed as in A. Right, relative Erk phosphorylation in KPC cells following overexpression of +polyC or −polyC GAP17 isoforms or EV. n = 3 replicates/condition. Mean ± s.d, Student’s t-test. F. Fractional GTP remaining (%) after combining purified WT KRAS, WT Rho-A, or KRASG12D mutant proteins with purified full-length GAP17 +polyC and −polyC isoform proteins. Catalytic domain of p120 used as control. Measurements taken after 2 h of reaction. Coomassie stain for purified individual full-length +polyC and −polyC GAP17 proteins. Mean ± s.d, n = 3 replicates/condition. Student’s t-test. G. Real time measurement of GTP hydrolysis of recombinant full-length WT and mutant G12D KRAS and recombinant GAP17 Rho-GAP domain (residues 245–489). Measurements taken up to 20200 sec. Mean ± s.d, n = 3 replicates/condition. H. Residue motif enrichment encoded by polyC exons in GAPs promoted by p53R175H/−. Bottom, alignment of representative PPXP motifs gained in GAPs by p53R175H/−. I. Western for expression of GAP17 in KPFLC cells encoding EV or +polyC GAP17 with WT PPXP motif or mutant PPXP motif (“AAxA”). J. Affinity precipitation of GTP-bound active KRASG12D (left) or p-Erk (right) in KPFLC cells following overexpression of PPXP or AAXA +polyC GAP17 constructs or EV. Precipitation and blotting performed as in A. n = 3 replicates/condition. Mean ± s.d, Student’s t-test. K. Western for expression of FLAG-tagged GAP17 isoforms (+polyC and −polyC) and +polyC mutant (AAXA) in p53-null murine PDAC KPFLC cells. L. Relative membrane localization of each FLAG-tagged GAP17 isoform in p53-null PDACs KPFLC cells after 20% FBS stimulation and obtaining cell-membrane enriched fraction. Anti-FLAG antibody used to measure membrane localization. Pan-cadherin: membrane marker; actin: cytoplasmic fraction; histone H3: nuclear fraction. n = 3 replicates/condition. Mean ± s.d, Student’s t-test. M. Relative membrane and cytosolic localization of endogenous GAP17 in KPC cells following transduction with doxycycline-inducible control (shR) or anti-p53 shRNAs (sh1 and 2). n = 3 replicates/condition. Mean ± s.d, Student’s t-test. N. Immunofluorescence of endogenous GAP17 in KPC cells following transduction with shR or anti-p53 shRNAs. Arrowheads: membrane co-localization of GAP17 and cadherin. Scale bars: 50 and 5 μm. n = 10–20 random photos/condition. Mean ± s.d, Student’s t-test. s.d, standard deviation; n, number of repetitions. *p < 0.05, **p < 0.01, ***p < 0.001, **** p < 0.0001. See also Figure S3.
Figure 3:
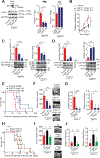
Figure 3:. Mutant p53 regulates hnRNPK to promote inclusion of +polyC GAP17.
A. Expression of hnRNPK in PanIN organoids (KrasG12D/+; Mist1-Cre) bearing p53R172H/+ compared to WT p53. qRT-PCR and western performed 20 days after genome editing confirmation. n = 3 replicates/condition. Mean ± s.d, Student’s t-test. B. Expression of hnRNPK after knockdown of p53R175H in PDAC patient organoids (left, KRASG12D/+; TP53R175H/−) and KPC cells following transduction with doxycycline-inducible control (shR) or anti-p53 shRNAs (sh1 and 2) (right). qRT-PCR and western performed after 5 days of doxycycline. n = 3 replicates/condition. Mean ± s.d, Student’s t-test. C. Top, nucleotide sequence logo of full and half-site p53 binding sites (Wei et al., 2006). Bottom, predicted p53-DNA binding sites in mouse and human hnRNPK promoters. D. TdTomato reporter expression in WT hnRNPK promoter (−1429 to +260) and with “CATG”-deleted from p53 binding sites in p53 null PDAC cells (KPFLC cells), engineered to express human p53 mutants, WT p53, or empty vector (EV) control. n = 3 replicates/condition. Mean ± s.d, Student’s t-test. E. TdTomato expression driven by the hnRNPK promoter using WT and “CATG”-deleted promoter sites in isogenic KPC cells. n = 3 replicates/condition. Mean ± s.d, Student’s t-test. F. hnRNPK western in KPC cells following transduction with control non-targeting shRNA (NC) or anti-hnRNPK shRNAs (sh1 and 2). G. Sequences enriched in repressed and promoted exons from RNA-Seq of KPC cells with knockdown of hnRNPK or negative control. H. Intersection of differentially spliced exons by p53R172H and hnRNPK in KPC cells. Promoted (Fisher’s exact test p= 9.48E-06) and repressed (Fisher’s exact test p= 0.000149) exons shown. I. Recombinant GST-hnRNPK protein (left). In vitro filter binding assays confirms interaction between recombinant hnRNPK and GAP17 +polyC exon. Known interactor of hnRNPK (polyC sequence) shown as positive control (C16-grey). Negative control in yellow (polyN sequence N16). Mean ± s.d, n = 3 replicates/condition. Student’s t-test. J. RT-PCR and qRT-PCRs of GAP17 splicing in KPC cells with knockdown of hnRNPK compared to cells expressing control shRNAs (NC). RT-PCR using primers that flank the junctions of polyC exon (exon 17). Upper band: inclusion of exon 17; lower band: isoform lacking exon 17. qRT-PCRs for quantification of +polyC GAP17 retention using primers that flank junctions between exon 17 and adjacent exons. Mean ± s.d, n = 3 replicates/condition. Student’s t-test. K. RT-PCR and qRT-PCRs of GAP17 splicing in KPFLC cells with overexpression of hnRNPK compared to cells expressing EV. RT-PCRs and qRT-PCRs as described in J. Mean ± s.d, n = 3 replicates/condition. Student’s t-test. L. Affinity precipitation of GTP-bound KRASG12D in KPC cells following transduction with control shRNA (NC) or anti-hnRNPK shRNAs (sh1 and 2). Precipitation using GST-Raf1-RBD fusion protein, blotting using RasG12D antibody. Mean ± s.d, n = 3 replicates/condition. Student’s t-test. M. Kaplan-Meier survival (log-rank Mantel-Cox test) of patients with PDACs expressing high- or low-hnRNPK mRNA (defined by the Akaike Information Criterion (Kletting and Glatting, 2009)). RNA-Seq from TCGA (n= 179) and ICGC (Bailey et al., 2016) (n= 88). N. Statistical enrichment of p53 mutations (y axis) across PDACs expressing low (n=232) or high (n= 29) hnRNPK (y axis). Student’s t-test. O. hnRNPK expression in ICGC PDACs (n= 88) with p53 hotspot mutations, WT p53, nonsense or frameshift mutations (“truncating mutations”), and other mutations. Student’s t-test. P. T umor volume by 3D-ultrasound of mutant p53 KPC cells expressing control or anti-hnRNPK sh1 and 2. Arrow, tumor regression time point. Representative ultrasound images of tumors (T). Mean ± s.d, n = 5–6 animals/condition, Student’s t-test. Q. Tumor volume by 3D-ultrasound of p53 null KPFLC cells expressing control or anti-hnRNPK. Representative ultrasound images of PDAC tumors (T). Mean ± s.d, n = 5–6 animals/condition, Student’s t-test. s.d, standard deviation; n, number of repetitions. *p < 0.05, **p < 0.01, ***p < 0.001, ****p < 0.0001. See also Figure S4 and Tables S4–5.
Figure 4:
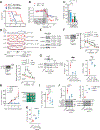
Figure 4:. Targeting GAP17 isoforms decreases KRASG12D activation and increases survival in pancreatic cancer models.
A. Top left, schematic of isoform specific shRNAs targeting +polyC exon of GAP17 promoted by p53R172H. Bottom left, RT-PCR demonstrating isoform-specific knockdown of +polyC GAP17 in KPC cells using shRNAs against polyC exons (PolyC sh1 and sh2), compared to non-targeting control. Upper band: +polyC isoform; lower band: −polyC isoform. Right, qRT-PCRs for quantification of +polyC GAP17 or −polyC GAP17 isoform using primers that flank junctions between polyC exon and adjacent exons (exons 16 and 18) or primers that flank the junction between exons 16 and 18. Mean ± s.d, n = 3 replicates/condition. Student’s t-test. B. Proliferation of KPC cells expressing control or +polyC GAP17 sh1 and sh2. Mean ± s.d, n = 3 repetitions/condition, Student’s t-test. C. Affinity precipitation of GTP-bound active KRASG12D (left) or p-ERK (right) in KPC cells with knockdown of polyC GAP17 isoforms or control. Precipitation using GST-RAF1-RBD fusion protein, blotting using RASG12D antibody. Mean ± s.d, n = 3 replicates/condition. Student’s t-test. D. Affinity precipitation of GTP-bound active RHO (left) and phosphorylated COFILIN (inactive form, bottom left) in KPC cells with knockdown of + polyC GAP17 isoform and control. Mean ± s.d, n = 3 replicates, Student’s t-test. E. Kaplan-Meier survival (log-rank Mantel-Cox test) following orthotopic syngeneic transplantation of KPC cells expressing control or shRNAs against +polyC GAP17. n = 5–6 animals/condition. F. Tumor volume by 3D-ultrasound 30 days post-orthotopic injection of cells expressing control or +polyC GAP17 sh1 or 2. Ultrasound images of tumors (T). S: Skin. Mean ± s.d, n = 5–6 animals/condition, Student’s t-test. G. Number of hepatic and splenic metastases per animal bearing PDACs with expression of control or +polyC GAP17 sh1 and 2. Mean ± s.d, n = 5 animals/condition, Student’s t-test. H. Kaplan-Meier survival (log-rank Mantel-Cox test) following orthotopic syngeneic transplantation of KPC cells with overexpression of +polyC or −polyC GAP17 isoforms or empty vector (EV). n = 5–6 animals/condition. I. Tumor volume by 3D-ultrasound 30 days post-orthotopic injection of KPC cells expressing + polyC GAP17, −polyC GAP17, or EV. Representative ultrasound images of tumors (T). S: Skin. Mean ± s.d, n= 5 animals/condition, one-way ANOVA with Tukey multiple comparison. J. Number of hepatic and splenic metastases per animal bearing PDACs with overexpression of +polyC or −polyC GAP17 or EV. Mean ± s.d, n = 3 repetitions/condition, Student’s t-test. s.d, standard deviation; n, number of repetitions. *p < 0.05, **p < 0.01, ***p < 0.001, **** p < 0.0001. See also Figure S5.
Figure 5:
Figure 5:. The spliceosome and polyC GAP isoforms are therapeutic vulnerabilities in p53R172H-pancreatic cancers.
A. Kaplan-Meier survival (log-rank Mantel–Cox test) following orthotopic syngeneic transplantation of KPC cells with either control renilla shRNA (shR) or shRNAs against p53 (sh1) and treated with either vehicle or H3B-8800 (at 8 mg/kg). Data are mean ± s.d, n = 5–11 injected animals/condition. For p53R172H shR vehicle versus H3B-8800, hazard ratio (HR) = 156, 95%CI= 17.16–1431; for p53R172H sh1 vehicle versus H3B-8800, HR= 76.5, 95%CI 9.47–617.9; for p53R172H sh1 versus shR (both with H3B-8800), HR= 17.25, 95%CI 4.92–60.4. B. Dose-response curves in p53R172H expressing cells (shR) compared to sh1 cells treated with H3B-8800 for 48h. Relative proliferation index established by comparing cells treated with DMSO. Inset indicates inhibitor concentration that reduced proliferation by half (IC50) and that killed half of the cells (LD50). NA-Not applicable. Data represent mean ± s.d; n = 3 repetitions/condition, Student’s t-test. RNA-seq performed across a range of non-cytotoxic concentrations (grey box) to compare differences in exon splicing in cells with or without p53R172H. C. IC50s to H3B-8800 in p53-null PDAC cells (KPFLC cells) overexpressing human wild-type p53 (WT), missense hotspot mutants R175H; R248Q; R273H, or empty vector (EV). Treatment for 48 h was done 30 days after confirmed overexpression. Data represent mean ± s.d; n = 3 repetitions/condition, Student’s t-test. D. Sashimi plots illustrating C-rich exon (exon 17; E17) in GAP17 in murine PDAC cells without (sh1) or with mutant p53R172H (shR), untreated with H3B-8800 (top two sashimi plots). Bottom three sashimi plots refer to cells with mutant p53R172H (shR) treated with three non-cytotoxic H3B-8800 concentrations. PSI value is provided for each condition. E. RT-PCR of loss of polyC exons in representative GAPs (Asap1, Rasa4 and Gap4) in KPC cells expressing p53R172H treated with non-cytotoxic H3B-8800 concentrations or vehicle, using primers that flank polyC exons. Upper bands in RT-PCRs denote the +polyC isoform, while lower bands correspond −polyC exon to isoforms. F. Left, westerns of cDNAs encoding polyC and no polyC isoforms of GAPs (GAP17 and Asap1) or EV in KPC cells. Molecular weight difference between +polyC and −polyC ASAP1 isoforms is not large enough to distinguish by western. Right, dose-response curves in p53R172H-expressing cells overexpressing polyC and non-polyC isoforms of GAPs GAP17 and ASAP1, or EV treated with H3B-8800 for 48 h. Mean ± s.d; n = 3–5 repetitions/condition, Student’s t-test. G. Schematic of antisense oligonucleotides (ASOs) (top left) and corresponding RT-PCRs (bottom left) and qRT-PCRs (right) for quantification of +polyC GAP17 or −polyC GAP17 isoforms in KPC cells 48 h after treatment with 10 μM ASOs. Mean ± s.d, n = 3 repetitions, Student’s t-test. H. Left, tumor volume after in vivo ASO treatment of KPC sub-cutaneous xenografts. Tumor volume measured twice/week during treatment with non-targeting ASO control (NC) or +polyC GAP17-targeting ASOs. ASOs given at 12.5 mg/kg, every other day intratumorally. Right, representative PDAC images. Mean ± s.d, One-way ANOVA, with Tukey multiple comparison. I. Immunohistochemistry quantification for p-ERK1/2 in PDACs treated with non-targeting ASO control or +polyC GAP17-targeting ASOs. Mean ± s.d, n = 5 PDACs, One-way ANOVA, with Tukey multiple comparison. J. Relative p-ERK1/2 (left) and p-COFILIN (right) in non-targeting ASO control (NC) or +polyC GAP17 targeting ASOs (ASO1 and 2). Lysates generated from viable tumor areas. Data represent mean ± s.d, n = 5 PDAC, One-way ANOVA, with Tukey multiple comparison. K. Percentage necrotic tumor area following in vivo ASO treatment of KPC allografts. Data represent mean ± s.d, n = 3–5 PDACs, One-way ANOVA, with Tukey multiple comparison. s.d, standard deviation; n, number of repetitions; # p< 0.1*p < 0.05, **p < 0.01, ***p < 0.001, ****p< 0.0001. See also Figure S5.

Similar articles

Cited by

References

    1. Agbunag C, Lee KE, Buontempo S, and Bar-Sagi D (2006). Pancreatic duct epithelial cell isolation and cultivation in two-dimensional and three-dimensional culture systems. Methods Enzymol 407, 703–710. - PubMed
    1. Aguirre AJ, and Hahn WC (2018). Synthetic Lethal Vulnerabilities in KRAS-Mutant Cancers. Cold Spring Harb Perspect Med 8. - PMC - PubMed
    1. Anczuków O, Rosenberg AZ, Akerman M, Das S, Zhan L, Karni R, Muthuswamy SK, and Krainer AR (2012). The splicing factor SRSF1 regulates apoptosis and proliferation to promote mammary epithelial cell transformation. Nature structural & molecular biology 19, 220–228. - PMC - PubMed
    1. Ardito CM, Gruner BM, Takeuchi KK, Lubeseder-Martellato C, Teichmann N, Mazur PK, Delgiorno KE, Carpenter ES, Halbrook CJ, Hall JC, et al. (2012). EGF receptor is required for KRAS-induced pancreatic tumorigenesis. Cancer Cell 22, 304–317. - PMC - PubMed
    1. Bailey P, Chang DK, Nones K, Johns AL, Patch AM, Gingras MC, Miller DK, Christ AN, Bruxner TJ, Quinn MC, et al. (2016). Genomic analyses identify molecular subtypes of pancreatic cancer. Nature 531, 47–52. - PubMed

Publication types

MeSH terms

Substances