. 2020 Jun 17;11(1):3084.
doi: 10.1038/s41467-020-16616-8.

p53 destabilizing protein skews asymmetric division and enhances NOTCH activation to direct self-renewal of TICs

Affiliations

p53 destabilizing protein skews asymmetric division and enhances NOTCH activation to direct self-renewal of TICs

Hye Yeon Choi et al. Nat Commun. .

Abstract

Tumor-initiating stem-like cells (TICs) are defective in maintaining asymmetric cell division and responsible for tumor recurrence. Cell-fate-determinant molecule NUMB-interacting protein (TBC1D15) is overexpressed and contributes to p53 degradation in TICs. Here we identify TBC1D15-mediated oncogenic mechanisms and tested the tumorigenic roles of TBC1D15 in vivo. We examined hepatocellular carcinoma (HCC) development in alcohol Western diet-fed hepatitis C virus NS5A Tg mice with hepatocyte-specific TBC1D15 deficiency or expression of non-phosphorylatable NUMB mutations. Liver-specific TBC1D15 deficiency or non-p-NUMB expression reduced TIC numbers and HCC development. TBC1D15-NuMA1 association impaired asymmetric division machinery by hijacking NuMA from LGN binding, thereby favoring TIC self-renewal. TBC1D15-NOTCH1 interaction activated and stabilized NOTCH1 which upregulated transcription of NANOG essential for TIC expansion. TBC1D15 activated three novel oncogenic pathways to promote self-renewal, p53 loss, and Nanog transcription in TICs. Thus, this central regulator could serve as a potential therapeutic target for treatment of HCC.


Conflict of interest statement

The authors declare no competing interests.

Figures
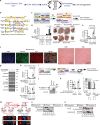
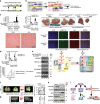
Fig. 1
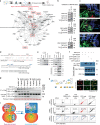
Fig. 1. TBC1D15 inhibits hepatocyte differentiation, maintain symmetric cell division, and promotes oncogenesis.
a Hypothetical model. Novel NUMB-binding protein TBC1D15 promotes NUMB phosphorylation and p53 degradation. b Targeted disruption of mouse Tbc1d15 gene by Cre-LoxP system. c Schematic illustrations of how tumor incidence and tumor growth in Alb::CreERT2;Tbc1d15FL/FL;NS5A vs Tbc1d15FL/FL;NS5A mice. d The incidence was reduced in TBC1D15 deficient hepatocytes mice. Error bars represent ±SEM. p Values are shown from a chi-square test *p = 0.000465 (chi-square test). e Ratio of tumor mass over liver mass (%) was decreased in TBC1D15 deficient hepatocytes mice. Error bars represent ±SEM. p Values are shown from a chi-square test. *p = 0.000229 (Student’s t test). f (left) Immunostaining showed Vimentin and AFP expression in liver tumor tissues. Scale bar, 30.32 μm. (right) H&E staining displayed HCC histology. g Immunoblots of liver proteins from TBC1D15 deficient hepatocytes mice. h (top) The percentage of CD133+/CD49f +/CD45− TICs in total tumor cells determined by FACS analysis. The percentage of TICs of tumor cells were calculated as mean ± SD (n = 3). *p = 0.00047 (Student’s t test). (bottom) Spheroid formation of Isolated CD133+/CD49f+/CD45− TICs. Spheroid numbers were counted as mean ± SD (n = 3). *p < 0.01 (Student’s t test). i Schematic illustrations of how tumor incidence in vector and adenovirus-based Cre expression in ES cells. j Expression of a N-TBC1D15 was validated by immunoblot analysis. k Hepatocyte differentiation makers, Albumin and HNF4A measured by qRT-PCR, show marked downregulations by N-TBC1D15 expression. Data are represented as mean ± SEM (n = 4). p-Values by two-tailed unpaired t test. *p < 0.0001 (Student’s t test). l Tumor incidence was increased in the mice implanted with ES cells expressing N-TBC1D15. Error bars represent ±SEM. p-Values by two-tailed unpaired t test. *p = 0.007313 (chi-square test). m (top) Schematic illustrations of how asymmetrical vs symmetrical division controlled by NUMB and TBC1D15. (bottom) Immunofluorescence analyses of TICs. Scale bar, 10 μm. n, o The percentage of asymmetrical vs symmetrical division in TBC1D15 knockdown, overexpression of TICs (n) and in Nanog knockdown of normal hepatoblasts isolated from fetal mouse livers (o). The representative pictures are shown from three independent experiments. Oblique: ambiguous phenotype between asymmetric and symmetric cell division. Source data are provided as a Source Data file.
Fig. 2
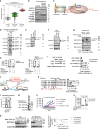
Fig. 2. TBC1D15–NuMA1 interaction inhibits asymmetric cell division via inhibition of key asymmetric machinery, NuMA1–LGN interaction.
a Shotgun LC–MS/MS was performed on immunoaffinity purified TBC1D15-interacting proteins (highlighted in red boxes; NuMA1, RANGAP1, and NOTCH1, 2, 3, 4). b Co-immunoprecipitation-immunoblot analysis confirmed that TBC1D15 interacts with NOTCH1/2, NuMA1, and RANGAP1. c In silico analysis predicts an interaction between TBC1D15 and NuMA1. (top) Structure model of TBC1D15 (green) binding NuMA1 (blue). (middle) Docking between TBC1D15 and NuMA1 was simulated. (bottom) TBC1D docked to NUMA with further alignment of LGN (3ro2), showing partial competition for the binding site of NUMA. TBC1D15 in green, LGN in blue, and partial NUMA in yellow. d Human TBC1D15 protein has 51% homology with Drosophila cell fate determinant Canoe (SNO: Mammalian AFADIN homologue) that binds mammalian homologue of LGN (Drosophila Pins). e IP-Western blot analysis (left panel) and reverse IP-Western blot analysis (right panel) were performed in TBC1D15 overexpression. f Domain mapping of TBC1D15 binding domain of NuMA1 by using GFP-fused NuMA1 truncation or mutant proteins and Flag-tagged TBC1D15. g The binding of purified flag-TBC1D15 protein with or without purified GFP-NuMA1 mutant protein was tested by in vitro binding assay. h We performed FRET analyses between TBC1D15-CFP and NuMA1-YFP. (left upper panel) Cartoon depicting binding partners TBC1D15 and NuMA1 tagged with fluorescent proteins CFP and YFP. (left bottom panel) Living CD133+ cells transfected with the controls CFP only, YFP only, CFP and YFP as well as the CFP–YFP fusion proteins were analyzed on a FACS flow cytometer. (right panel) Representative optical images showed CFP and YFP expression in CD133+ cells with CFP and YFP. CFP is shown in red and YFP in green (Supplementary Fig. 10). i Hypothetical model of TBC1D15-mediated disruption of the interaction between NuMA and LGN that inhibits asymmetric cell division and promotes symmetric cell division. Source data are provided as a Source Data file.
Fig. 3
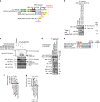
Fig. 3. TBC1D15–NOTCH1 interaction promotes self-renewal and oncogenesis.
a Late stage HCC patients exhibit higher NOTCH1 and TBC1D15 combined expression (TCGA): Each circle represents the expression of a single sample (p < 0.0001). b Explant liver tissues from alcoholic cirrhosis/hepatitis patients (immunoblots). c Hypothetical model. d Co-IP-Western blot analyses confirmed the interaction of TBC1D15 with full-length NOTCH1/2/3/4. e Immunoblot analyses performed expression of NOCH1 and N1ICD in TICs and primary hepatocytes. f CD133+ Huh7 cells express a higher level of N1ICD compared to CD133− cells (immunoblot). g TBC1D15 overexpression elevated N1ICD in PH5CH cells (immunoblot). h Colony formation (left) and expression of Nanog mRNA (right) in TBC1D15, sh-Scramble, and sh-NOTCH expressing PIL4 cells. Colony numbers were calculated as mean ± SD (n = 3). [left; *p = 0.00145 (TBC1D15 vs sh-NOTCH); **p = 0.0056 (Vector vs TBC1D15); **p = 0.01668 (sh-Scramble vs sh-NOTCH); Student’s t test]. p-Values by two-tailed paired t test. [right; *p = 0.004988 (TBC1D15 vs sh-NOTCH); **p = 0.002575 (Vector vs TBC1D15); **p = 0.02014 (sh-Scramble vs sh-NOTCH); Student’s t test]. i TBC1D15 KD abrogated the activity of HEY1 promoter-luciferase in Huh7 cells. Data are represented as ±SD (n = 4). p-Values by two-tailed paired t test. *p = 0.00953 (shTBC1D15 vs sh-Scramble; Hey1); *p = 0.018604 (sh-TBC1D15 vs sh-Scramble; Δ215); Student’s t test. j CSL-mediated Nanog activation. k Six mutant-luciferase constructs. Data are represented as ±SD (n = 3). p-Values by two-tailed paired t test. *p = 0.008879 (WT vs M1); *p = 0.000117 (WT vs M2); *p = 0.000262 (WT vs M3) (Student’s t test). l TBC1D15 or NOTCH1 expression promotes hepatoblast proliferation. Data are represented as ±SD (n = 4). p-Values by two-tailed paired t test. *p = 0.0001149 (Vector vs TBC1D15); **p = 0.00001853 (Vector vs NOTCH1; Student’s t test). mTBC1D15 KD reduced N1ICD but increased NOTCH1 in Huh7 cells. m CD133+ Huh7 cell lysates were analyzed for immunoblots in the presence of shRNA targeting TBC1D15 or scrambled shRNA. TBC1D15 KD reduced N1ICD but increased NOTCH1 in Huh7 cells. n Tumor growth after TIC transplantation in NSGTM mice is suppressed by TBC1D15 KD. Error bars represent ±SEM. o Tumor volume determined 2 months after transplantation of TICs into NSGTM mice. Error bars represent ±SEM (n = 4). p-Values by two-tailed unpaired t test. *p = 0.00000233 (NICD vs shTBC1D15); **p = 0.0000181 (sh-Scramble vs NIICD) (Student’s t test). p TBC1D15 KD reduced NOTCH1 stability. NOTCH1 protein was immunoprecipitated and detected by immunoblotting (left). The NOTCH1 autoradiographic reading (right). Source data are provided as a Source Data file.
Fig. 4
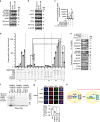
Fig. 4. NOTCH1 C-terminal PEST domain interacts with N-terminus of TBC1D15 for cooperative oncogenic activity.
a Scheme representation of NOTCH-1 deletion mutants were generated. Co-IP-Western blot analysis identified a region between aa 2171 and aa 2473 of the PEST domain as the interaction site. b Co-IP-Western blot analysis identified interaction domains of TBC1D15 interacted with intact N1ICD-HA and N1ICDΔPEST (aa 1754–2473). c The N-terminus but not C-terminus of TBC1D15 interacts with NOTCH-1. A similar domain mapping of TBC1D15 for its interaction with NOTCH-1 revealed aa 1–200 N-terminal fragment with known lysine residues for ubiquitination (Myc-HA-TBC1D15-N term) but not the C-terminus (Myc-HA-TBC1D15-C term), interacted with NOTCH-1. Substitution of these lysines with arginine (Myc-HA-TBC1D15-N 2KR) did not affect the binding. d Co-IP/IB showed TBC1D15–NOTCH1 interaction was lost by deletion of the N-terminus interacting domain (ΔN) while the TBC1D15–NUMB interaction was lost by deletion of the CNO domain (ΔCNO). NICD expression was lost when TBC1D15 with ΔN was expressed while p53 was restored when TBC1D15 with ΔCNO was expressed. This underscored the importance of these distinct domains for the two respective functions. e Additional deletion analysis revealed the N-terminal domain spanning aa.163–217 upstream of the NUMB-binding Canoe (CNO) domain (aa.218–270) was responsible for TBC1D15 interaction with NOTCH. f ΔCNO, ΔN, or both domains of TBC1D15 was reduced spheroid formation of PH5CH cells. Spheroid numbers were counted as mean ± SD (n = 4). p-Values by two-tailed unpaired t test. **p = 0.0001544 (Vector vs TBC1D15); *p = 0.0002660 (TBC1D15 vs ΔCNO); *p = 0.00008665 (TBC1D15 vs ΔN); *p = 0.00035214 (ΔCNO vs ΔN) (Student’s t test). g ΔCNO, ΔN, or both domains incrementally contributed to the abrogation of TBC1D15-induced tumor formation (tumor pictures; left/middle and tumor volumes; right) in NSGTM mice. The visible tumors were measured at the indicated days, Error bars represent ±SD (n = 4). p-Values by two-tailed unpaired t test. **p = 0.00001448 (Vector vs TBC1D15); *p = 0.00003475 (TBC1D15 vs ΔCNO); *p = 0.00001831 (TBC1D15 vs ΔN); *p = 0.00009508 (ΔCNO vs ΔN) (Student’s t test). Source data are provided as a Source Data file.
Fig. 5
Fig. 5. TBC1D15 promotes NUMB phosphorylation through RANGAP1-mediated promotion of AURKA–aPKCζ activation.
a TBC1D15 knockdown inhibits NUMB phosphorylation at S265 as demonstrated by immunoblot analysis. b TBC1D15 knockdown or overexpression does not affect kinase protein levels as demonstrated by immunoblot analysis. c TBC1D15 knockdown reduces and TBC1D15 overexpression increases aPKCζ kinase activity demonstrated aby in vitro kinase assays. Data are represented as ±SD (n = 4). p-Values by two-tailed unpaired t test. *p = 0.00027596 (shTBC1D15 vs shScramble), *p = 0.000008157 (shScramble vs TBC1D15 OE) (Student’s t test). d In vitro cell-free NUMB phosphorylation assay. Each bar represents the mean ± SD of four independent experiments. p-Values by two-tailed unpaired t test. *p = 0.000139 (TBC1D15–AURKA–aPKCζ-NUMB vs AURKA–aPKCζ-NUMB), *p = 0.0002468 (TBC1D15–AURKA–aPKCζ-NUMB vs TBC1D15-aPKCζ-NUMB), *p = 0.00000058 (TBC1D15–AURKA–aPKCζ-NUMB vs TBC1D15–AURKA–aPKCζ-NUMB-0.25μg RANGAP1), *p = 0.00008243 (TBC1D15–AURKA–aPKCζ-NUMB vs TBC1D15–AURKA–aPKCζ-NUMB-0.5 μg RANGAP1), *p = 0.0007145 (TBC1D15–AURKA–aPKCζ-NUMB-shScramble vs TBC1D15–AURKA–aPKCζ-NUMB-shRANGAP1) (Student’s t test). e (top) RANGAP1 knockdown abrogated and RANGAP1 overexpression (OE) enhances AURKA interaction with aPKCζ and TBC1D15 in Huh7 cells as determined by co-IP-Western blot analysis. (bottom) Immunoblot of total cell lysate reveals p-NUMB was reduced by RANGAP1 KD and increased by RANGAP1 OE. PAR6. f We tested if serine or threonine residue of NuMA1 is phosphorylated by Aurora-A, and that this phosphorylation is important for association with TBC1D15. Serine or threonine residue of NuMA1 is phosphorylated by Aurora-A. g Phosphorylation of serine or threonine residue of NuMA1 by Aurora-A is important for asymmetric cell division, judged by immunofluorescence staining of α-Tubulin and NuMA1-GFP intensity. Bar graph represents fold enrichment of GFP-NuMA1. Scale bar, 10 μm. Data are represented as ±SD (n = 3). p-Values by two-tailed paired t test. *p = 0.000667 (WT vs T1991A) *p = 0.000936 (WT vs S2047A) (Student’s t test). h Hypothetical model that TBC1D15 expression promotes NUMB phosphorylation via RANGAP1–TBC1D15 interaction enhancing AURKA–aPKCζ interaction and activation. Source data are provided as a Source Data file.
Fig. 6
Fig. 6. Targeted expression of a non-phosphorylatable mutant of NUMB reduces HCC development induced by alcohol-HCV synergism mouse model.
a Non-phosphorylatable mutant of NUMB (named as NUMB-3A) was generated by serine-to-alanine substitutions of three NUMB phosphorylation sites. b The experimental strategy of tamoxifen-inducible Cre-mediated NUMB-3A expression using Alb::CreERT2; NUMB3ALSL;NS5A mice. c Incidence of liver tumor (upper left panel), ratio of tumor mass/liver weight (%) (upper middle panel) and liver tumor pictures (upper panel, right) of the four groups of mice was decreased in Alb::CreERT2; NUMB3ALSL;NS5A mice with Ethanol WD. The visible tumors were measured at the indicated days. Error bars represent ±SEM (n = 3). p Values are shown from a chi-square test *p = 0.0003773 (chi-square test). H&E staining for mouse tumors (bottom left panel). Immunofluorescence staining of Vimentin and AFP in tumor tissues (bottom right panel). Scale bar, 30.32 μm. The representative pictures are shown from three independent experiments. d (top) The percentage of CD133+ TICs in tumor cells is compared among the four different genotypes of mice. (bottom) Tumor volume kinetics of TIC-derived tumors. The percentage of TICs of tumor cells were calculated as mean ± SD (n = 3). p-Values by two-tailed paired t test. *p = 0.022474 (Student’s t test). e (left) Immunoblots of tumor cell lysates isolated from hepatocyte-specific expression of NUMB-3A mice. (right) Schematic presentations of LPS-activated TLR4 inducing NANOG mediated NUMB phosphorylation for p53 loss and TIC self-renewal, and of NUMB-3A-antagonism of this pathway. f Micro-CT imaging and texture-based VRT were reduced tumor size and tumor volume. The bar graph shows changes in tumor volume before and after the aPKCζ inhibitor. Error bars represent ±SEM. p-Values by two-tailed paired t test. *p = 0.00654 (aPKCζ inhibitor; before vs after treatment), *p = 0.00095 (after treatment; vehicle vs aPKCζ inhibitor) (Student’s t test). g Τhe aPKCζ inhibitor treatment reduced liver tumors spontaneously developed in HCV NS5A Tg mice fed alcohol Western diet as shown by ultrasound sonography. h Immunoblots of tumor cell lysates isolated from NS5A Tg mice fed alcohol WD of the aPKCζ inhibitor vs vehicle. i Summary of oncogenic pathways. NUMB phosphorylation and TBC1D15 are mutually required for liver tumorigenesis. Source data are provided as a Source Data file.

Similar articles

Cited by

References

    1. Silvestri F, et al. The genotype of the hepatitis C virus in patients with HCV-related B cell non-Hodgkin’s lymphoma. Leukemia. 1997;11:2157–2161. doi: 10.1038/sj.leu.2400869. - DOI - PubMed
    1. Reya T, Morrison SJ, Clarke MF, Weissman IL. Stem cells, cancer, and cancer stem cells. Nature. 2001;414:105–111. doi: 10.1038/35102167. - DOI - PubMed
    1. Clevers H. The cancer stem cell: premises, promises and challenges. Nat. Med. 2011;17:313–319. doi: 10.1038/nm.2304. - DOI - PubMed
    1. Simonet WS, Bucay N, Lauer SJ, Taylor JM. A far-downstream hepatocyte-specific control region directs expression of the linked human apolipoprotein E and C-I genes in transgenic mice. J. Biol. Chem. 1993;268:8221–8229. - PubMed
    1. Majumder M, et al. Expression of hepatitis C virus non-structural 5A protein in the liver of transgenic mice. FEBS Lett. 2003;555:528–532. doi: 10.1016/S0014-5793(03)01337-1. - DOI - PubMed

Publication types

MeSH terms