. 2020 Jun 16;10(1):9687.
doi: 10.1038/s41598-020-66510-y.

TRPA1 and TRPV1 channels participate in atmospheric-pressure plasma-induced [Ca2+]i response

Affiliations

TRPA1 and TRPV1 channels participate in atmospheric-pressure plasma-induced [Ca2+]i response

Masayoshi Kawase et al. Sci Rep. .

Abstract

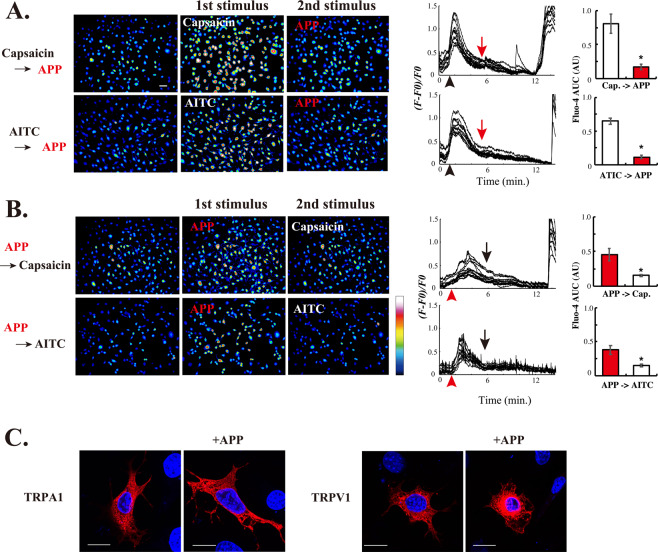
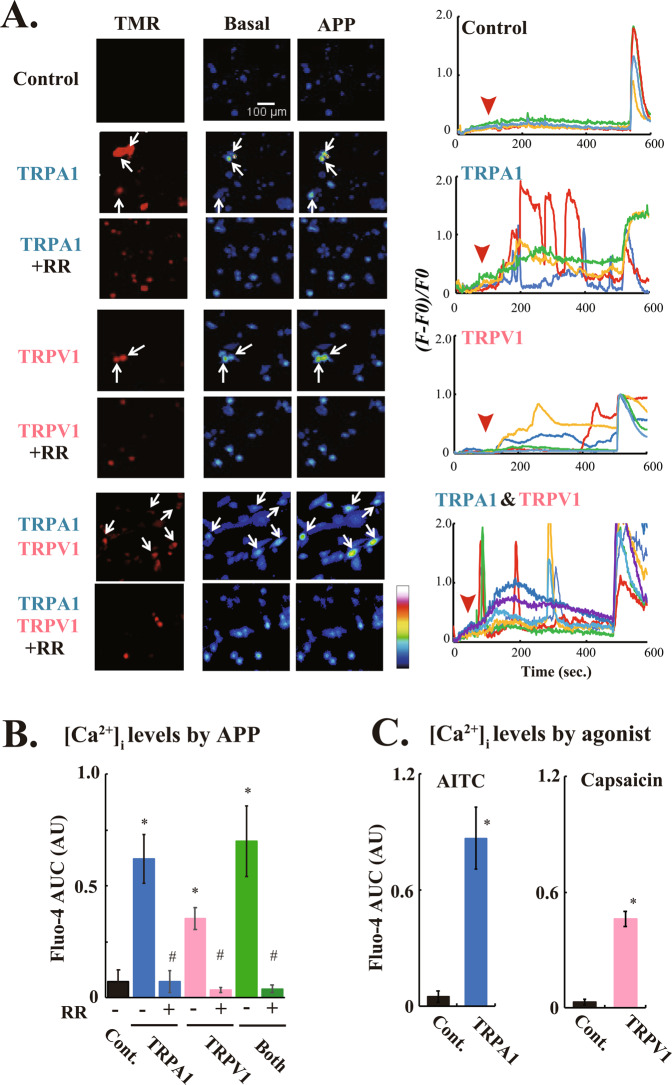
Despite successful clinical application of non-equilibrium atmospheric pressure plasma (APP), the details of the molecular mechanisms underlying APP-inducible biological responses remain ill-defined. We previously reported that exposure of 3T3L1 cells to APP-irradiated buffer raised the cytoplasmic free Ca2+ ([Ca2+]i) concentration by eliciting Ca2+ influx in a manner sensitive to transient receptor potential (TRP) channel inhibitors. However, the precise identity of the APP-responsive channel molecule(s) remains unclear. In the present study, we aimed to clarify channel molecule(s) responsible for indirect APP-responsive [Ca2+]i rises. siRNA-mediated silencing experiments revealed that TRPA1 and TRPV1 serve as the major APP-responsive Ca2+ channels in 3T3L1 cells. Conversely, ectopic expression of either TRPA1 or TRPV1 in APP-unresponsive C2C12 cells actually triggered [Ca2+]i elevation in response to indirect APP exposure. Desensitization experiments using 3T3L1 cells revealed APP responsiveness to be markedly suppressed after pretreatment with allyl isothiocyanate or capsaicin, TRPA1 and TRPV1 agonists, respectively. APP exposure also desensitized the cells to these chemical agonists, indicating the existence of a bi-directional heterologous desensitization property of APP-responsive [Ca2+]i transients mediated through these TRP channels. Mutational analyses of key cysteine residues in TRPA1 (Cys421, Cys621, Cys641, and Cys665) and in TRPV1 (Cys258, Cys363, and Cys742) have suggested that multiple reactive oxygen and nitrogen species are intricately involved in activation of the channels via a broad range of modifications involving these cysteine residues. Taken together, these observations allow us to conclude that both TRPA1 and TRPV1 channels play a pivotal role in evoking indirect APP-dependent [Ca2+]i responses.


Conflict of interest statement

The authors declare no competing interests.

Figures

Figure 1
Figure 1
siRNA-mediated TRPV1 and TRPA1 knockdown abrogated the [Ca2+]i transients induced by APP-HBS in 3T3L1 fibroblasts. (A) Pseudo-color images showing [Ca2+]i elevation at ~2 min. after APP-HBS exposure in 3T3L1 cells pretreated with scramble, TRPV1, TRPA1 or TRPV1 plus TRPA1 siRNAs. The cells were stimulated with APP-irradiated HBS at ~1 min. (allows), followed by treatment with ionomycin. The pseudo-color coding on the right shows Fluo-4 fluorescence intensity. The graphs on the right represent mean changes in [Ca2+]i within all cells in the images shown on the left, which were expressed as (F − F0)/F0 as described in Materials and Methods. The thick colored lines represent the mean values, the shaded region the SE. (B and C) Quantification of the indirect APP-responsive or agonist-induced [Ca2+]i transients obtained from 3–5 independent experiments. For each experiment, more than 50 cells from each glass-bottom dish were measured. (B) The area-under-the-curve (AUC) of the (F − F0)/F0 values from 1 to 6 min are shown. (C) Normalized [Ca2+]i levels of the AUC in siRNA-treated 3T3L1 cells stimulated with AITC or capsaicin are shown. Statistical analysis was performed, versus the control (scramble siRNA), using Dunnett’s multiple comparison and statistical significance is indicated by *(P < 0.05). #Denotes a statistically significant difference (P < 0.05) between the TRPV1 alone and the TRPA1/TRPV1-double knockdown. (D) Quantification of TRPV1 and TRPA1 mRNA expression levels in 3T3L1 fibroblasts pretreated with scramble, TRPV1, TRPA1 or TRPV1 plus TRPA1 siRNAs. Statistical significance was determined by applying the Dunnett’s multiple comparison versus the control. The effects of siRNA-mediated knockdown of TRPV1 (pink), or TRPA1 (blue), or both (green) are indicated by *(P < 0.05).
Figure 2
Figure 2
Heterologous desensitization of the indirect APP-responsive [Ca2+]i transients in 3T3L1 cells. (A) Pseudo-color images showing [Ca2+]i elevation in 3T3L1 cells stimulated sequentially with either capsaicin or AITC as the 1st stimulus and then with APP-exposed HBS as the 2nd stimulus. The graphs on the right are representative single-cell traces of Fluo-4 fluorescence from the images on the left, expressed as (F − F0)/F0. Capsaicin or AITC was applied at approximately 1 min. (black arrowheads), and 2.5 mL of APP-HBS were then applied at ~6 min. (red arrows) by infusion. AUC of the (F − F0)/F0 values of the 1st stimulus (1–5 min.) and the 2nd stimulus (6–10 min.) are also shown. Scale bar = 100 μm. Statistical significance was determined, versus the 1st stimulus, by the Dunnett’s test. These are representative results obtained from three independent experiments. (B) Pseudo-color images showing [Ca2+]i elevation in 3T3L1 cells stimulated sequentially with APP-HBS as the 1st stimulus and then with capsaicin or AITC as the 2nd stimulus. The pseudo-color coding on the right shows Fluo-4 fluorescence intensity. Graphs on the right are representative single-cell traces of Fluo-4 fluorescence from the images on the left, expressed as (F − F0)/F0. APP-HBS was applied at approximately 1 min. (red arrowheads), and then capcaisin (3 μM) or AITC (100 μM) was administrated at ~6 min. (black arrows) by infusion. AUC of the (F − F0)/F0 values of the 1st stimulus (1–5 min.) and the 2nd stimulus (6–10 min.) are also shown. Statistical significance was determined, versus the 1st stimulus, by the Dunnett’s test. The results shown are representative of three independent experiments. (C) Subcellular localization of Halo-TRPA1 and TRPV1-Halo in 3T3L1 fibroblasts exogenously expressing either Halo-TRPA1 or TRPV1-Halo stimulated with or without APP-HBS for 5 min. The images shown are representative of three independent experiments. Scale bar = 20 μm.
Figure 3
Figure 3
Exogeneous expression of either TRPA1 or TRPV1 generates APP-responsiveness in C2C12 cells. (A) Pseudo-color images showing [Ca2+]i elevation in C2C12 cells exogenously expressing either Halo-TRPA1 or TRPV1-Halo, alone or in combination (red cells in the left panels) stimulated with APP-HBS in the absence or presence of 100 μM ruthenium red (RR). The graphs on the right are representative single-cell traces of Fluo-4 fluorescence from the experiments shown on the left (-RR only), expressed as (F − F0)/F0. APP-HBS was applied at approximately 50~100 sec. (red arrowheads), and then ionomycin was added. (B) Quantification of the indirect APP-responsive [Ca2+]i transients in C2C12 myoblasts expressing either TRPA1 (blue bar) or TRPV1 (pink bar), alone or in combination (green bar), with or without 100 μM RR from 3 independent experiments. AUC were evaluated for 300 sec. in total after APP-HBS administration. For each experiment, more than 10 transfected cells (TMR-positive cells) from each glass-bottom dish were measured. Statistical significance was determined by applying the Dunnett’s multiple comparison versus the control (parental C2C12 cells). The effects of exogenous expression of TRPA1 and TRPV1, alone or in combination, are indicated by *(P < 0.05), and the effects of RR are indicated by #(P < 0.05). (C) Quantification of agonist-dependent [Ca2+]i transients in C2C12 myoblasts exogenously expressing either TRPA1 (blue bar) or TRPV1 (pink bar) channels from 3 independent experiments. AUC was evaluated from 100–500 sec., and results are expressed as the fold increase versus the AUC obtained from the parental C2C12 cells. For each experiment, more than 10 transfected cells (TMR-positive cells) from each glass-bottom dish were measured. Data are means ± SE., and statistical significance was determined by applying the Mann-Whitney’s U test. The effects of exogenous expression of TRPA1 or TRPV1 channels are indicated by *(P < 0.05).
Figure 4
Figure 4
Mutational analysis of TRPA1 and TRPV1 channels for the indirect APP-responsive [Ca2+]i transients. (A,B) Quantification of the indirect APP-responsive [Ca2+]i transients as well as the agonist-responsive [Ca2+]i transients (grey bars) in C2C12 myoblasts expressing either TRPA1/its mutants (blue bars) or TRPV1/its mutants (pink bars) from 3 independent experiments. APP-HBS was applied at approximately 100 sec., followed by Fluo-4 monitoring for approximately for 10 min as described in Materials and Methods. AUC was evaluated from 100–500 sec. and the results are expressed as a percentage of the data obtained from C2C12 cells expressing wild-type channels. Transfected cells were identified by TMR-conjugated HaloTag-ligand staining after evaluation of [Ca2+]i responses by Fluo-4 fluorescence. For each experiment, more than 10 transfected cells (TMR-positive cells) from each glass-bottom dish were measured. Statistical significance was determined by applying the Dunnett’s multiple comparison versus the control (WT). The effects of mutations are indicated by *(P < 0.05).

Similar articles

Cited by

References

    1. Yousfi M, Merbahi N, Pathak A, Eichwald O. Low-temperature plasmas at atmospheric pressure: toward new pharmaceutical treatments in medicine. Fundam. Clin. Pharmacol. 2014;28:123–135. doi: 10.1111/fcp.12018. - DOI - PubMed
    1. von Woedtke, T., Schmidt, A., Bekeschus, S., Wende, K. & Weltmann, K. D. Plasma Medicine: A Field of Applied Redox Biology. Vivo33, 1011–1026, 10.21873/invivo.11570 (2019). - PMC - PubMed
    1. Moisan M, et al. Low-temperature sterilization using gas plasmas: a review of the experiments and an analysis of the inactivation mechanisms. Int. J. pharmaceutics. 2001;226:1–21. doi: 10.1016/S0378-5173(01)00752-9. - DOI - PubMed
    1. Kaneko, T., Sasaki, S., Takashima, K. & Kanzaki, M. Gas-liquid interfacial plasmas producing reactive species for cell membrane permeabilization. J. Clin. Biochem. Nutr.60, 3–11, https://doi.org/10.3164/jcbn 16–73 (2017). - PMC - PubMed
    1. Kozai D, Ogawa N, Mori Y. Redox regulation of transient receptor potential channels. Antioxid. Redox Signal. 2014;21:971–986. doi: 10.1089/ars.2013.5616. - DOI - PubMed

Publication types