

Changes in taxonomic and phylogenetic diversity in the Anthropocene
- PMID: 32546087
- PMCID: PMC7329034
- DOI: 10.1098/rspb.2020.0777
Changes in taxonomic and phylogenetic diversity in the Anthropocene
Abstract
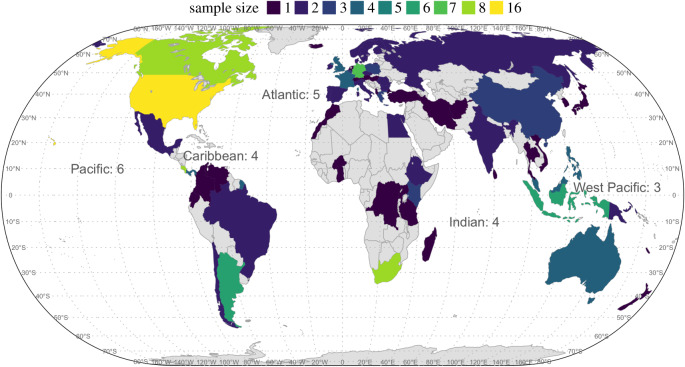
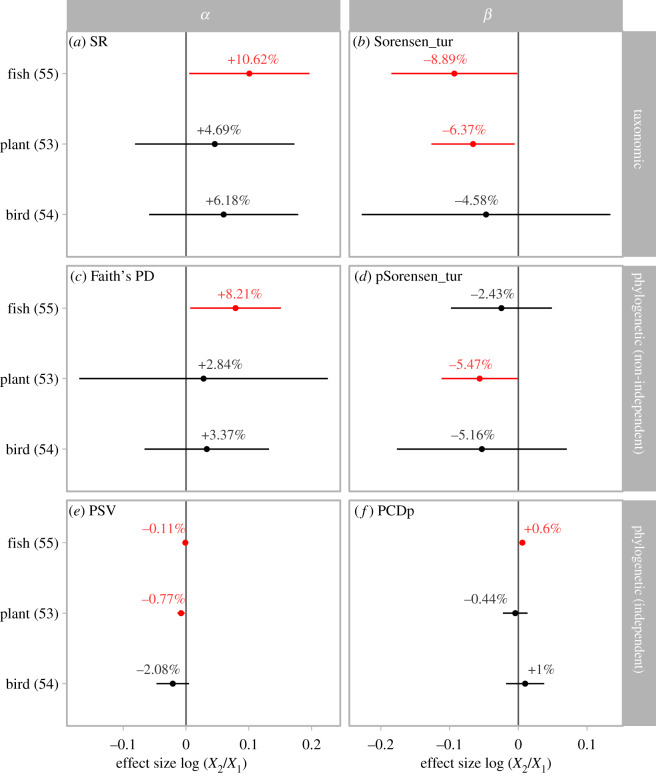
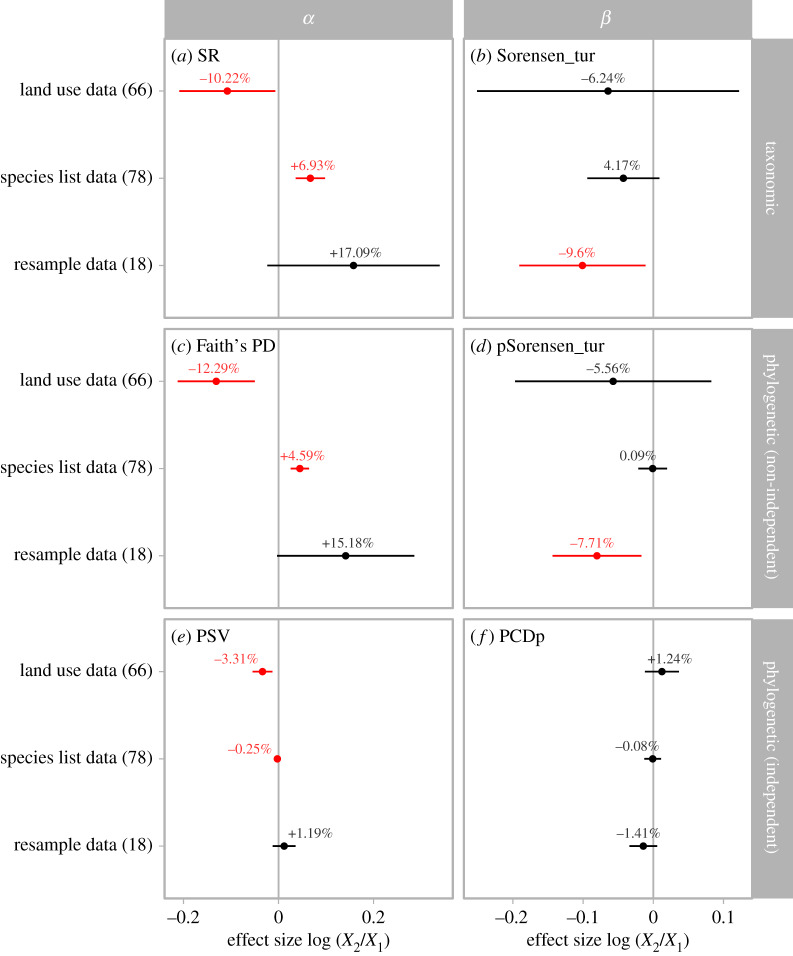
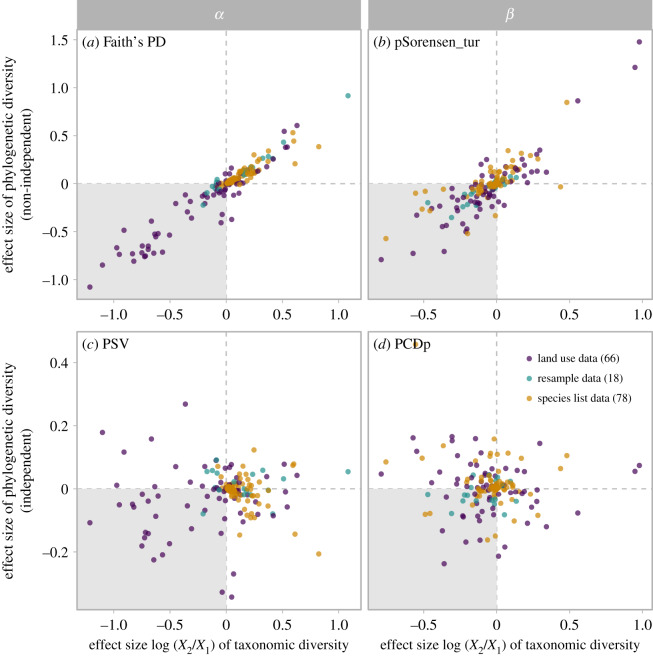
To better understand how ecosystems are changing, a multifaceted approach to measuring biodiversity that considers species richness (SR) and evolutionary history across spatial scales is needed. Here, we compiled 162 datasets for fish, bird and plant assemblages across the globe and measured how taxonomic and phylogenetic diversity changed at different spatial scales (within site α diversity and between sites spatial β diversity). Biodiversity change is measured from these datasets in three ways: across land use gradients, from species lists, and through sampling of the same locations across two time periods. We found that local SR and phylogenetic α diversity (Faith's PD (phylogenetic diversity)) increased for all taxonomic groups. However, when measured with a metric that is independent of SR (phylogenetic species variation, PSV), phylogenetic α diversity declined for all taxonomic groups. Land use datasets showed declines in SR, Faith's PD and PSV. For all taxonomic groups and data types, spatial taxonomic and phylogenetic β diversity decreased when measured with Sorensen dissimilarity and phylogenetic Sorensen dissimilarity, respectively, providing strong evidence of global biotic homogenization. The decoupling of α and β diversity, as well as taxonomic and phylogenetic diversity, highlights the need for a broader perspective on contemporary biodiversity changes. Conservation and environmental policy decisions thus need to consider biodiversity beyond local SR to protect biodiversity and ecosystem services.
Keywords: global change; homogenization; phylogenetic diversity; α diversity; β diversity.
Conflict of interest statement
The authors declare no conflict of interest.
Figures
Similar articles
-
Phylogenetic homogenization of amphibian assemblages in human-altered habitats across the globe.Proc Natl Acad Sci U S A. 2018 Apr 10;115(15):E3454-E3462. doi: 10.1073/pnas.1714891115. Epub 2018 Mar 19. Proc Natl Acad Sci U S A. 2018. PMID: 29555733 Free PMC article.
-
Rarefaction and Extrapolation: Making Fair Comparison of Abundance-Sensitive Phylogenetic Diversity among Multiple Assemblages.Syst Biol. 2017 Jan 1;66(1):100-111. doi: 10.1093/sysbio/syw073. Syst Biol. 2017. PMID: 28173592
-
Multifaceted biodiversity measurements reveal incongruent conservation priorities for rivers in the upper reach and lakes in the middle-lower reach of the largest river-floodplain ecosystem in China.Sci Total Environ. 2020 Oct 15;739:140380. doi: 10.1016/j.scitotenv.2020.140380. Epub 2020 Jun 20. Sci Total Environ. 2020. PMID: 32758978
-
Predicting loss of evolutionary history: Where are we?Biol Rev Camb Philos Soc. 2017 Feb;92(1):271-291. doi: 10.1111/brv.12228. Epub 2015 Oct 14. Biol Rev Camb Philos Soc. 2017. PMID: 26467982 Review.
-
Measuring biodiversity to explain community assembly: a unified approach.Biol Rev Camb Philos Soc. 2011 Nov;86(4):792-812. doi: 10.1111/j.1469-185X.2010.00171.x. Epub 2010 Dec 14. Biol Rev Camb Philos Soc. 2011. PMID: 21155964 Review.
Cited by
-
Climate and Land-Cover Change Impacts and Extinction Risk Assessment of Rare and Threatened Endemic Taxa of Chelmos-Vouraikos National Park (Peloponnese, Greece).Plants (Basel). 2022 Dec 15;11(24):3548. doi: 10.3390/plants11243548. Plants (Basel). 2022. PMID: 36559660 Free PMC article.
-
How effective are ecological metrics in supporting conservation and management in degraded streams?Biodivers Conserv. 2024;33(14):3981-4002. doi: 10.1007/s10531-024-02933-7. Epub 2024 Sep 26. Biodivers Conserv. 2024. PMID: 39559549 Free PMC article.
-
Understanding the relative roles of local environmental, geo-climatic and spatial factors for taxonomic, functional and phylogenetic β-diversity of stream fishes in a large basin, Northeast China.Ecol Evol. 2022 Dec 12;12(12):e9567. doi: 10.1002/ece3.9567. eCollection 2022 Dec. Ecol Evol. 2022. PMID: 36523534 Free PMC article.
-
How does invasion degree shape alpha and beta diversity of freshwater fish at a regional scale?Ecol Evol. 2022 Nov 8;12(11):e9493. doi: 10.1002/ece3.9493. eCollection 2022 Nov. Ecol Evol. 2022. PMID: 36381403 Free PMC article.
-
Plant community assembly is jointly shaped by environmental and dispersal filtering along elevation gradients in a semiarid area, China.Front Plant Sci. 2022 Nov 25;13:1041742. doi: 10.3389/fpls.2022.1041742. eCollection 2022. Front Plant Sci. 2022. PMID: 36507391 Free PMC article.
References
-
- Sax DF, Gaines SD. 2003. Species diversity: from global decreases to local increases. Trends Ecol. Evol. 18, 561–566. (10.1016/S0169-5347(03)00224-6) - DOI
Publication types
MeSH terms
Associated data
LinkOut - more resources
Full Text Sources
Research Materials
