

Mode of action-based risk assessment of genotoxic carcinogens
- PMID: 32542409
- PMCID: PMC7303094
- DOI: 10.1007/s00204-020-02733-2
Mode of action-based risk assessment of genotoxic carcinogens
Erratum in
-
Correction to: Mode of action-based risk assessment of genotoxic carcinogens.Arch Toxicol. 2020 Sep;94(9):3347. doi: 10.1007/s00204-020-02862-8. Arch Toxicol. 2020. PMID: 32696078 Free PMC article.
Abstract
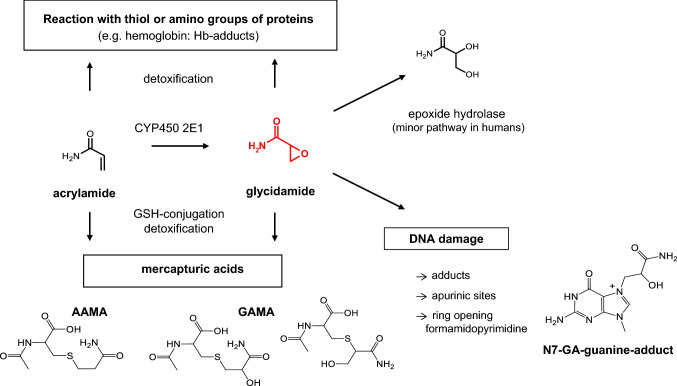
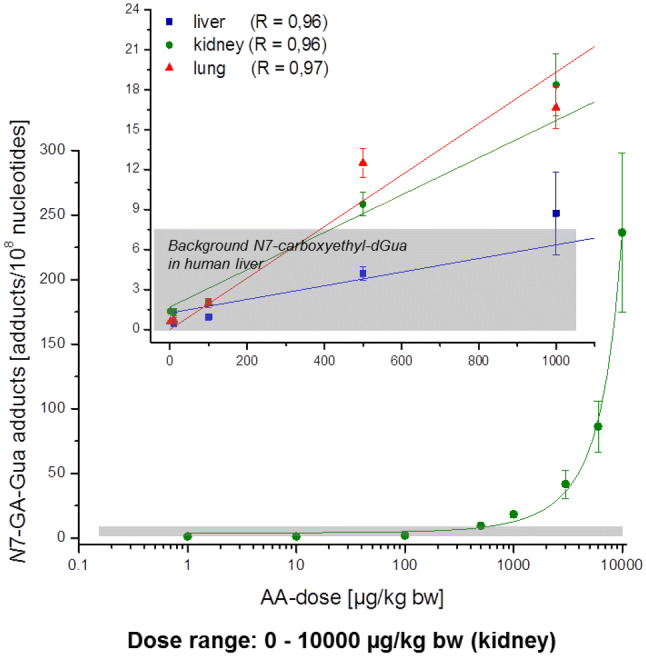
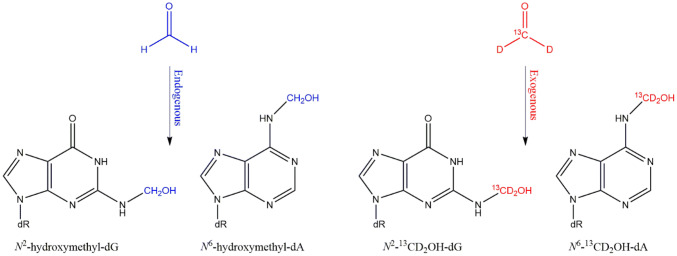
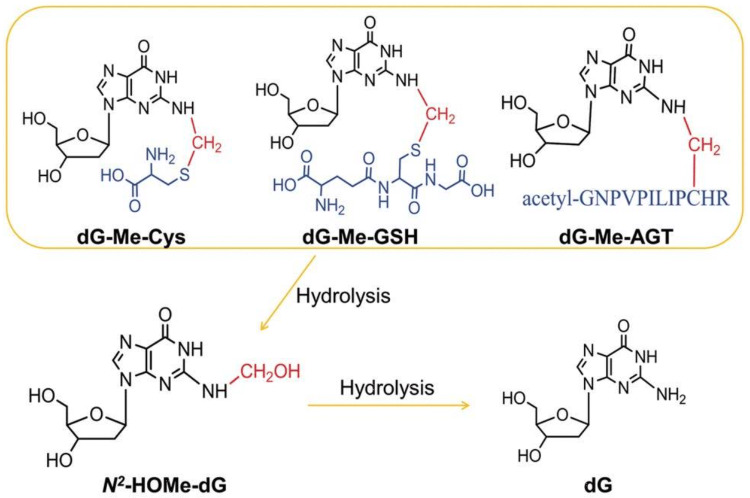
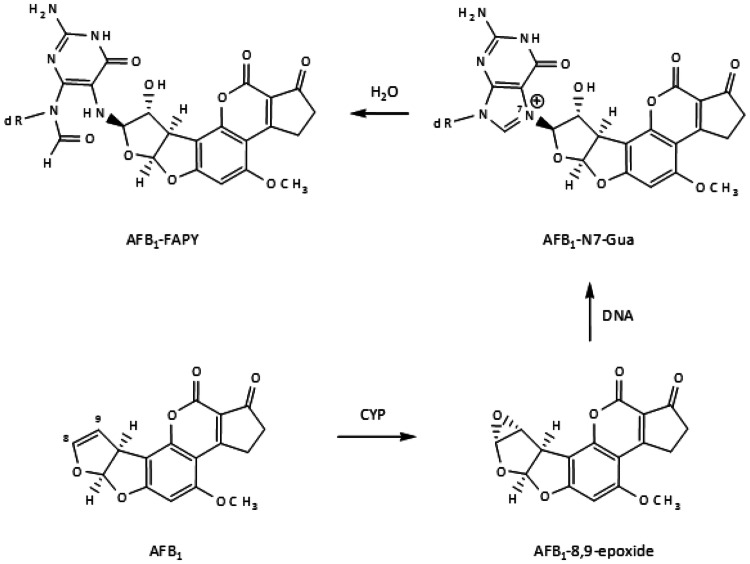
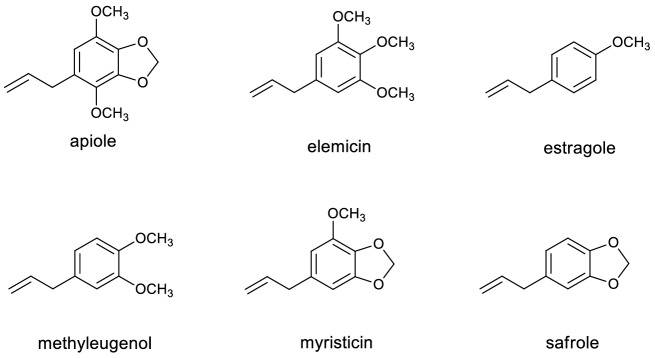
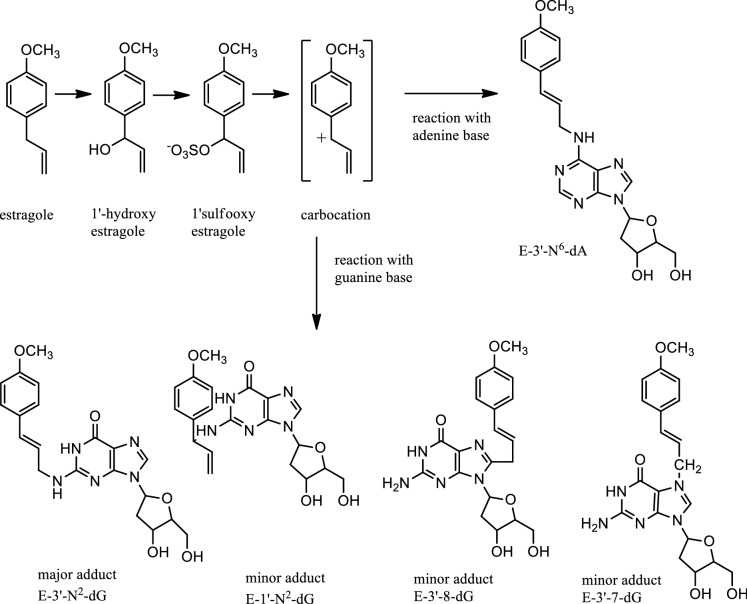
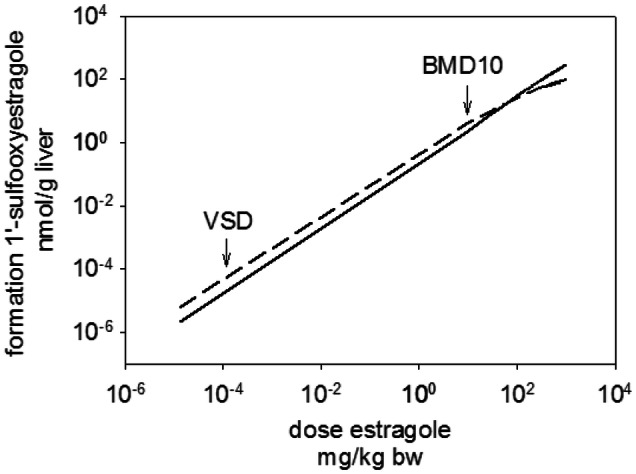
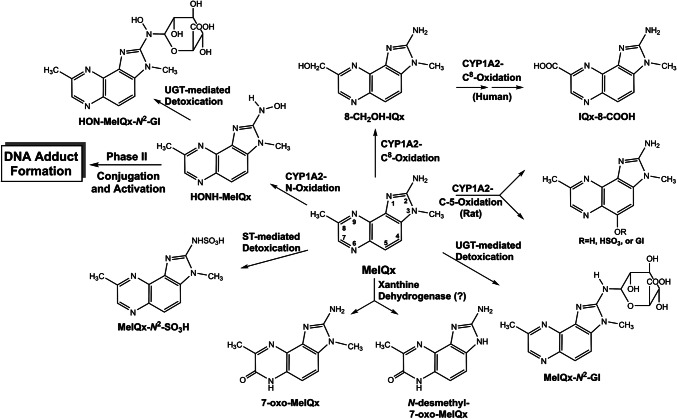
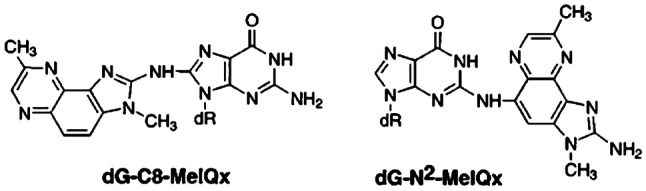
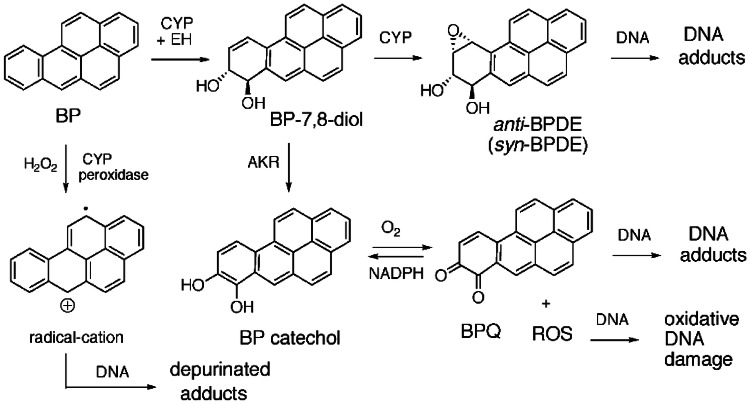
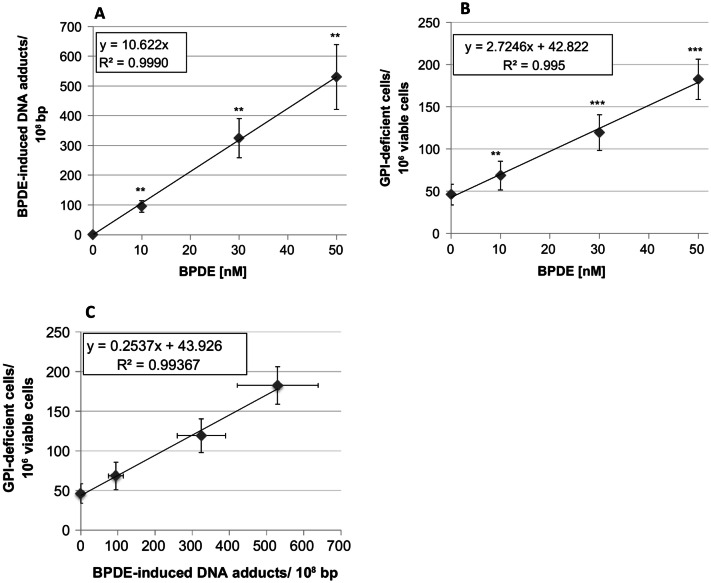
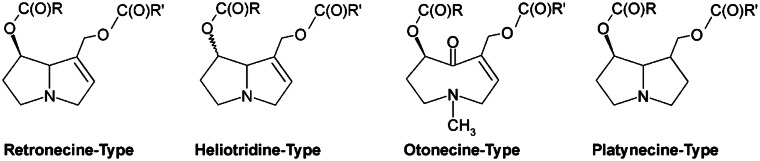
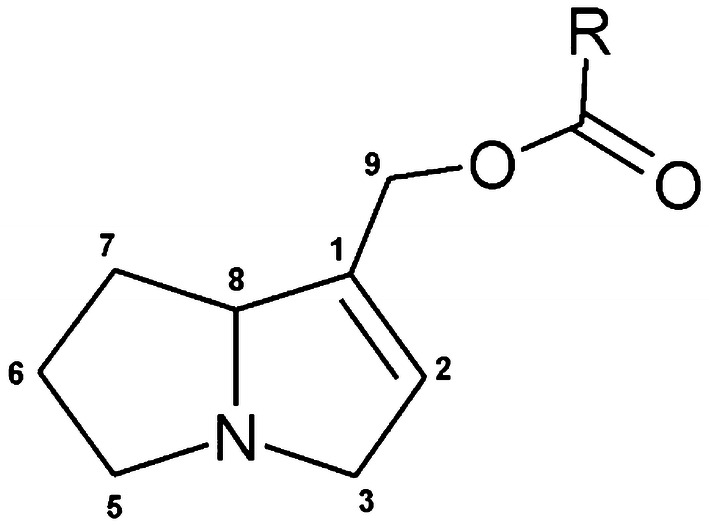
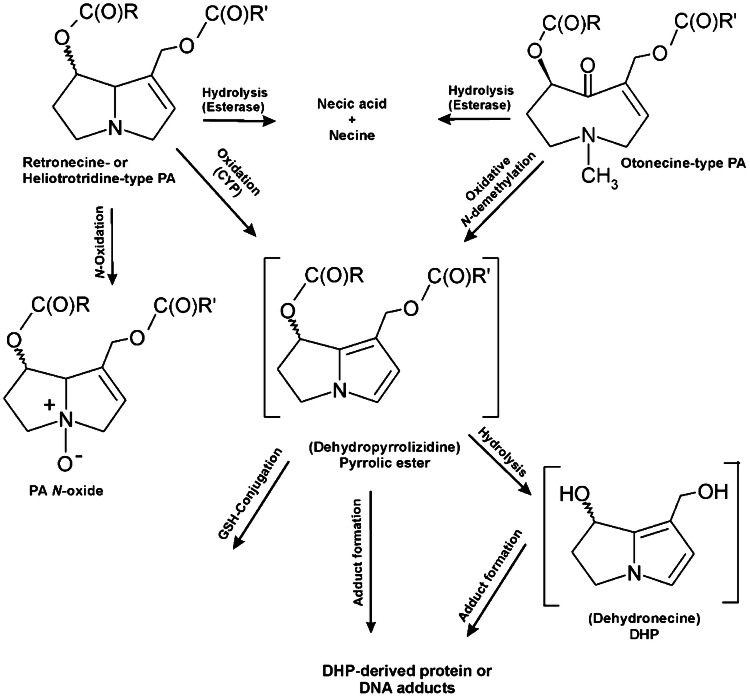
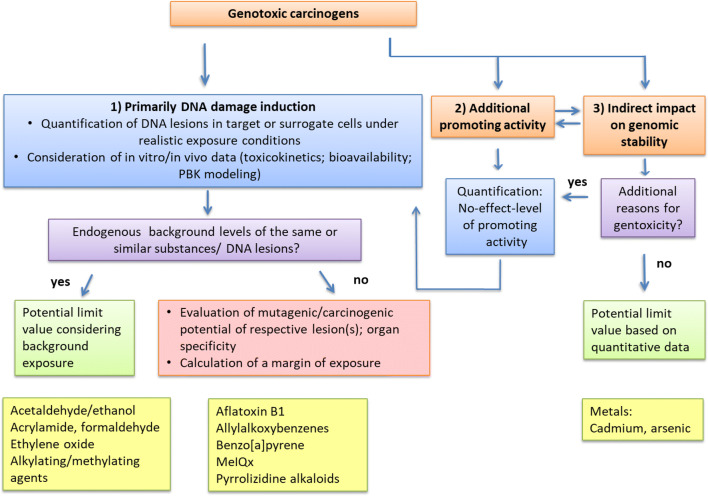
The risk assessment of chemical carcinogens is one major task in toxicology. Even though exposure has been mitigated effectively during the last decades, low levels of carcinogenic substances in food and at the workplace are still present and often not completely avoidable. The distinction between genotoxic and non-genotoxic carcinogens has traditionally been regarded as particularly relevant for risk assessment, with the assumption of the existence of no-effect concentrations (threshold levels) in case of the latter group. In contrast, genotoxic carcinogens, their metabolic precursors and DNA reactive metabolites are considered to represent risk factors at all concentrations since even one or a few DNA lesions may in principle result in mutations and, thus, increase tumour risk. Within the current document, an updated risk evaluation for genotoxic carcinogens is proposed, based on mechanistic knowledge regarding the substance (group) under investigation, and taking into account recent improvements in analytical techniques used to quantify DNA lesions and mutations as well as "omics" approaches. Furthermore, wherever possible and appropriate, special attention is given to the integration of background levels of the same or comparable DNA lesions. Within part A, fundamental considerations highlight the terms hazard and risk with respect to DNA reactivity of genotoxic agents, as compared to non-genotoxic agents. Also, current methodologies used in genetic toxicology as well as in dosimetry of exposure are described. Special focus is given on the elucidation of modes of action (MOA) and on the relation between DNA damage and cancer risk. Part B addresses specific examples of genotoxic carcinogens, including those humans are exposed to exogenously and endogenously, such as formaldehyde, acetaldehyde and the corresponding alcohols as well as some alkylating agents, ethylene oxide, and acrylamide, but also examples resulting from exogenous sources like aflatoxin B1, allylalkoxybenzenes, 2-amino-3,8-dimethylimidazo[4,5-f] quinoxaline (MeIQx), benzo[a]pyrene and pyrrolizidine alkaloids. Additionally, special attention is given to some carcinogenic metal compounds, which are considered indirect genotoxins, by accelerating mutagenicity via interactions with the cellular response to DNA damage even at low exposure conditions. Part C finally encompasses conclusions and perspectives, suggesting a refined strategy for the assessment of the carcinogenic risk associated with an exposure to genotoxic compounds and addressing research needs.
Keywords: Biomarker dosimetry; Carcinogens; Endogenous exposure; Exogenous exposure; Genotoxicity; Mode of action; Mutagens; Risk assessment; Toxicogenomics.
Conflict of interest statement
The authors declare that they have no conflict of interest.
Figures
Comment in
-
Unique human cancer model for acetaldehyde based on Mendelian randomization.Arch Toxicol. 2020 Aug;94(8):2887-2888. doi: 10.1007/s00204-020-02851-x. Epub 2020 Jul 17. Arch Toxicol. 2020. PMID: 32681186 No abstract available.
Similar articles
-
Carcinogenicity categorization of chemicals-new aspects to be considered in a European perspective.Toxicol Lett. 2004 Jun 15;151(1):29-41. doi: 10.1016/j.toxlet.2004.04.004. Toxicol Lett. 2004. PMID: 15177638 Review.
-
An integrative test strategy for cancer hazard identification.Crit Rev Toxicol. 2016 Aug;46(7):615-39. doi: 10.3109/10408444.2016.1171294. Epub 2016 May 3. Crit Rev Toxicol. 2016. PMID: 27142259
-
Approaches to the risk assessment of genotoxic carcinogens in food: a critical appraisal.Food Chem Toxicol. 2006 Oct;44(10):1613-35. doi: 10.1016/j.fct.2006.07.004. Epub 2006 Jul 14. Food Chem Toxicol. 2006. PMID: 16887251 Review.
-
Guidelines for the evaluation of chemicals for carcinogenicity. Committee on Carcinogenicity of Chemicals in Food, Consumer Products and the Environment.Rep Health Soc Subj (Lond). 1991;42:1-80. Rep Health Soc Subj (Lond). 1991. PMID: 1763238
-
Qualitative and quantitative approaches in the dose-response assessment of genotoxic carcinogens.Mutagenesis. 2016 May;31(3):341-6. doi: 10.1093/mutage/gev049. Epub 2015 Jul 7. Mutagenesis. 2016. PMID: 26152227 Review.
Cited by
-
ATX-LPA-Dependent Nuclear Translocation of Endonuclease G in Respiratory Epithelial Cells: A New Mode Action for DNA Damage Induced by Crystalline Silica Particles.Cancers (Basel). 2023 Jan 30;15(3):865. doi: 10.3390/cancers15030865. Cancers (Basel). 2023. PMID: 36765823 Free PMC article.
-
A Toxic Friend: Genotoxic and Mutagenic Activity of the Probiotic Strain Escherichia coli Nissle 1917.mSphere. 2021 Aug 25;6(4):e0062421. doi: 10.1128/mSphere.00624-21. Epub 2021 Aug 11. mSphere. 2021. PMID: 34378987 Free PMC article.
-
The State of the Art and Challenges of In Vitro Methods for Human Hazard Assessment of Nanomaterials in the Context of Safe-by-Design.Nanomaterials (Basel). 2023 Jan 24;13(3):472. doi: 10.3390/nano13030472. Nanomaterials (Basel). 2023. PMID: 36770432 Free PMC article. Review.
-
Current and Future Methodology for Quantitation and Site-Specific Mapping the Location of DNA Adducts.Toxics. 2022 Jan 19;10(2):45. doi: 10.3390/toxics10020045. Toxics. 2022. PMID: 35202232 Free PMC article.
-
Comparative Analysis of Transcriptional Responses to Genotoxic and Non-Genotoxic Agents in the Blood Cell Model TK6 and the Liver Model HepaRG.Int J Mol Sci. 2022 Mar 22;23(7):3420. doi: 10.3390/ijms23073420. Int J Mol Sci. 2022. PMID: 35408779 Free PMC article.
References
-
- AGS Federal ministry of labour and social affairs, committee on hazardous substances technical rules for hazardous substances (TRGS 910), risk-related concept of measures for activities involving carcinogenic hazardous substances. Joint Minist Gazette (GMBl) 2014;74:1545.
-
- Al-Subeihi AA, Spenkelink B, Punt A, Boersma MG, van Bladeren PJ, Rietjens IM. Physiologically based kinetic modeling of bioactivation and detoxification of the alkenylbenzene methyleugenol in human as compared with rat. Toxicol Appl Pharmacol. 2012;260(3):271–284. doi: 10.1016/j.taap.2012.03.005. - DOI - PubMed
Publication types
MeSH terms
Substances
LinkOut - more resources
Full Text Sources
