. 2020 Jun 15;10(1):9653.
doi: 10.1038/s41598-020-66377-z.

Human ZKSCAN3 and Drosophila M1BP are functionally homologous transcription factors in autophagy regulation

Affiliations

Human ZKSCAN3 and Drosophila M1BP are functionally homologous transcription factors in autophagy regulation

Marine Barthez et al. Sci Rep. .

Abstract

Autophagy is an essential cellular process that maintains homeostasis by recycling damaged organelles and nutrients during development and cellular stress. ZKSCAN3 is the sole identified master transcriptional repressor of autophagy in human cell lines. How ZKSCAN3 achieves autophagy repression at the mechanistic or organismal level however still remains to be elucidated. Furthermore, Zkscan3 knockout mice display no discernable autophagy-related phenotypes, suggesting that there may be substantial differences in the regulation of autophagy between normal tissues and tumor cell lines. Here, we demonstrate that vertebrate ZKSCAN3 and Drosophila M1BP are functionally homologous transcription factors in autophagy repression. Expression of ZKSCAN3 in Drosophila prevents premature autophagy onset due to loss of M1BP function and conversely, M1BP expression in human cells can prevent starvation-induced autophagy due to loss of nuclear ZKSCAN3 function. In Drosophila ZKSCAN3 binds genome-wide to sequences targeted by M1BP and transcriptionally regulates the majority of M1BP-controlled genes, demonstrating the evolutionary conservation of the transcriptional repression of autophagy. This study thus allows the potential for transitioning the mechanisms, gene targets and plethora metabolic processes controlled by M1BP onto ZKSCAN3 and opens up Drosophila as a tool in studying the function of ZKSCAN3 in autophagy and tumourigenesis.


Conflict of interest statement

The authors declare no competing interests.

Figures
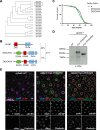
Figure 1
Figure 1
Using Drosophila to study ZKSCAN3 and ZKSCAN4 function in M1BP-controlled processes. (A) Phylogenetic tree analysis of primary sequence structure similarity of the vertebrate family of C2H2 zinc finger family transcription factor members containing a SCAN and KRAB domain demonstrates that ZKSCAN3 and ZKSCAN4 are paralogous family members. (B) The structural domains of Drosophila M1BP and vertebrate ZSKCAN3 and ZKSCAN4 are shown. C2H2 zinc finger domain clusters are depicted in blue, the SCAN domain, which is not conserved in Drosophila is depicted in green and the evolutionarily analogous ZAD and KRAB domains depicted in red. Percent sequence identity by BLAST conservation searches are shown. (C) Drosophila male lifespan was analysed when either ZKSCAN3 or ZKSCAN4 were ubiquitously expressed from the Act5CGal4 driver. No significant change to longevity was observed. (D) ZKSCAN3 and ZKSCAN4 expressed in the Drosophila fat body with the cgGal4 driver results in production of full-length protein as determined by western blot analysis. (E) Expression of ZKSCAN3 and ZKSCAN4 in the Drosophila fat body with the cgGal4 driver results in nuclear localised exogenous protein localisation (green channels) without changing nuclear M1BP staining (red channel). Nuclei were counterstained with DAPI (blue channel) and cell membranes revealed with Phalloidin (white). Scale bar represents 20 µm and contrasts of individual channels are shown.
Figure 2
Figure 2
Expression of ZKSCAN3 in the Drosophila fat body prevents induction of autophagy due to loss of M1BP function. (A) Upon loss of M1BP expression (red) through expression of M1BP RNAi in L3F fat body cells using the fat body-specific cgGal4 driver, autophagy induction is widespread, as seen by the upregulation and cytoplasmic location of the Atg8a autophagy marker (green). Autophagy induction is largely prevented by the co-expression of myc-tagged vertebrate ZKSCAN3 (bottom left) but not by ZKSCAN4 (bottom right). Contrasts of individual channels are shown and scale bar represents 50 µm. G: Gonad (B) Clonal loss, RNAi-expressing cells are GFP-identified and autophagy monitored using mCherry::Atg8a confirming that co-expression of myc-tagged ZKSCAN3 can prevent autophagy induction through M1BP knockdown, whereas ZKSCAN4 expression does not. Contrasts of individual channels are shown and scale bars represent 20 µm. (C) Western blots of wild type, M1BP RNAi, ZKSCAN3, and M1BP RNAi;ZKSCAN3 expressing whole fat body protein preparations confirm autophagy induction due to M1BP RNAi, through the upregulation of Atg8a expression and the presence of major phosphatidylethanolamine-modified forms of Atg8a (arrowhead), which are largely prevented through ZKSCAN3 co-expression. The blots were reprobed with anti-tubulin antibodies for loading control. Quantification of the ratio of unmodified Atg8a (Atg8a-I) to phosphatidylethanolamine-modified Atg8a (Atg8a-II) is presented below the blots. Note, quantification is of this single unrepeated blot and thus does not incorporate error bars. (D) RT-qPCR analyses confirm significant upregulation of autophagy-related Atg gene expression upon M1BP knockdown through M1BP RNAi in the fat body using the cgGal4 driver. Co-expression of ZKSCAN3 prevents Atg gene overexpression without modifying M1BP knockdown. (E) Transmission electron micrographs of Drosophila fat body cells display widespread autophagy induction upon M1BP RNAi through the presence of numerous autophagosome vesicles (lower panels) which are largely not observed in wild type cells or cells co-expressing ZKSCAN3 with M1BP RNAi (upper panels). Autophagosomes from all stages of maturity from early phagophore onset (green outline), autophagosomes containing large quantities of cellular material (cyan outline) and late-stage autophagosomes/autolysosomes (red outline) can be observed in M1BP RNAi expressing cells. LD: lipid droplets. Scale bars 10 µm in main micrographs and 1 µm in enlarged area (bottom right).
Figure 3
Figure 3
M1BP RNAi leads to widespread gene deregulation that is largely prevented through ZKSCAN3 co-expression. (A) Weighted Venn diagram representation of RNA-seq-identified L3F differentially expressed genes (DEGs) upon M1BP RNAi knockdown and DEGs in M1BP RNAi;ZKSCAN3 co-expressing fat body cells highlighting that more than two-thirds (1026) of M1BP RNAi-induced DEGs are prevented by ZKSCAN3 co-expression. Scatter plot of log2 fold changes in gene expression upon M1BP RNAi (ordinate) and M1BP RNAi;ZKSCAN3 (abscissa) co-expressing L3F fat body cells. Differential gene expression analyses identifying DEGs in both conditions are marked in red, genes prevented from being differentially expressed upon M1BP RNAi through ZKSCAN3 co-expression are shown in green and DEGs present in only M1BP RNAi;ZKSCAN3 fat bodies are shown in orange. Genes not differentially expressed in any condition are in grey. (B) Average transcripts per million (TPM) from biological replicate RNA-seq counts for all autophagy-related genes (Atg) show significant upregulation of numerous Atg genes upon M1BP RNAi that is prevented by ZKSCAN3 co-expression. Error bars represent standard deviation of mean replicate values. (C) Reactome pathway enrichment analysis identified the “Autophagy Reactome” pathway as significantly enriched with 30% of pathway entities being upregulated upon M1BP RNAi and the “Metabolism Reactome” as significantly enriched with 23% of pathway entities being downregulated upon M1BP RNAi. In both cases, the majority of deregulated pathway genes are restored to wild type values upon ZKSCAN3 co-expression leading to the absence of pathway enrichment. The pathway illustrations (CC BY 4.0 license) as provided by the Reactome analyses significantly affected within each of the reactomes are shown in red while not significant pathways are shown in grey.
Figure 4
Figure 4
ZKSCAN3 binds identical M1BP genomic targets in Drosophila S2 cells. (A) Pairwise ChIP peak intersection analyses is shown with of the number of peaks in the “A” peak datasets (vertical dataset identity) overlapping with peaks of the “B” peak dataset (horizontal dataset identity) displayed. (B) Weighted Venn diagram representation of the number of M1BP peaks overlapping with ZKSCAN3, ZKSCAN4 or both ZKSCAN3 and ZKSCAN4 peaks are shown. Since the numbers of peaks change slightly depending on which dataset is used as the source identity (see “A” versus “B” and vice versa in (B) above), only the numbers of peaks not overlapping with any other dataset can be shown for ZKSCAN3 and ZKSCAN4. (C) Normalised ChIP sequencing count reads of M1BP, ZKSCAN3, and ZKSCAN4 ChIP and input genomic DNA within a 3-Kb window around the TSS of the 20 Drosophila Atg genes show that M1BP and ZKSCAN3 arestrongly enriched at the promoters of most Atg genes. (D) Genomic profiling of normalised ChIP reads of data from (C) showing enrichment of M1BP and ZKSCAN3 at the promoters of Atg genes. (E) Genome browser profiles demonstrating that M1BP and ZKSCAN3 target similar autophagy related gene (Atg) promoters in S2 cells.
Figure 5
Figure 5
ZKSCAN3 binds the same Motif 1 DNA motif as M1BP. (A) The most significant DNA sequence motif found by de novo motif discovery analyses on high confidence called peaks (1% irreproducible discovery rate) of M1BP (n = 5279 peaks), ZKSCAN3 (n = 7884 peaks), and ZKSCAN4 (n = 7734 peaks) ChIP-seq profiles shows that Motif 1 DNA element is significantly enriched at ZKSCAN3 and M1BP peaks. (B) Sequence tag densities of M1BP, ZKSCAN3 and ZKSCAN4 ChIP and input DNA centred on Motif1 at M1BP peaks shows that ZKSCAN3, but not ZKSCAN4 preferentially targets Motif 1 DNA sequences in Drosophila. (C) The frequency of Motif 1 position weight matrix occurrences on all M1BP, ZKSCAN3, and ZKSCAN4 ChIP peak summits show that like M1BP, Motif 1 is enriched at ZKSCAN3 ChIP peak summit binding locations. (D) ZKSCAN3 and ZKSCAN4 show little physical interaction with M1BP. M1BP was immunoprecipitated from HA::ZKSCAN3 and HA::ZKSCAN4-expressing Drosophila cell lines and probed for ZKSCAN3 or ZKSCAN4 interaction with anti-HA antisera. The low levels of both ZKSCAN3 and ZKSCAN4 interacting with M1BP (asterisks) cannot explain the ZKSCAN3-specific binding to Motif 1, since both both ZKSCAN3 and ZKSCAN4 were immunoprecipitated at equal amounts.
Figure 6
Figure 6
M1BP expression can prevent starvation-induced autophagy when expressed in vertebrate cells. (A) Representative immunofluorescent staining of unstarved and starved HeLa cells showing increased cytoplasmic staining of LC3A (green) and ZKSCAN3 upon starvation. Scale 25 µm. (B) Quantification of cytoplasmic immunofluorescence signal of LC3A and ZKSCAN3 in unstarved and starved HeLa cells confirming autophagy induction through the shuttling of ZKSCAN3 into the cytoplasm. (C) Representative immunofluorescence staining of LC3A (green) in independent experiments of starved HeLa cells demonstrates that cells containing transiently transfected M1BP (white) display generally lower levels of cytoplasmic LC3A accumulation. Nuclei are counterstained with DAPI (blue) and cell membranes marked with Phalloidin (red). Enlarged views of M1BP-transfected cells showing diminished cytoplasmic LC3A staining are shown below the main images. Scale 50 µm. (D) Quantification of cytoplasmic LC3A immunofluorescence signal in unstarved and starved HeLa cells demonstrates significant reduction of cytoplasmic LC3A in cells transiently transfected with M1BP. (E) RT-qPCR analyses of key vertebrate autophagy genes induced upon HeLa cell starvation demonstrate induction of expression is significantly inhibited in cells transiently transfected with M1BP.

Similar articles

Cited by

References

    1. Devkota S. The autophagy process. Oncotarget. 2017;8:18623. doi: 10.18632/oncotarget.15951. - DOI - PMC - PubMed
    1. Parzych KR, Klionsky DJ. An overview of autophagy: morphology, mechanism, and regulation. Antioxid Redox Signal. 2014;20:460–473. doi: 10.1089/ars.2013.5371. - DOI - PMC - PubMed
    1. Goldsmith J, Levine B, Debnath J. Autophagy and cancer metabolism. Methods Enzymol. 2014;542:25–57. doi: 10.1016/B978-0-12-416618-9.00002-9. - DOI - PMC - PubMed
    1. Hou, X., Watzlawik, J. O., Fiesel, F. C. & Springer, W. Autophagy in Parkinson’s Disease. J. Mol. Biol., 10.1016/j.jmb.2020.01.037 (2020). - PMC - PubMed
    1. Kim J, Lim YM, Lee MS. The Role of Autophagy in Systemic Metabolism and Human-Type Diabetes. Mol Cells. 2018;41:11–17. doi: 10.14348/molcells.2018.2228. - DOI - PMC - PubMed

Publication types