. 2020 Nov;50(11):1729-1745.
doi: 10.1002/eji.201948442. Epub 2020 Jul 6.

Negative control of diacylglycerol kinase ζ-mediated inhibition of T cell receptor signaling by nuclear sequestration in mice

Affiliations

Negative control of diacylglycerol kinase ζ-mediated inhibition of T cell receptor signaling by nuclear sequestration in mice

Danli Xie et al. Eur J Immunol. 2020 Nov.

Abstract

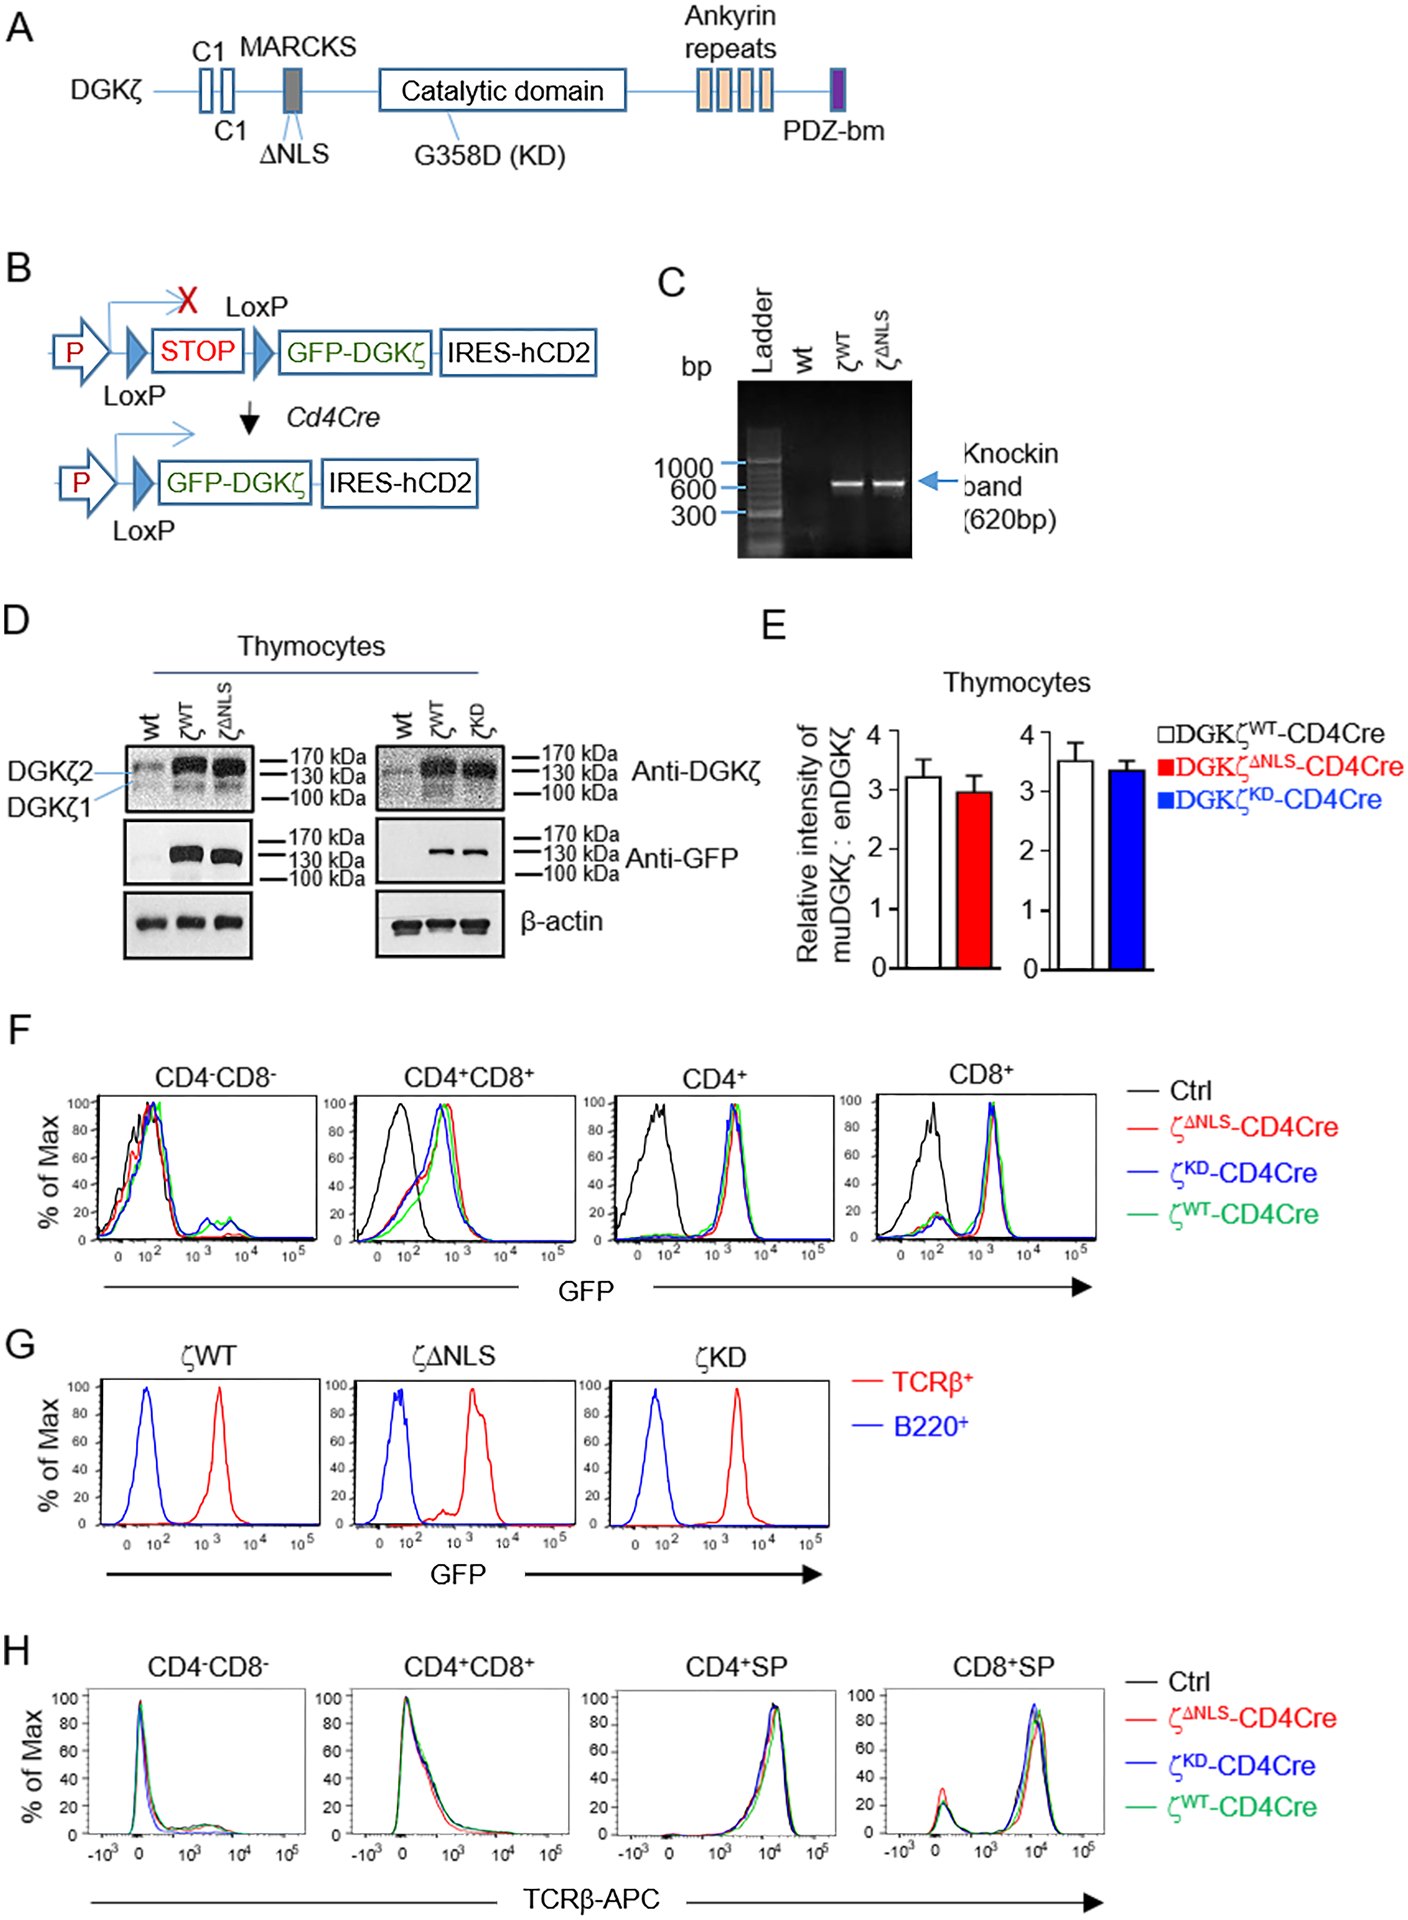
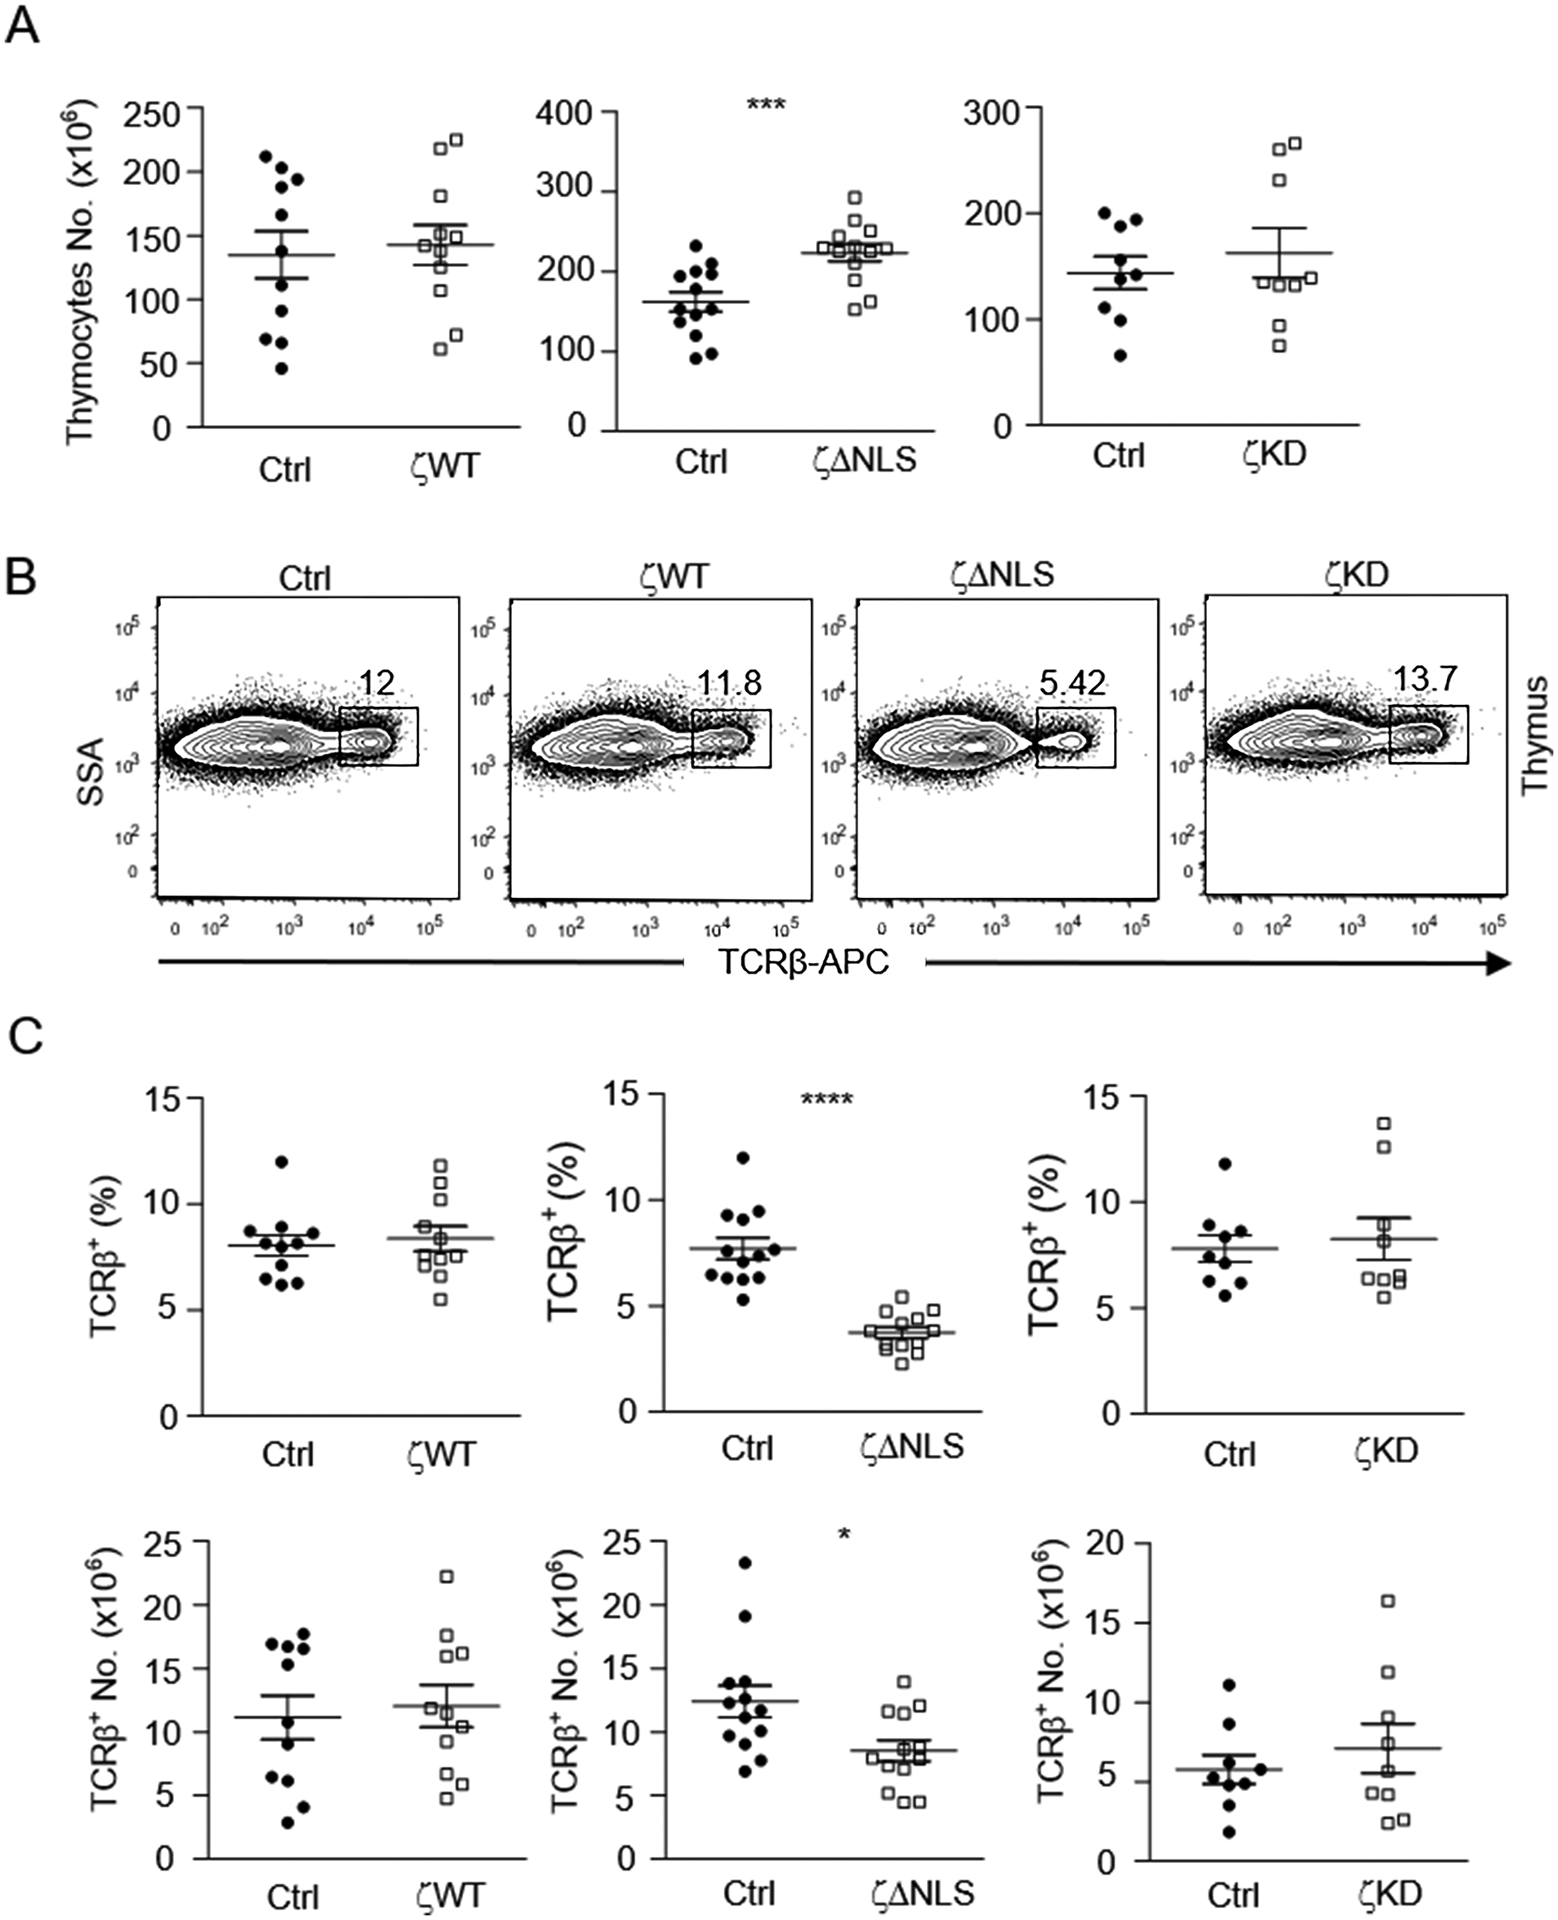
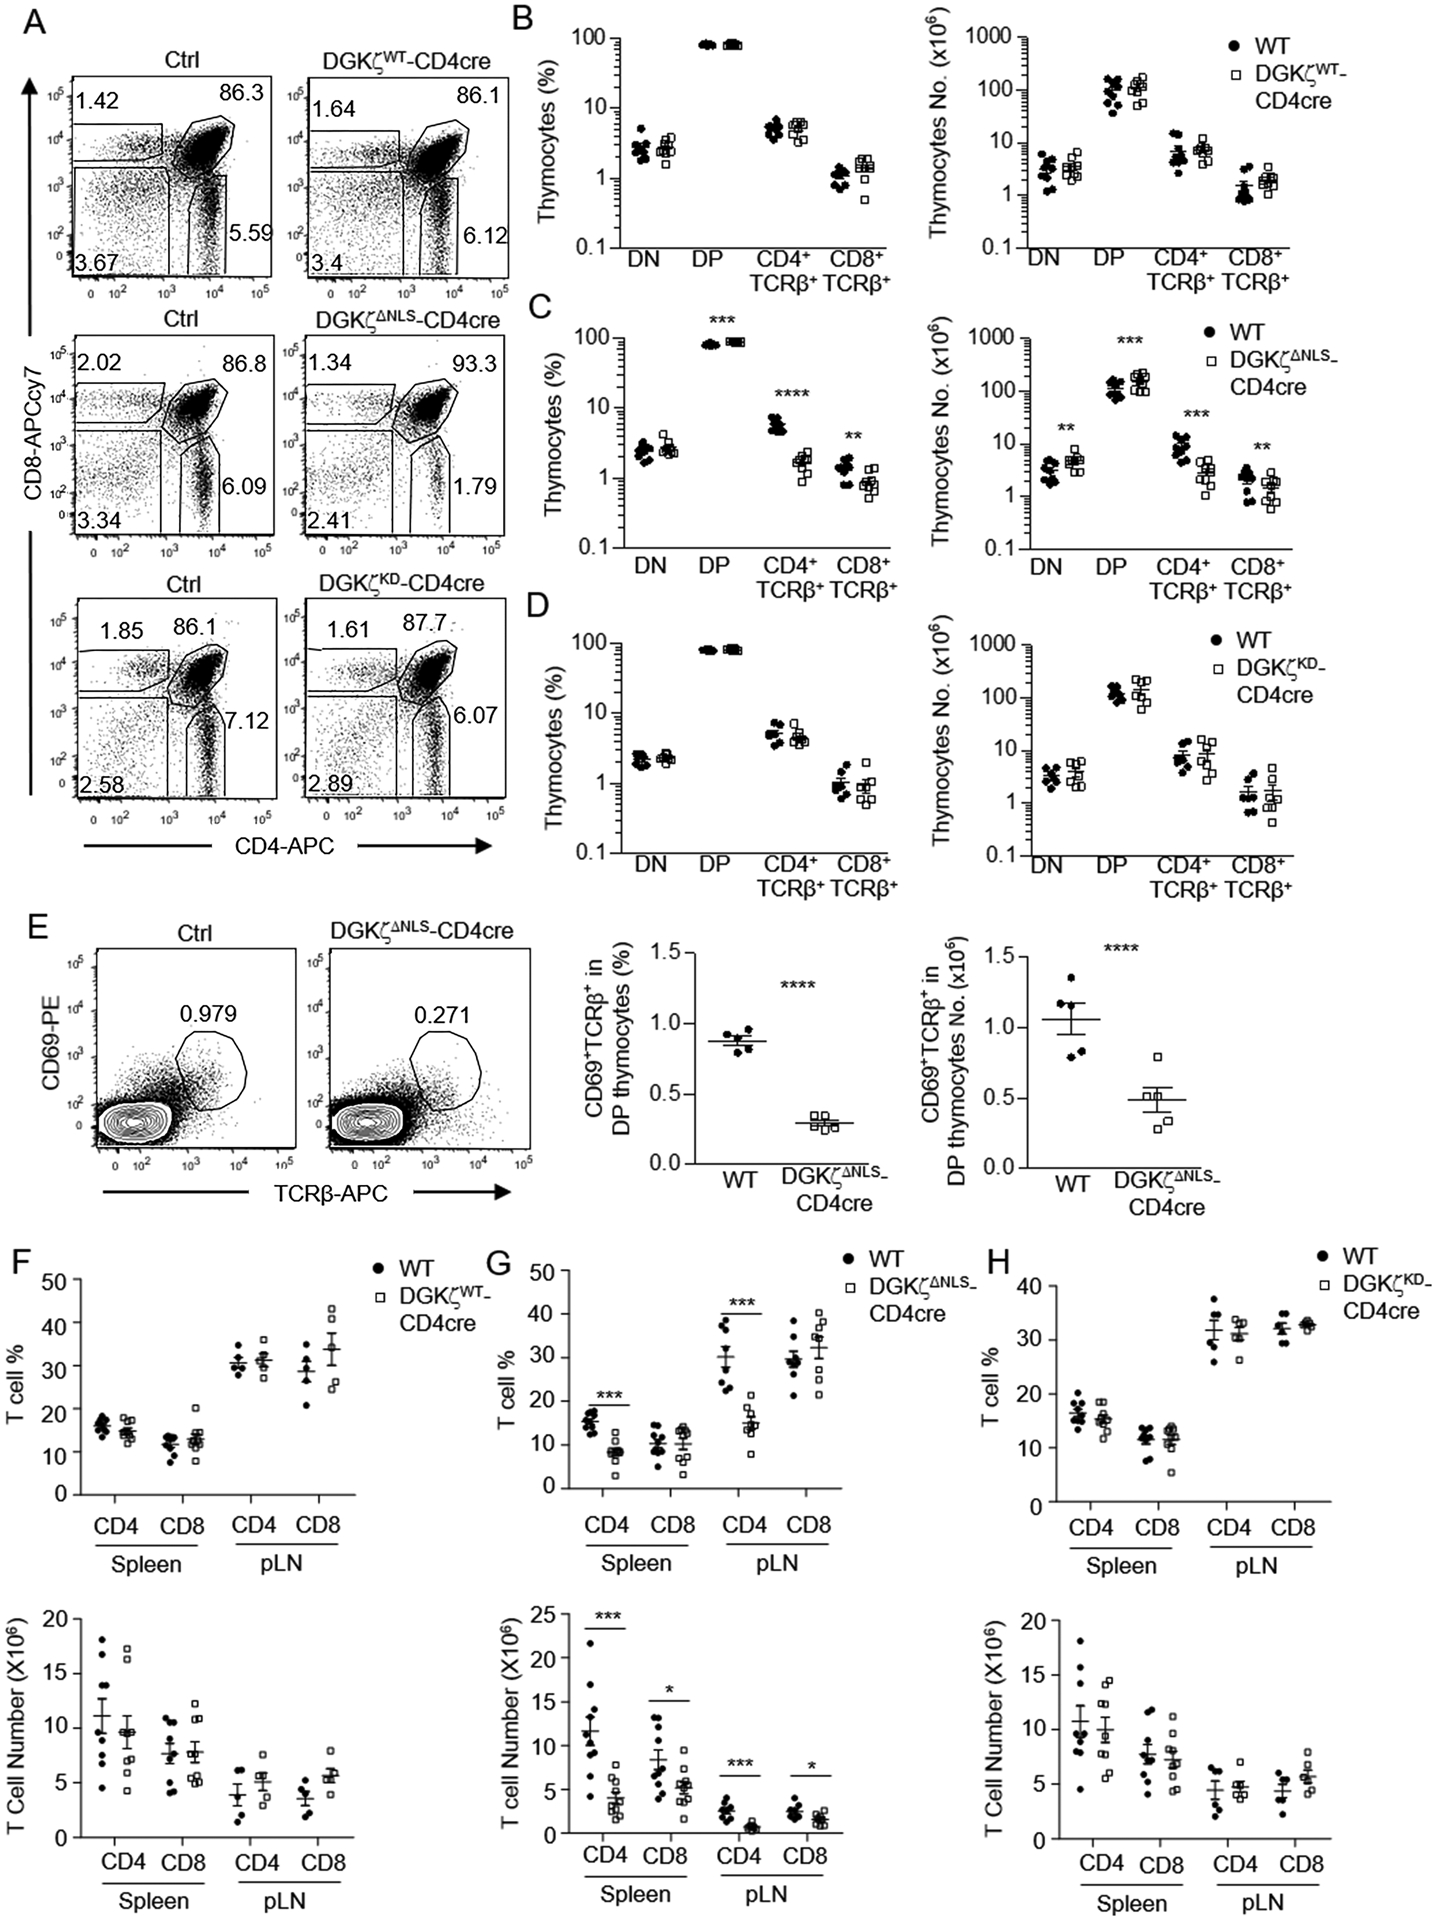
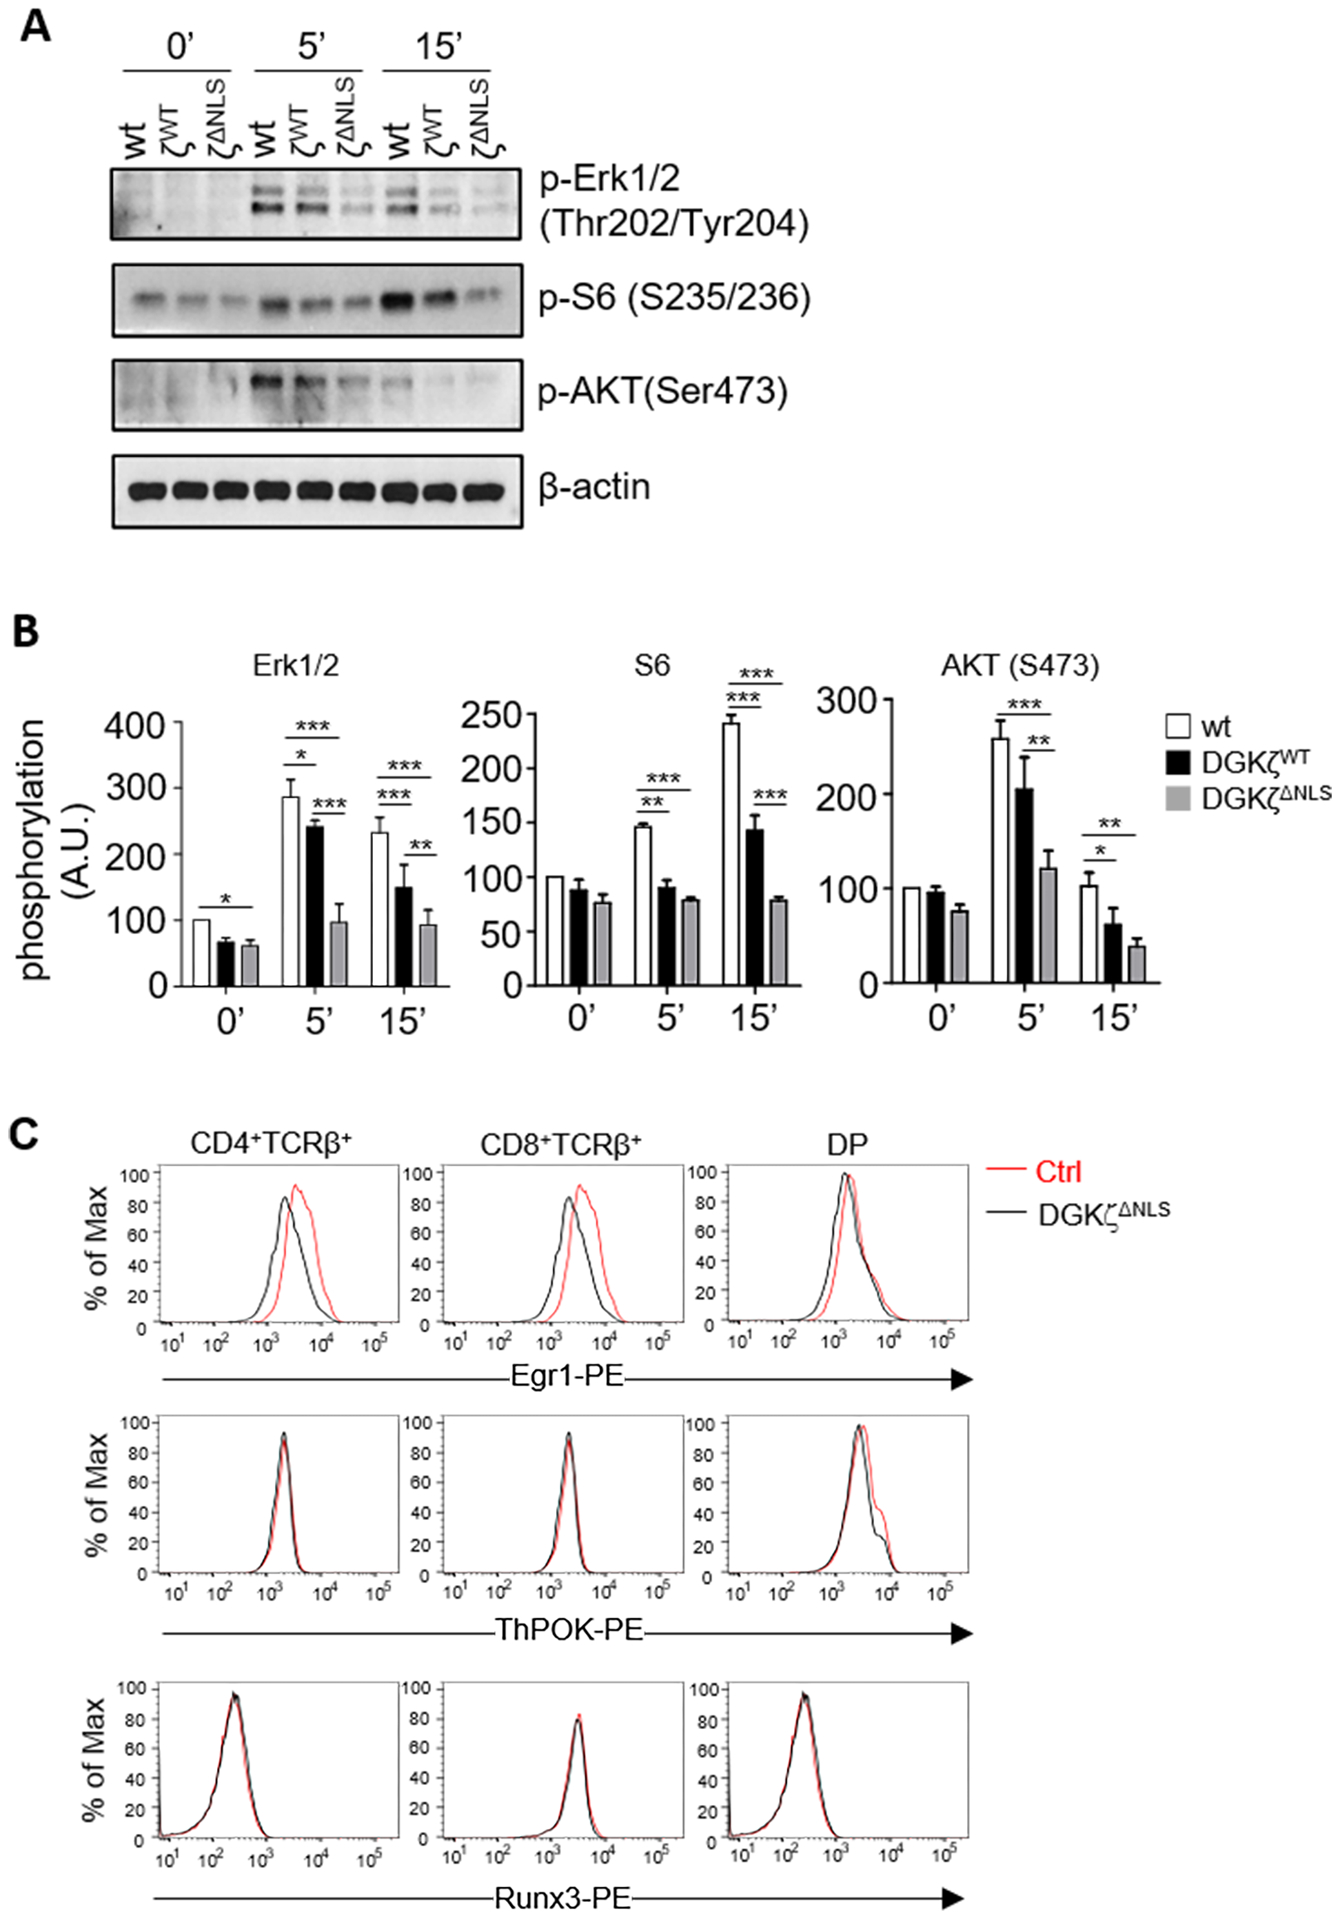
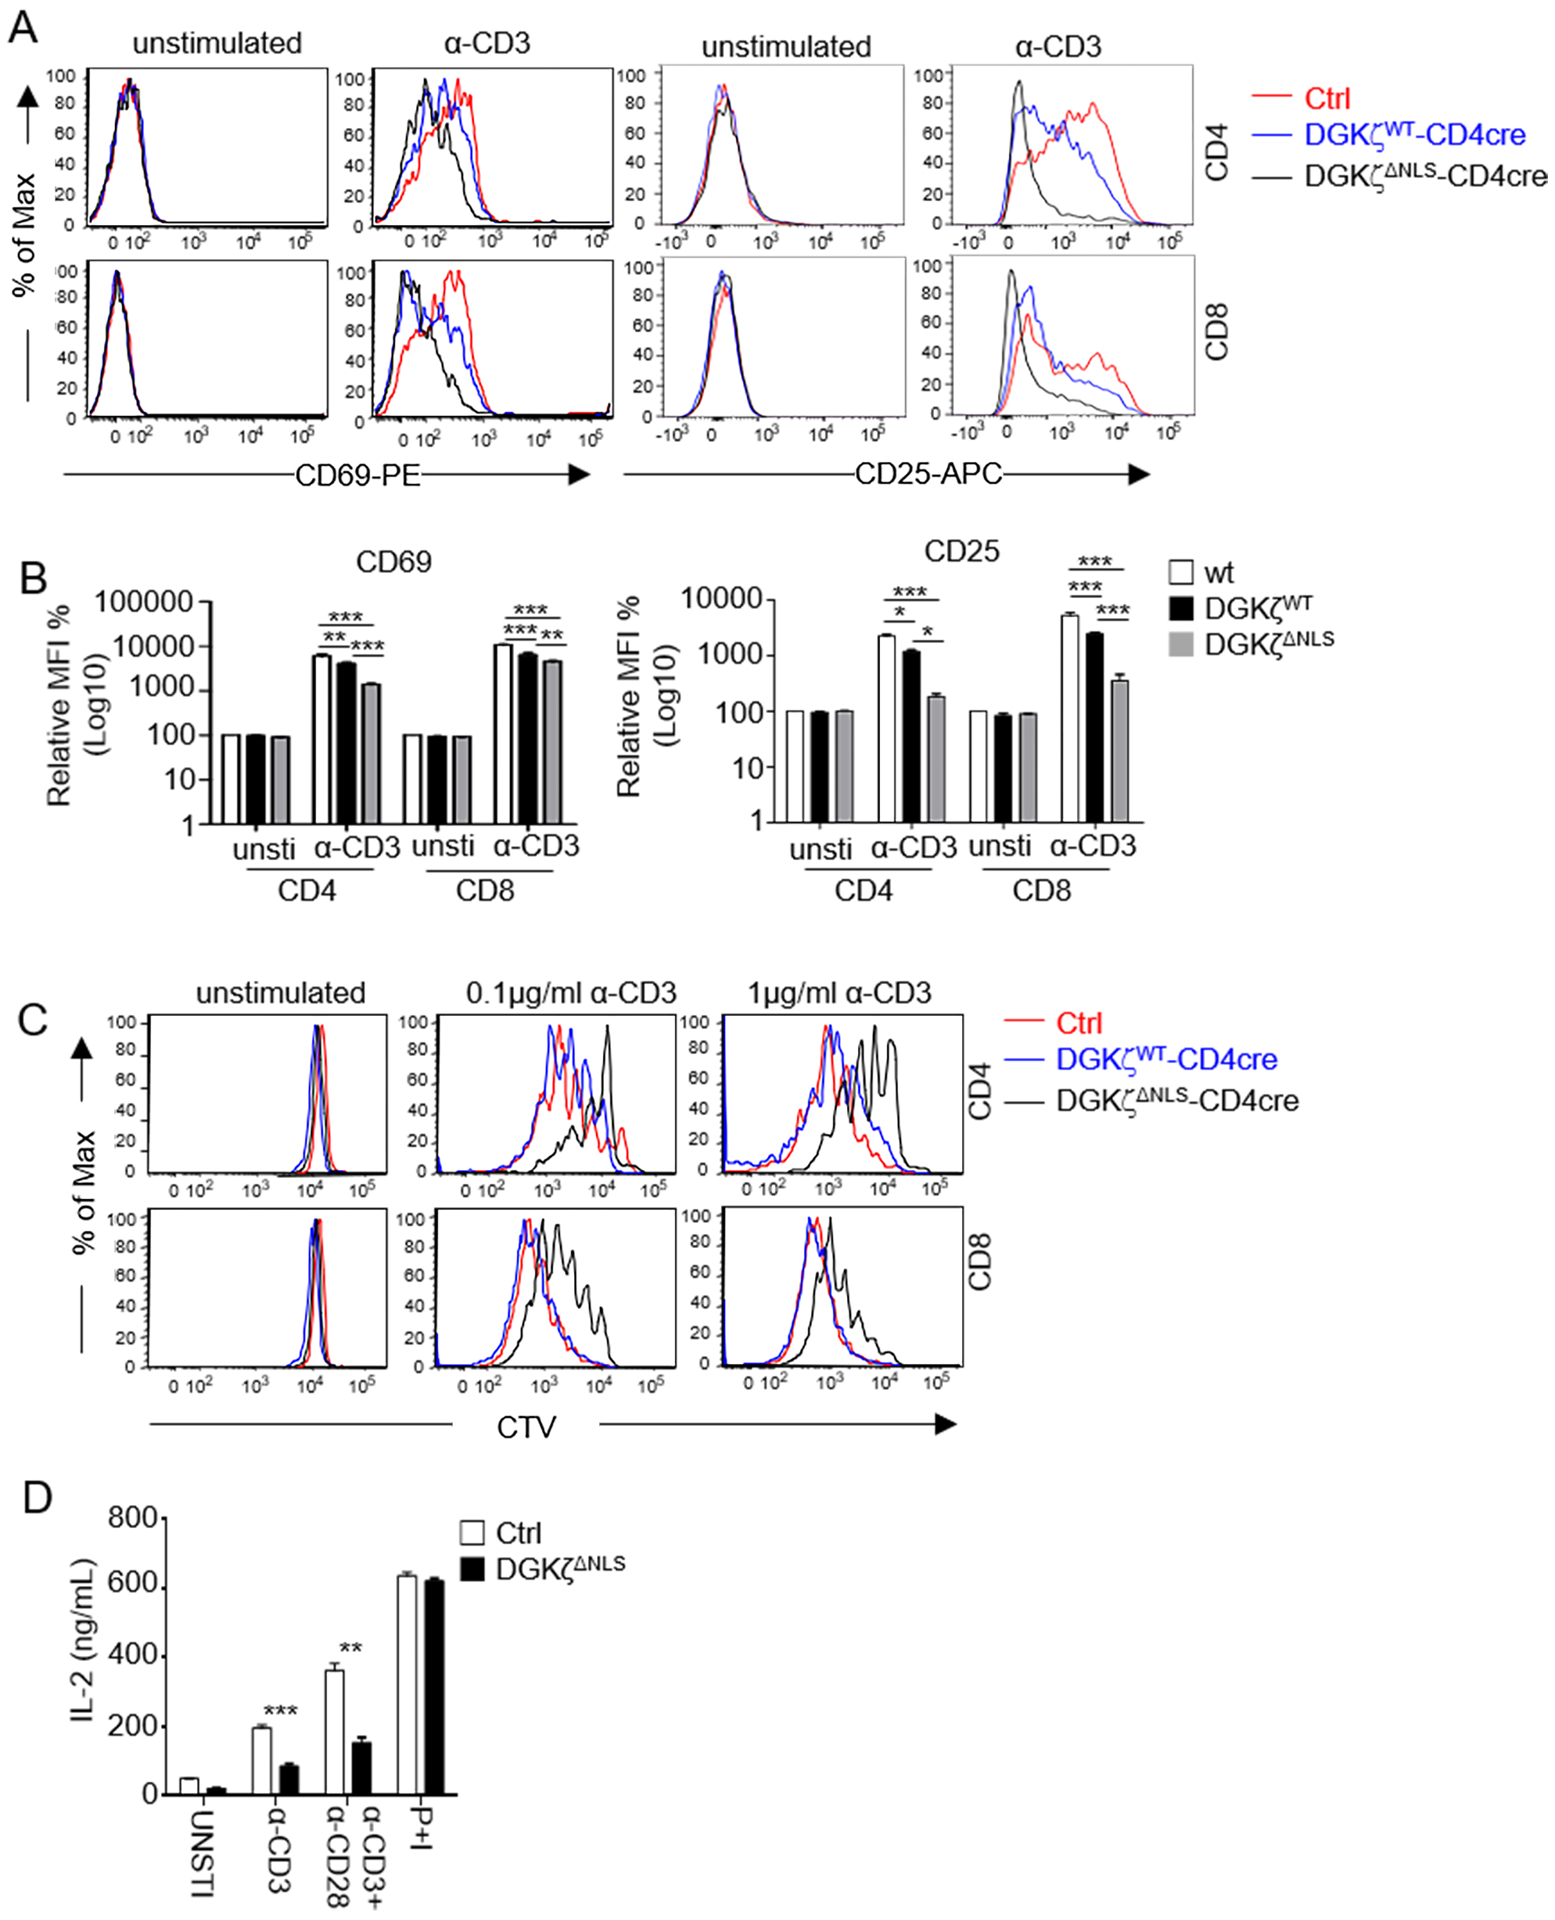
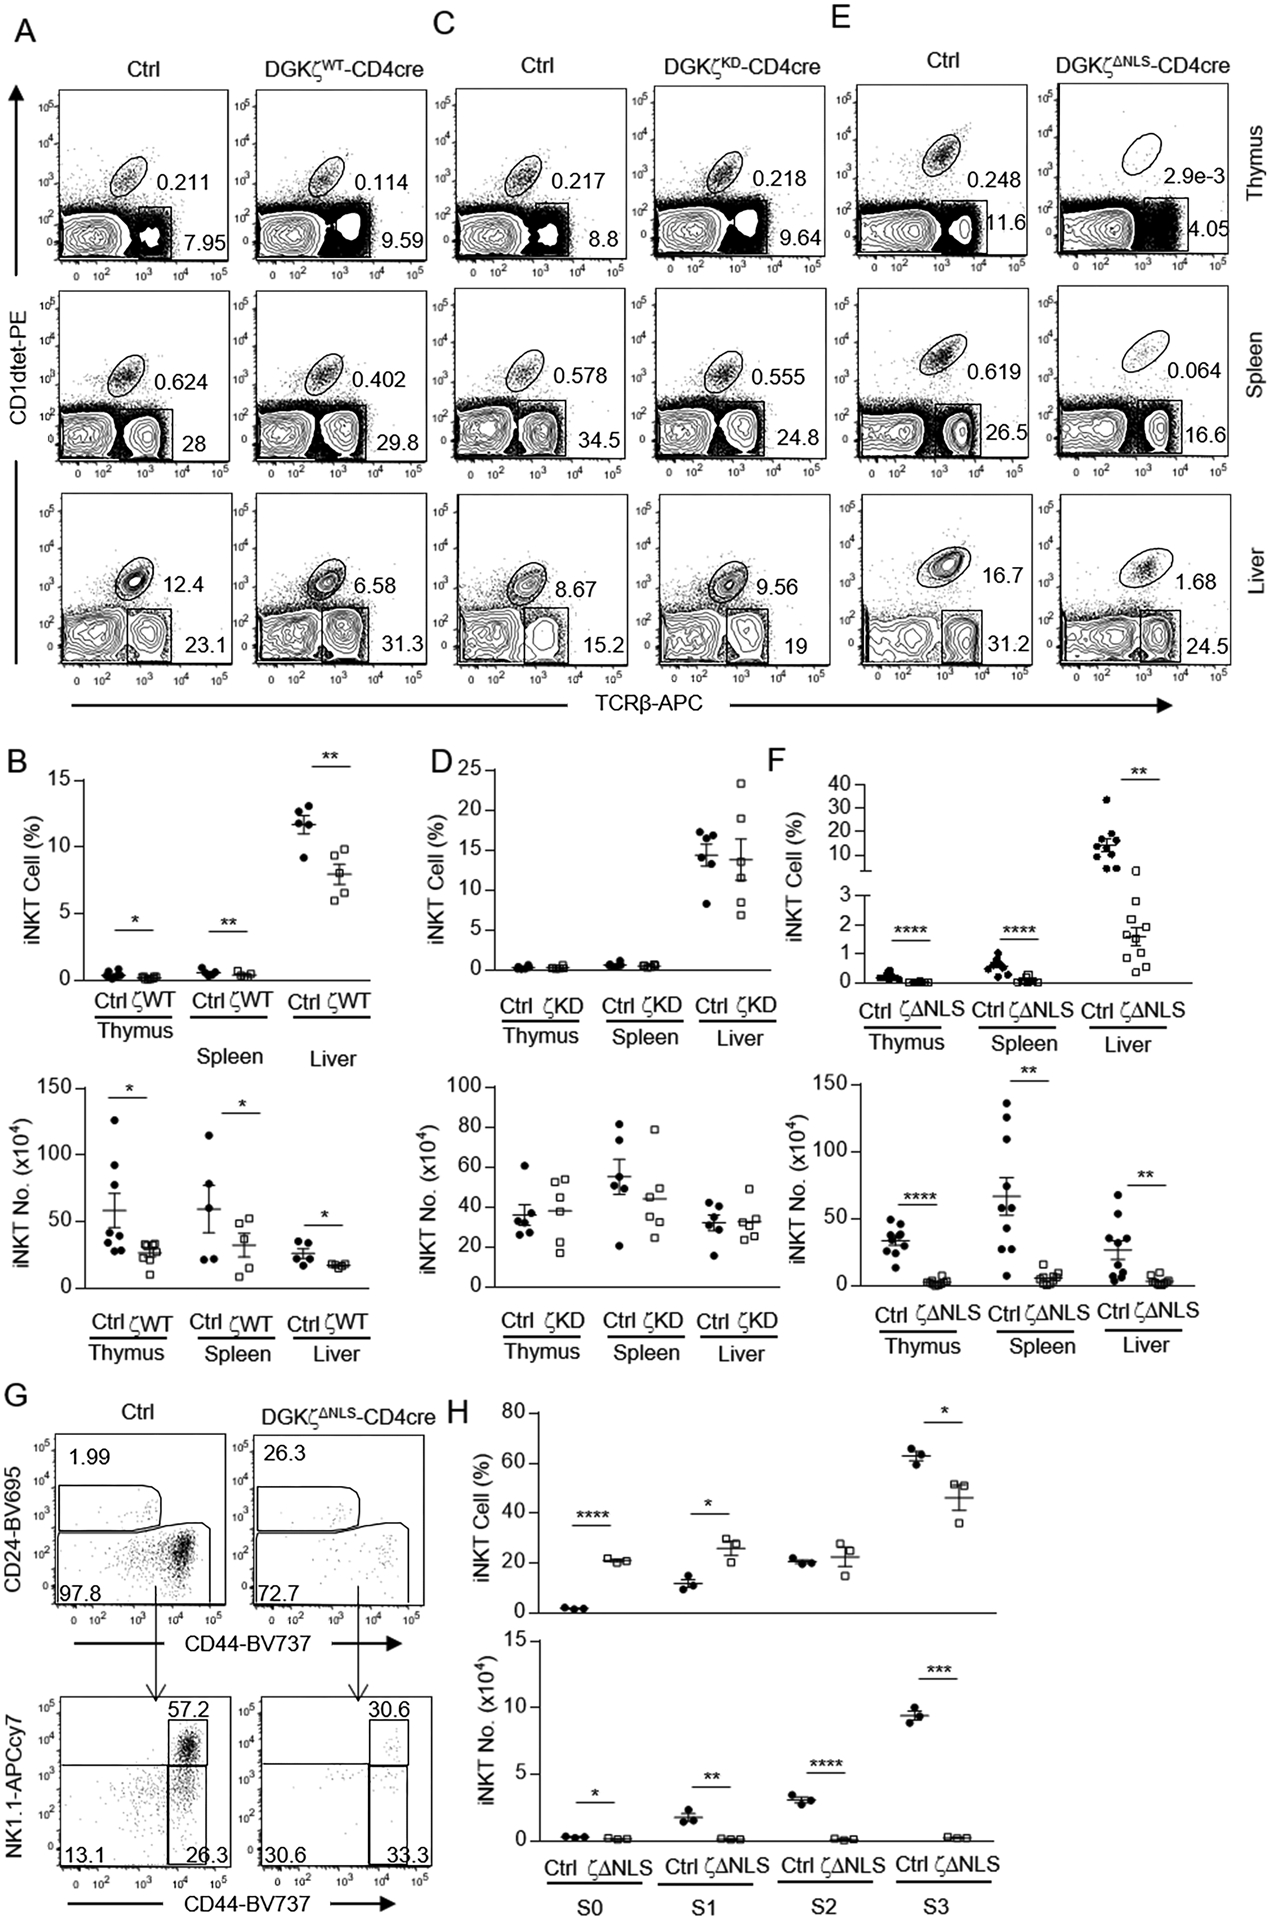
Diacylglycerol kinases (DGKs) play important roles in restraining diacylglycerol (DAG)-mediated signaling. Within the DGK family, the ζ isoform appears to be the most important isoform in T cells for controlling their development and function. DGKζ has been demonstrated to regulate T cell maturation, activation, anergy, effector/memory differentiation, defense against microbial infection, and antitumor immunity. Given its critical functions, DGKζ function should be tightly regulated to ensure proper signal transduction; however, mechanisms that control DGKζ function are still poorly understood. We report here that DGKζ dynamically translocates from the cytosol into the nuclei in T cells after TCR stimulation. In mice, DGKζ mutant defective in nuclear localization displayed enhanced ability to inhibit TCR-induced DAG-mediated signaling in primary T cells, maturation of conventional αβT and iNKT cells, and activation of peripheral T cells compared with WT DGKζ. Our study reveals for the first time nuclear sequestration of DGKζ as a negative control mechanism to spatially restrain it from terminating DAG mediated signaling in T cells. Our data suggest that manipulation of DGKζ nucleus-cytosol shuttling as a novel strategy to modulate DGKζ activity and immune responses for treatment of autoimmune diseases and cancer.

Keywords: Ras/MAPK; T cell development; TCR; diacylglycerol kinases; invariant NKT cell.


Conflict of interest statement

Conflict of Interest Disclosures

The authors declare no commercial or financial conflict of interests.

Figures

Figure 1.
Figure 1.. Generation of WT and mutant DGKζ transgenic mice.
A. Schematic structure of DGKζ. B. GFP-DGKζ knock-in mice. Rosa: Rosa26 locus; P: CAG promoter; STOP, transcription stop cassette. C. Genotyping of GFP-DGKζKI mice by PCR. D. Detection of DGKζ by western blot with an anti-DGKζ antibody and anti-GFP antibody. Endogenous DGKζ1 and ζ2 are indicated with horizontal lines. Red arrow indicates GFP-DGKζ function proteins, which overlap with the endogenous DGKζ2. Loading control is detected with an anti-TCRβ antibody. E. Quantification the GFP-DGKζ fusion protein levels relative to endogenous DGKζ2 in WT thymocytes using Image J. F. Detection of GFP expression in thymocytes. G. Detection of GFP expression in B220+ B cells. H. TCRβ expression in different thymocyte subsets. Data in F and H were measured by flow cytometry. Each histogram represents 100% of the indicated cell population. Data shown are representative of or pooled from three experiments and error bars represent mean ± SEM, N = 3 mice for WT (Ctrl), GFP-DGKζWT-CD4Cre, GFP-DGKζΔNLS-CD4Cre, and GFP-DGKζKD-CD4Cre mice in D – H.
Figure 2.
Figure 2.. Impaired T cell generation by DGKζΔNLS.
Thymocytes from 6 – 10 weeks old GFP-DGKζWT-CD4Cre, GFP-DGKζKD-CD4Cre, GFP-DGKζΔNLS-CD4Cre, and control mice were examined. A. Total thymocyte numbers. B. Representative flow cytometry plots showing TCRβ staining in thymocytes. C. Percentages and numbers of TCRβ+ thymocytes. Data shown are representative of (B) or pooled (A, C) from at least eight experiments and are shown as mean ± SEM. Each circle or square represents one mouse of the indicated genotypes. *, p<0.05; ***, p<0.001; ****, p<0.0001 determined by Student t-test. (N=11 for both DGKζWT-CD4Cre and control mice, N=13 for both DGKζΔNLS-CD4Cre and control mice, N=9 for both DGKζKD-CD4Cre and control mice)
Figure 3.
Figure 3.. Inhibition of T cell maturation by DGKζΔNLS.
Thymocytes (A – D) and splenocyte (E – G) from 6 – 10 weeks old GFP-DGKζWT-CD4Cre, GFP-DGKζKD-CD4Cre, GFP-DGKζΔNLS-CD4Cre, and control mice were examined by flow cytometry. A. Representative flow cytometry plots showing CD4 and CD8 staining of thymocytes. B. Percentages and numbers of indicated thymocyte populations in GFP-DGKζWT-CD4Cre and control mice. C. Percentages and numbers of indicated thymocyte populations in GFP-DGKζΔNLS-CD4Cre and control mice. D. Percentages and numbers of indicated thymocyte populations in GFP-DGKζKD-CD4Cre and control mice. Data shown are representative of (A) and pooled from (B–D) at least seven experiments (N=9 in both B and C, N=7 in D) and error bars represent mean ± SEM. E. Representative flow cytometry plots showing CD69 and TCRβ staining of DP thymocytes. Scatter plots show percentages and numbers of CD69+TCRβ+ cells in DP thymocytes. Data shown are representative of (plot) or pooled from five experiments, N=5 for both WT and DGKζΔNLS-CD4Cre mice and error bars represent mean ± SEM. F. Percentages and numbers of CD4+ and CD8+ splenic and LN T cells in GFP-DGKζWT-CD4Cre and control mice. Data shown are pooled from at least five experiments, N=9 for both WT and GFP-DGKζWT-CD4Cre mice in spleen, and N=5 for both WT and GFP-DGKζWT-CD4Cre mice in pLN. G. Percentages and numbers of CD4+ and CD8+ splenic and LN T cells in GFP-DGKζΔNLS-CD4Cre and control mice. Data shown are pooled from at least eight experiments. N=10 for both WT and GFP-DGKζΔNLS-CD4Cre mice in spleen, and N=8 for both WT and GFP-DGKζΔNLS-CD4Cre mice in pLN. H. Percentages and numbers of CD4+ and CD8+ splenic and LN T cells in GFP-DGKζKD-CD4Cre and control mice. Data shown are pooled from at least six experiments. N=9 for both WT and GFP-DGKζKD-CD4Cre mice in spleen, and N=6 for both WT and GFP-DGKζKD-CD4Cre mice in pLN. Each circle or square represents one mouse of the indicated genotypes. (F–H) error bars represent mean ± SEM. *, p<0.05; **, p<0.01; ***, p<0.001; ****, p<0.0001, determined by Student t-test (Fig B, E, F, G, and H) or by Mann-Whitney test (Fig C and D).
Figure 4.
Figure 4.. Enhanced inhibition of DAG-mediated signaling and downregulation of Egr1 expression by DGKζΔNLS.
A, B. Thymocytes from WT, GFP-DGKζWT-CD4Cre, and GFP-DGKζΔNLS-CD4Cre mice were left unstimulated or stimulated with an anti-CD3 antibody (500A2) at 37°C for 5 or 15 minutes. Cell lysates were subjected to immunoblotting analyses using the indicated antibodies. β-actin was detected as loading controls (A). Quantification of relative intensity of western blot bands (B). Data shown are representative of (A) or pooled from (B) three experiments (N=3 for WT, GFP-DGKζWT-CD4Cre, and GFP-DGKζΔNLS-CD4Cre mice). Error bars represent mean ± SEM. C. Representative histograms showing Egr1, ThPOK, and Runx3 expression in DP, CD4SP, and CD8SP thymocytes from WT and GFP-DGKζΔNLS-CD4Cre mice. Each histogram represents 100% of the indicated cell population. Data shown are representative of four experiments. N = 4 mice for Ctrl and GFP-DGKζΔNLS-CD4Cre mice. *, p<0.05; **, p<0.01; ***, p<0.001; ****, p<0.0001, determined by Two-way ANOVA test.
Figure 5.
Figure 5.. Enhanced inhibition of T cell activation by DGKζΔNLS.
A. Representative flow cytometry of overlaid histograms of CD69 and CD25 expression in WT, DGKζWT, and DGKζΔNLS CD4 and CD8 T cells after overnight incubation of splenocytes in the presence or absence of an anti-CD3 antibody (0.1 μg/ml). Each histogram represents 100% of the indicated cell population. B. Relative MFI of CD69 and CD25 in the indicated T cells. N = 3 for Ctrl, DGKζWT-CD4Cre and GFP-DGKζΔNLS-CD4Cre mice. Data shown are representative of (A) or pooled from (B) three experiments, N = 3 for Ctrl, GFP-DGKζWT-CD4Cre, and GFP-DGKζΔNLS-CD4Cre mice. Error bars represent mean ± SEM. C. Representative flow cytometry overlaid histograms showing WT, DGKζWT, and DGKζΔNLS CD4 and CD8 T cell proliferation after in vitro stimulation for 72 hours with indicated concentrations of anti-CD3 antibodies. Data shown are representative of three experiments, N = 3 for Ctrl, GFP-DGKζWT-CD4Cre, and GFP-DGKζΔNLS-CD4Cre mice. Each histogram represents 100% of the indicated cell population. D. ELISA for IL-2 concentrations in the supernatant from LN T cells with indicated-treatments for 48 hours. Data are pooled from three experiments. N = 3 for both WT and GFP-DGKζΔNLS-CD4Cre mice. Error bars represent mean ± SEM. *, p<0.05; **, p<0.01; ***, p<0.001; ****, p<0.0001, determined by Two-way ANOVA test (Fig B) or by Student t-test (Fig D).
Figure 6.
Figure 6.. Effects of DGKζWT and DGKζΔNLS on iNKT cell development.
Thymocytes, splenocytes, and liver mononuclear cells from 6 – 10 weeks old GFP-DGKζWT-CD4Cre, GFP-DGKζKD-CD4Cre, GFP-DGKζΔNLS-CD4Cre, and control mice were examined. A, C, E. Representative flow cytometry plots showing TCRβ and PBS57-loaded CD1d tetramer (CD1dTet) staining in live gated cells from thymocytes, splenocytes, and liver mononuclear cells from GFP-DGKζWT-CD4Cre and control mice (A), GFP-DGKζKD-CD4Cre and control mice (C), GFP-DGKζΔNLS-CD4Cre and control mice (E). B, D, F. Percentages and numbers of iNKT cells in the indicated organs and mice. Data shown are representative of (A) and pooled from (B) at least five experiments and are shown as mean ± SEM. For the experiment of iNKT cell percentages and numbers in thymus, N=8 for both Ctrl and DGKζWT-CD4Cre mice. For the experiment of iNKT percentages and numbers in both spleen and liver, N=5 for both Ctrl and DGKζWT-CD4Cre mice. Data shown are representative of six (C) or ten (E) and pooled from six (D) or ten (F) experiments and are shown as mean ± SEM. Each experiment included one ctrl and one test mice. G. Representative flow cytometry plots showing CD24 and CD44 expression in live gated Lin (CD11b, CD11c, B220, Ter119, F4/80) iNKT cells in the thymus (top panels) and CD44 and NK1.1 expression in CD24 iNKT cells (bottom panels). H. Percentages and numbers of indicated iNKT cell stages. CD24+CD44 stage 0 iNKT cells were calculated after exclusion of NK1.1+ cells. Data shown in G are representative of at least three experiments. Data shown in H are calculated from one experiment with three pairs of test and control mice and are shown as mean ± SEM. N = 3 for both Ctrl and GFP-DGKζΔNLS-CD4Cre mice. Each circle or square represents one mouse of the indicated genotypes. *, p<0.05; **, p<0.01; ***, p<0.001; ****, p<0.0001 determined by Student t-test.
Figure 7.
Figure 7.. TCR-induced nuclear localization of DGKζ.
A. LN T cells from GFP-DGKζWT-CD4Cre, GFP-DGKζΔNLS-CD4Cre, and GFP-DGKζKD-CD4Cre mice were stimulated with or without anti-CD3 (145–2C11) for the indicated times, followed in fixation/permeabilization, staining with an Alexa 488 conjugated anti-GFP antibody, and confocal microscopy. Objective magnification: 63×; Zoom: 6×; Scale bar: 8 μM. Representative images are shown. B. Quantification of anti-GFP intensity in the cytosol and nucleus. Each dot shows nuclear/cytoplasm ratio of MFI of GFP in a T cell. C. WT LN CD4+ T cells were unstimulated or stimulated with a plate-bound anti-CD3 antibody (145–2C11) for 22 hours, followed sequential by fixation/permeabilization, staining with a rabbit anti-DGKζ antibody and then a FITC conjugated goat anti-rabbit IgG antibody, and visualization by confocal microscopy. Objective magnification: 63×; Zoom: 6×; Scale bar: 8 μM. Representative images are shown. D. Quantification of FITC intensity in the cytosol and nucleus. Each dot shows nuclear/cytoplasm ratio of MFI of FITC in a T cell. Figure A and B are representative of or pooled from four experiments for GFP-DGKζWT-CD4Cre and GFP-DGKζΔNLS-CD4Cre mice and three experiments for GFP-DGKζKD-CD4Cre mice. N = 1 for each genotype in each experiment. Figure C and D are representative of or pooled from three experiments. One WT mouse was used for each experiment. Error bars represent mean ± SEM. *P < 0.05; **P < 0.01; ***P < 0.001; **** P < 0.0001, determined by Mann-Whitney test (Fig B) or by the Student t test (Fig D).

Similar articles

Cited by

References

    1. Krishna S and Zhong X, Role of diacylglycerol kinases in T cell development and function. Crit Rev Immunol 2013. 33: 97–118. - PMC - PubMed
    1. Merida I, Arranz-Nicolas J, Rodriguez-Rodriguez C and Avila-Flores A, Diacylglycerol kinase control of protein kinase C. Biochem J 2019. 476: 1205–1219. - PubMed
    1. Mariathasan S, Zakarian A, Bouchard D, Michie AM, Zuniga-Pflucker JC and Ohashi PS, Duration and strength of extracellular signal-regulated kinase signals are altered during positive versus negative thymocyte selection. J Immunol 2001. 167: 4966–4973. - PubMed
    1. Alberola-Ila J and Hernandez-Hoyos G, The Ras/MAPK cascade and the control of positive selection. Immunol Rev 2003. 191: 79–96. - PubMed
    1. Goplen N, Karim Z, Guo L, Zhuang Y, Huang H, Gorska MM, Gelfand E, et al., ERK1 is important for Th2 differentiation and development of experimental asthma. FASEB J 2012. 26: 1934–1945. - PMC - PubMed

Publication types