. 2020 Jun 10;11(1):2935.
doi: 10.1038/s41467-020-16735-2.

A cancer drug atlas enables synergistic targeting of independent drug vulnerabilities

Affiliations

A cancer drug atlas enables synergistic targeting of independent drug vulnerabilities

Ravi S Narayan et al. Nat Commun. .

Abstract

Personalized cancer treatments using combinations of drugs with a synergistic effect is attractive but proves to be highly challenging. Here we present an approach to uncover the efficacy of drug combinations based on the analysis of mono-drug effects. For this we used dose-response data from pharmacogenomic encyclopedias and represent these as a drug atlas. The drug atlas represents the relations between drug effects and allows to identify independent processes for which the tumor might be particularly vulnerable when attacked by two drugs. Our approach enables the prediction of combination-therapy which can be linked to tumor-driving mutations. By using this strategy, we can uncover potential effective drug combinations on a pan-cancer scale. Predicted synergies are provided and have been validated in glioblastoma, breast cancer, melanoma and leukemia mouse-models, resulting in therapeutic synergy in 75% of the tested models. This indicates that we can accurately predict effective drug combinations with translational value.


Conflict of interest statement

The authors declare no competing interests.

Figures
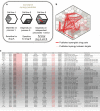
Fig. 1
Fig. 1. Concept of synergy prediction and depiction of the curated data on the atlas.
a Schematic representation of drug-atlas approach. If two cell lines have mutually exclusive sensitivity to either drug A or B, as shown by the intensity of each diamond, then two independent molecular mechanisms might be causal of this. However, when a third cell line is sensitive to both of these drugs, then these unrelated mechanisms are affected simultaneously, giving rise to a synergistic effect. Hence, in our model, synergy between drugs is expected when pairs of drugs act on independent processes. b Relations of drug dose–response data are difficult to comprehend, given the enormous amount of data points associated with them. We used a Vonoroi diagram to depict drug dose–response data of the GDSC drug–response encyclopaedia, which resulted in a drug atlas. Depicting manually curated drug synergies for the GDSC cell lines (483 synergistic drug pairs occurring in 156 cell lines), shows that synergistic drug pairs commonly have a distal location, as shown by synergistic drug–drug combinations (solid red lines) or synergistic target–target combinations (dotted lines). c An exempt of the list of curated synergy pairs that are matched to the GDSC data. The full list is available in Supplementary Data 2, and references are listed in the Supplementary References. In total, there are n = 274 cases of drug and target synergy shown on the drug atlas.
Fig. 2
Fig. 2. Synergistic drug pairs show a large distance on the drug atlas.
a The cophenetic distance (to quantify the drug-effect-dissimilarity) between the curated synergistic drug pairs was compared with distances between drugs in the same-ontology group or the distance between all drugs. The distance of curated synergistic drug pairs significantly exceeds the average distance between all drugs as well as the same-ontology distance, which indicates that most synergistic drug pairs have a relative large drug distance. To calculate the cophenetic distance, WARD.D2 clustering was used (dynamic window shown on the right of the histogram). b Similar results were obtained when the distances between targets of the drugs were used. c When the benchmark data of DREAM were analyzed, similar results were seen when the distances between targets of the drugs were used. d Histograms showing that between-process interactions as seen in synergistic combinations match between-process interactions over all drug pairs, indicating that synergy occurs both within as well as between processes and is not limited to between-process interactions. e According to our model, sensitivity for both drugs is necessary for synergy to occur. Since we have used GDSC cell lines for our curation, we were able to match drug sensitivities to occurrence of synergy which showed that a significant higher sensitivity is observed for synergistic drugs compared with the overall sensitivity for the corresponding drugs. Sensitivities are normalized to 1 representing the average of all IC50s for a drug in a certain tissue. Overall sensitivity includes all known IC50 values for the cases where synergy was observed. Targeted indicates that a targeted drug is used in a cell line that harbors the respective mutated target. Non-targeted indicates that mutation-targeted drugs in a non-mutated or non-amplified context. f When the benchmark data of DREAM were analyzed, similar results were seen when the sensitivities of the drugs were used. P-values af, Student's t test (one-sided). Error bars histograms, standard error; box-and-whiskers plot, minimum, 25th percentile, median, 75th percentile, and maximum. Curated drug–drug distances synergistic drug pairs n = 81, all drug–drug distances: n = 8515; within-pathway distances, n = 235; target–target synergistic pairs n = 193. Comparison between and within pathways for all versus synergistic drug pairs: all within n = 495; all between n = 2746; synergy within n = 117; synergy between n = 363.
Fig. 3
Fig. 3. Synergistic drug pairs show a large distance on the drug atlas.
a Occurrence of synergy with EGFR/HER2 inhibitors in breast tumor cell lines is significantly linked to mutations of the EGFR or HER2 genes. b Example of a heatmap of a typical experimental result of our drug screen showing the relative viability as a result of the titration of two drugs in different combinations. Synergy was calculated by the median effect principle by Chou and Tallalay. c A total of 30 preselected drug pairs were validated for synergistic efficacy in nine GBM cell lines. Drugs were chosen because these drugs showed a high drug distance on the drug atlas (see Supplementary Fig. 3a) and because they individually show a high sensitivity (see Supplementary Fig. 3b). The histogram shows the summary of the results of in vitro measurement of drug–drug synergy showing a significant enrichment over the background. d Area under the curve analysis of the dose-responder curve shows that the distance as well as the sensitivity contribute to the predictive power of the synergy prediction model for both tested datasets. d The synergy prediction model that we developed based on the previous data shows a good performance by the receiver operator curve analysis. Model performance was tested through cross-validation of the curated data and on the benchmark data of Menden et al. and quantified using the area under the curve. P-values a, c χ2 test. Error bars histograms, standard error; Fraction of cell lines with EGFR/HER mutations (n = 35) is compared with wild-type cell lines (n = 43). The glioblastoma synergy screen was performed in triplicate and showed n = 91 (synergy) versus n = 116 (no synergy) as compared with random pick n = 16 (synergy) versus n = 184 (non-synergy). All dose–response effects were cross-validated numerous times. The prediction model was trained on 463 combinations, where the controls were taken iteratively (n = 1000). For the in vitro validation of synergy, non-consistent results were repeated until consistent.
Fig. 4
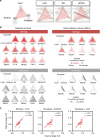
Fig. 4. Identification and validation of a synergistic therapy of three drugs.
a Plots showing a magnified part of drug atlas containing the dual synergy results. The plots enable to identify putative triple-synergistic drug combinations by connecting effective dual synergistic combinations in this case leading to identification of an Erlotinib, Torin1, and Docetaxel combination, which was validated in 21 cell lines. b Combination indexes of serial twofold dilutions of the three drugs when administered as a dual (outer triangle) or triple combinations (inner triangle). Both serum grown classical cell lines as well as serum-free cultured primary GBM cultures were analyzed. Synergy (shown in red) was calculated by the median effect principle by calculating the added effect of the third drug on top of the effect of the first two drugs (secondary synergy, see Methods). For this, twofold dilutions that led to a IC50 effect were performed, using drug concentrations of Erlotinib (2–20 µM), Torin (0.4 µM), and Docetaxel (6.3–25 nM) as start concentrations. Lower panels in grey show relative viabilities after treatment with the three tested drugs. Drugs were diluted in a twofold manner and viability was assayed using CellTiter Glo 3D after 72 h. All data points were normalized to untreated controls. Experiments were performed in triplicate and repeated independently. Non-consistent results were repeated until consistent. c The combination indexes of measured dual synergies were significantly predictive for triple synergy as shown for 21 experimentally tested cell lines. r value is the Pearson correlation. P-value: Pearson correlation P-value.
Fig. 5
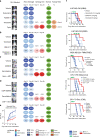
Fig. 5. In vivo validation of predicted combination therapies.
a In vivo luminescence monitoring after orthotopic transplantation of Fluc-mCherry-tagged U87-GBM cells. Tumors were engrafted for 1 week and then treated with Osimertinib, AZD2014, and docetaxel (RLU median). Measurement of averages of luciferase activity (RLU average) is shown after 14 and 18 days showing a synergistic response (combination index between 0.55 and 0.21). Note that some toxicity was observed in docetaxel-treated mice. b Similar setup showing orthotopically transplanted Fluc-mCherry-tagged U87-GBM cells (median of each group is shown) after treatment with the PI3K/mTOR inhibitor GNE-317, and the microtubule inhibitor Docetaxel, resulting in a synergistic response (combination index between 0.56 and 0.80). c Measurement of luciferase activity in the triple-negative breast cancer cell model MDA-MD-231-FM showing the median after treatment with the BRAF inhibitor AZD628 in combination with the nucleoside analog Gemcitabine, resulting in a strong synergistic response (combination index between 0.06 and 0.11). d Measurement of luciferase activity in the orthotopically transplanted Melanoma model CHL1-FM showing the median after treatment with the CDK4 inhibitor GCP-082996 and the nucleoside analog Gemcitabine resulting in a synergistic response (combination index between 0.62 and 0.68). e In vivo luminescence measurement of tail vein-injected chronic myeloid leukemia (CML) BV-173-Gluc cells. Due to the metastatic nature of the transplantation, the cancer cells were tagged with soluble Gluc which can be measured in the blood of the mice, showing a synergistic decrease in luciferase activity when the combination therapy of the ABL inhibitor Imatinib together with the ABL inhibitor Dasatinib was applied (combination index between 0.24 and 0.79). f Kaplan–Meier curves showing a better survival of mice treated with the combination of drugs (see Supplementary Data 5). For all experiments, luciferase levels were normalized to levels of one week after injection. Toxicity monitoring consisted of assessment of body weight, hematopoietic-, liver-, and brain toxicity. P-value: t test (one-sided) of the median survival. The number of mice per group are shown in the figures.

Similar articles

Cited by

References

    1. Johannessen CM, et al. COT drives resistance to RAF inhibition through MAP kinase pathway reactivation. Nature. 2010;468:968–972. - PMC - PubMed
    1. Emery CM, et al. MEK1 mutations confer resistance to MEK and B-RAF inhibition. Proc. Natl Acad. Sci. USA. 2009;106:20411–20416. - PMC - PubMed
    1. Sequist Lv, et al. Genotypic and histological evolution of lung cancers acquiring resistance to EGFR inhibitors. Sci. Transl. Med. 2011;3:75ra26–75ra26. - PMC - PubMed
    1. Hatzivassiliou G, et al. ERK inhibition overcomes acquired resistance to MEK inhibitors. Mol. Cancer Ther. 2012;11:1143–1154. - PubMed
    1. Nazarian R, et al. Melanomas acquire resistance to B-RAF(V600E) inhibition by RTK or N-RAS upregulation. Nature. 2010;468:973–977. - PMC - PubMed

Publication types