. 2020 Jul 21;31(16):1691-1702.
doi: 10.1091/mbc.E19-12-0719. Epub 2020 Jun 10.

Epithelial tissue geometry directs emergence of bioelectric field and pattern of proliferation

Affiliations

Epithelial tissue geometry directs emergence of bioelectric field and pattern of proliferation

Brian B Silver et al. Mol Biol Cell. .

Abstract

Patterns of proliferation are templated by both gradients of mechanical stress as well as by gradients in membrane voltage (Vm), which is defined as the electric potential difference between the cytoplasm and the extracellular medium. Either gradient could regulate the emergence of the other, or they could arise independently and synergistically affect proliferation within a tissue. Here, we examined the relationship between endogenous patterns of mechanical stress and the generation of bioelectric gradients in mammary epithelial tissues. We observed that the mechanical stress gradients in the tissues presaged gradients in both proliferation and depolarization, consistent with previous reports correlating depolarization with proliferation. Furthermore, disrupting the Vm gradient blocked the emergence of patterned proliferation. We found that the bioelectric gradient formed downstream of mechanical stresses within the tissues and depended on connexin-43 (Cx43) hemichannels, which opened preferentially in cells located in regions of high mechanical stress. Activation of Cx43 hemichannels was necessary for nuclear localization of Yap/Taz and induction of proliferation. Together, these results suggest that mechanotransduction triggers the formation of bioelectric gradients across a tissue, which are further translated into transcriptional changes that template patterns of growth.


Figures

FIGURE 1:
FIGURE 1:
Microfabricated epithelial tissues exhibit patterns of proliferation defined by tissue geometry and mechanical stress. (A) Mammary epithelial cells were microfabricated into square tissues and (B) stained for nuclei and β-catenin. (C) Immunofluorescence analysis for Ki67 in an individual tissue and (D) frequency maps of 62 tissues (n = 3 independent replicates) reveal increased proliferation at the tissue periphery. (E) EdU analysis of an individual tissue and (F) frequency maps of 70 tissues (n = 3 independent replicates) show elevated synthesis of DNA at the periphery. (G) Traction force microscopy analysis shows increased mechanical stress at the periphery of the tissue (n = 3 separate tissues). (H) Phase-contrast image and (I) EdU frequency map of 16 sinusoidal tissues that contain both convex and concave regions. Scale bars represent 100 μm (H, I) or 50 μm (all other panels).
FIGURE 2:
FIGURE 2:
Cells located in high-stress regions show increased depolarization. (A) DiBac4(3) staining of a single square mammary epithelial tissue. (B) Frequency map of 78 tissues stained for DiBac4(3) across three independent replicates. Scale bars represent 50 μm. (C) Quantification of DiBac4(3) fluorescence in different regions of mammary epithelial tissues (n = 3 independent replicates). Shown are mean + SD. *P < 0.05 as determined by a one-sample t test comparing to a hypothetical value of one. (D) The percentage of difference in DiBac4(3) intensity between cells located in central and peripheral regions of control tissues compared with gramicidin-treated tissues (n = 3 independent replicates). Shown are mean + SD. *P < 0.05 as determined by an unpaired parametric t test with Welch’s correction. (E) DiBac4(3) staining of a single sinusoidal tissue. (F) Frequency map of 21 sinusoidal tissues across a representative replicate. Scale bars represent 100 μm. (G) DiBac4(3) staining of a single annular tissue. (H) Frequency map of 23 annular tissues across a representative replicate. (I) Representative image of mammary epithelial tissues treated with gramicidin showing the location of EdU-positive cells (blue). (J) Frequency map of 78 tissues across three independent replicates reveals proliferation throughout the tissues. Scale bars represent 50 μm.
FIGURE 3:
FIGURE 3:
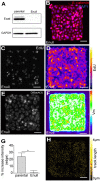
Gradients of Vm and proliferation require intercellular contacts. (A) Immunoblotting analysis for E-cadherin (Ecad) and GAPDH in parental mammary epithelial and Enull cells (n = 3). (B) Enull cells were microfabricated into square tissues and stained for nuclei and β-catenin. (C) EdU analysis of an individual Enull tissue and (D) frequency maps of 25 tissues across a representative replicate reveal a uniform pattern of DNA synthesis. (E) DiBac4(3) staining of an individual Enull tissue and (F) frequency map of 27 tissues across a representative replicate. (G) Quantification of DiBac4(3) fluorescence in different regions of Enull tissues (n = 3 independent replicates). Shown are mean + SD. *P < 0.05 as determined by an unpaired parametric t test with Welch’s correction. (H) Traction force microscopy of Enull tissues (n = 3) revealed no discernable pattern of mechanical stress within the tissue. Scale bars represent 50 μm.
FIGURE 4:
FIGURE 4:
Gradients of Vm and proliferation depend on intercellular transmission of force. (A) GFP expression in a tissue transduced with bicistronic adenovirus encoding for GFP and EΔ. (B) DiBac4(5) staining of an individual EΔ tissue. (C) GFP expression in a tissue transduced with control adenovirus encoding GFP alone. (D) DiBac4(5) staining of an individual GFP control tissue. (E) Frequency map of 45 GFP control tissues (left) and 41 EΔ tissues (right) stained with DiBac4(5). (F) Quantification of DiBac4(5) fluorescence in different regions of Ad-GFP or EΔ tissues. (G) Frequency map of 50 control tissues (left) and 55 blebbistatin-treated tissues (right) treated with DiBac4(3). (H) Quantification of DiBac4(3) fluorescence in different regions of control or blebbistatin-treated tissues. (I) DiBac4(3) imaging in an epithelial tissue treated with blebbistatin. Three independent replicates were performed for all experiments. Shown are mean + SD. *P < 0.05 as determined by an unpaired parametric t test with Welch’s correction. Scale bars represent 50 μm.
FIGURE 5:
FIGURE 5:
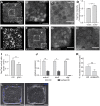
Tissue geometry and Vm regulate spatial patterns of Yap/Taz nuclear localization. (A) Immunofluorescence analysis for Yap/Taz in a representative mammary epithelial tissue. Scale bar represents 50 μm. (B) Magnified image of the area indicated by the dashed white line in A, showing increased nuclear localization of Yap/Taz in cells at the tissue periphery. (C) Magnified image of the center of the tissue shown in A. Scale bars represent 25 μm. (D) Quantification of Yap/Taz nuclear/cytoplasmic ratios in cells located in different regions of the tissues (n = 3 independent replicates). Shown are mean + SD. **P < 0.01 as determined by an unpaired parametric t test with Welch’s correction. (E) Immuno­fluorescence analysis for Yap/Taz in a representative Enull tissue. Scale bar represents 50 μm. (F) Immunofluorescence analysis for Yap/Taz in a mammary epithelial tissue depolarized by treatment with gramicidin. Scale bar represents 50 μm. (G) Magnified image of the area indicated by the dashed white line in F, showing Yap/Taz in cells at the tissue periphery. (H) Magnified image of the center of the tissue shown in F. Scale bars represent 25 μm. (I) Difference in nuclear/cytoplasmic ratio of Yap/Taz immunofluorescence in outer and inner cells of tissues treated with gramicidin vs. control (n = 3 independent replicates). Shown are mean + SD. ***P < 0.001 as determined by a paired parametric t test. (J) RT-qPCR showing transcript levels of the Yap targets ankrd1, birc5, and ctgf on treatment with verteporfin (3 µM; n = 3 independent replicates). Shown are mean + SD. *P < 0.05; **P < 0.01; ***P < 0.001, as determined by an unpaired parametric t-test with Welch’s correction. (K) Quantification of DiBac4(3) fluorescence difference in inner vs. outer regions of verteporfin-treated tissues (n = 3 independent replicates). Shown are mean + SD. (L) Representative images of EdU-positive cells (blue) in control or verteporfin-treated tissues. Scale bars represent 50 μm.
FIGURE 6:
FIGURE 6:
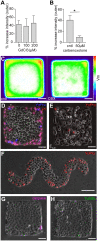
Large-diameter ion conduits are implicated in the regulation of Vm by tissue geometry. (A) Quantification of DiBac4(3) fluorescence in different regions of tissues treated with GdCl3 (n = 3 independent replicates). Shown are mean + SD. (B) Quantification of DiBac4(3) fluorescence in different regions of tissues treated with carbenoxolone (CBX). Shown are mean +SD. *P < 0.05 as determined by an unpaired parametric t test with Welch’s correction (n = 3 independent replicates). (C) Frequency map of DiBac4(3) fluorescence in 85 control tissues (left) and 93 CBX-treated tissues (right) across three independent replicates. (D) Representative images of YoPro or PI uptake in epithelial tissues (red, PI; blue, YoPro; gray, phase contrast). (E) Representative image of YoPro uptake in an Enull tissue (red, YoPro; gray, phase contrast). Scale bars represent 50 μm. (F) Representative image of YoPro uptake in a sinusoidal epithelial tissue (red, YoPro; gray, phase contrast). Scale bar represents 100 μm. (G) Representative image of cleaved caspase-3 immunofluorescence in an epithelial tissue (magenta, caspase-3; gray, phase contrast). (H) Representative image of TUNEL assay in an epithelial tissue (green, TUNEL; gray, phase contrast). Scale bars represent 50 μm.
FIGURE 7:
FIGURE 7:
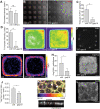
Cx43 hemichannels are required for spatial gradients of Vm. (A) Quantification of DiBac4(3) fluorescence in different regions of tissues treated with 10Panx (n = 3 independent replicates). Shown are mean + SD. (B) Representative image of YoPro uptake in tissues treated with TAT-gap19. (C) Percentage of tissues showing YoPro uptake at the periphery (n = 3 independent replicates). Shown are mean + SD. *P < 0.05 as determined by an unpaired Student’s t test (n = 3 independent replicates (D) Quantification of DiBac4(3) fluorescence in different regions of tissues treated with TAT-gap19. Shown are mean + SD. *P < 0.05 as determined by an unpaired parametric t test with Welch’s correction. (E) Frequency map of DiBac4(3) fluorescence in 24 control tissues (left) and 23 TAT-gap19-treated tissues (right) across a representative replicate. (F) EdU analysis of a representative tissue treated with TAT-gap19. (G) Frequency maps of 66 control tissues (left) and 75 tissues treated with TAT-gap19 (right) across three independent replicates show a qualitative decrease in average EdU signal at the periphery of the tissues. (H) Quantification of number of EdU-positive cells at the periphery of tissues treated with TAT-gap19 vs. control (n = 3 independent replicates). Shown are mean + SD. *P < 0.05 as determined by an unpaired Student’s t test with Welch’s correction. (I) Immunofluorescence analysis for Yap/Taz in an individual TAT-gap19-treated tissue. (J) Quantification of the difference in Yap/Taz nuclear/cytoplasmic ratio in outer vs. inner cells of tissues treated with TAT-gap19 (n = 3 independent replicates). Shown are mean + SD. *P < 0.05 as determined by an unpaired Student’s t test with Welch’s correction. (K) Immunofluorescence analysis for Cx43 in epithelial tissues showing lateral membrane localization (gap junctions) and apical puncta (putative hemichannels). (L) Immunofluorescence analysis for Cx43 across an entire epithelial tissue. Scale bars represent 10 μm (K) or 50 μm (all other panels).
FIGURE 8:
FIGURE 8:
Proposed model for the regulation of Vm gradients by epithelial tissue geometry. Mechanical stress at the tissue periphery triggers opening of Cx43 hemichannels, causing membrane depolarization. This in turn facilitates Yap/Taz localization to the nucleus in a calcium-dependent manner, increasing proliferation at the tissue periphery.

Comment in

  • Editorial introduction.
    Yap AS. Yap AS. Mol Biol Cell. 2020 Jul 21;31(16):1651-1653. doi: 10.1091/mbc.E20-06-0414. Mol Biol Cell. 2020. PMID: 32692641 Free PMC article.

Similar articles

Cited by

References

    1. Abudara V., Bechberger J., Freitas-Andrade M., De Bock M., Wang N., Bultynck G., Naus C.C., Leybaert L., Giaume C. (2014). The connexin43 mimetic peptide Gap19 inhibits hemichannels without altering gap junctional communication in astrocytes. Front Cell Neurosci , 306. - PMC - PubMed
    1. Adams D.S., Levin M. (2013). Endogenous voltage gradients as mediators of cell-cell communication: strategies for investigating bioelectrical signals during pattern formation. Cell Tissue Res , 95–122. - PMC - PubMed
    1. Adams D.S., Masi A., Levin M. (2007). H+ pump-dependent changes in membrane voltage are an early mechanism necessary and sufficient to induce Xenopus tail regeneration. Development , 1323–1335. - PubMed
    1. Adams D.S., Robinson K.R., Fukumoto T., Yuan S., Albertson R.C., Yelick P., Kuo L., McSweeney M., Levin M. (2006). Early, H+-V-ATPase-dependent proton flux is necessary for consistent left-right patterning of non-mammalian vertebrates. Development , 1657–1671. - PMC - PubMed
    1. Alenghat F.J., Nauli S.M., Kolb R., Zhou J., Ingber D.E. (2004). Global cytoskeletal control of mechanotransduction in kidney epithelial cells. Exp Cell Res , 23–30. - PubMed

Publication types

LinkOut - more resources