. 2020 Aug 1;31(17):1917-1930.
doi: 10.1091/mbc.E20-04-0232. Epub 2020 Jun 10.

An IFT20 mechanotrafficking axis is required for integrin recycling, focal adhesion dynamics, and polarized cell migration

Affiliations

An IFT20 mechanotrafficking axis is required for integrin recycling, focal adhesion dynamics, and polarized cell migration

Steven Su et al. Mol Biol Cell. .

Abstract

Directional cell migration drives embryonic development, cancer metastasis, and tissue repair and regeneration. Here, we examine the role of intraflagellar transport (IFT) 20 (Ift20) during polarized migration of epidermal cells. IFT20 is implicated in regulating cell migration independently of the primary cilium, but how IFT proteins integrate with the cell migration machinery is poorly understood. We show that genetic ablation of IFT20 in vitro slows keratinocyte migration during wound healing. We find that this phenotype is independent of the primary cilium and instead can be attributed to alterations in integrin-mediated mechanotransduction and focal adhesion (FA) dynamics. Loss of Ift20 resulted in smaller and less numerous FAs and reduced the levels of activated FA kinase. Studies of FA dynamics during microtubule-induced FA turnover demonstrated that Ift20 loss specifically impaired the reformation, but not the disassembly, of FAs. In the absence of Ift20 function, β1 integrins endocytosed during FA disassembly are not transferred out of Rab5 (+) endosomes. This defective transit from the early endosome disrupts eventual recycling of β1 integrins back to the cell surface, resulting in defective FA reformation. In vivo, conditional ablation of Ift20 in hair follicle stem cells (HF-SCs) similarly impairs their ability to invade and migrate during epidermal wound healing. Using explant studies, lineage tracing, and clonal analysis, we demonstrate that Ift20 is required for HF-SC migration and their contribution to epidermal regeneration. This work identifies a new Ift20 mechanotrafficking mechanism required for polarized cell migration and stem cell-driven tissue repair.


Figures

FIGURE 1:
FIGURE 1:
IFT20 is required for the polarized migration of primary keratinocytes in response to in vitro wound repair. (A) Schematic of keratinocyte isolation from IFT20 fl/fl Rosa 26-tdTomato skin and transduction of lentiviral-Cre (LV-Cre), which induced Tomato fluorescence. (B) IF images of Ift20 and GM130 in IFT20 fl/fl Rosa-Tomato keratinocytes. Arrowheads point to Cre-transduced Tomato (+) cells that show reduction in Ift20 immunolabeling. DAPI marks nucleus. Scale bar indicates 10 μm. (C) Western blot of IFT20 protein from control (–Cre) or Cre-transduced (+Cre) keratinocytes. Tubulin is loading control. Histogram is quantification of bands shown above. (D) IFT20 fl/fl –Cre (control) or + Cre (Cre-transduced) keratinocytes were subject to scratch assay, and migration was monitored for 18 h. Dotted line indicates wound edge. Scale bar indicates 150 μm. (E) Quantification of migration rate in +Cre or –Cre IFT20 fl/fl cells. Data in histogram represent n = 5 independent experiments where the area of wound closure was measured after 18 h of cell migration. * indicates p = 0.03 by Student’s t test. Error bars indicate SD. A.U. indicates arbitrary units.
FIGURE 2:
FIGURE 2:
IFT20 loss results in defective mechanochemical signaling downstream of integrin engagement. (A) Western blot of pFAK Y397 protein levels from –Cre control vs. +Cre IFT20 fl/fl keratinocyte lysate. Tubulin shown as loading control. (B) Quantification of pFAK Y397 signal from bands shown in A. C) Immunolabeling for vinculin, tyrosinated tubulin, and nuclei (DAPI) in +Cre vs. –Cre IFT20 fl/fl keratinocytes. Scale bar indicates 10 μm. (D, E) Quantification of the total FA area/cell or average FA area/cell in IFT20 fl/fl keratinocytes. Histograms represent data from two independent experiments where FA size was measured in 50 or more cells in each condition. Statistical values were computed using a Mann–Whitney U test. (F) Quantification of total cell area in both –Cre and +Cre keratinocytes. Statistical value was computed using a Mann–Whitney U test.
FIGURE 3:
FIGURE 3:
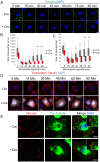
IFT20 is required for FA reformation after NZ washout and microtubule regrowth. (A) IF images of vinculin during time course of NZ washout and microtubule regrowth (min indicates minutes) in –Cre control vs. +Cre IFT20 fl/fl keratinocytes. DAPI marks nuclei. (B, C) Quantification of total FA area/cell and total FA number/cell during time course of micro­tubule regrowth in –Cre control vs. +Cre IFT20 fl/fl keratinocytes. Data in histograms represent n = 3 independent experiments where 63–127 cells were measured at each time point and each condition. *** indicates p < 5.5e-15 via Mann–Whitney U Test. (D) IF images of tyrosinated tubulin during time course of NZ washout and microtubule regrowth (min indicates minutes) in –Cre control vs. +Cre IFT20 fl/fl keratinocytes. DAPI marks nuclei. White indicates +Cre Tomato signal. Note that MT regrowth occurs normally and toward the periphery in +Cre cells. (E) IF images of –Cre control and +Cre IFT20 fl/fl keratinocytes 5 min after NZ washout. Note that microtubules target FAs during the FA disassembly process. Scale bars in both A and E denote 10 μm. Scale bar in D denotes 15 μm.
FIGURE 4:
FIGURE 4:
Surface levels of recycled β1 integrin, previously present in FAs, are decreased upon IFT20 knockout. (A) IF images of vinculin (red) and β1 integrin (green) in –Cre control vs. +Cre IFT20 fl/fl keratinocytes treated with NZ for 3–4 h or left untreated. Boxed regions are shown magnified in the corner. Merged image with DAPI (nuclei) shows colocalization of β1 integrin and vinculin IF signals. Scale bars indicate 10 μm. (B) Representative images of β1 integrin IF at various time points following NZ washout (min indicates minutes). DAPI indicates nuclei. Scale bar indicates 10 μm. (C) Quantification of β1 integrin IF at FAs at various time points following NZ washout (min) in –Cre control and +Cre IFT20 fl/fl keratinocytes. Data in histogram represent n = 60–81 cells per time point/per condition from two independent experiments. Statistical values were computed using a Mann–Whitney U test. (D) Normalized flow cytometry measurements of surface β1 integrin following NZ washout. Data are from n = 5 independent experiments with more than 5000 cells measured per condition at each time point. Error bars indicate SD. Statistical values were computed using a Student’s t test.
FIGURE 5:
FIGURE 5:
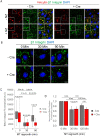
IFT20-dependent FA reformation is independent of its localization or function at the Golgi. (A, B) IF images of GM130 and Ift20 with DAPI marking nuclei of –Cre control (A) and +Cre (B) IFT20fl/fl keratinocytes during microtubule-induced FA disassembly and reformation at various time points after NZ washout (shown in minutes). Scale bars indicate 10 μm. (C) IF images of GM130 and Ift20 in control keratinocytes treated with brefeldin A (BFA) or loading control (ETOH) for 3 h. DAPI marks nuclei. Scale bar indicates 10 μm. (D) IF images of vinculin in control keratinocytes during various time points following NZ washout in the presence of BFA or loading control (ETOH) after prior pretreatment with BFA or ETOH. DAPI indicates nuclei. Scale bars indicate 10 μm. (E) Quantification of total FA area/cell in control keratinocytes during time course following NZ washout in the presence of BFA or loading control (ETOH) after prior pretreatment of cells with BFA or ETOH. Data obtained from n = 40 cells per time point per condition from two independent experiments. Statistical values were computed using a Mann–Whitney U test.
FIGURE 6:
FIGURE 6:
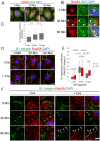
Ift20 is required to transit β1 integrin through Rab5(+) endosomes during MT-induced FA turnover. (A) IF images of Ift20 and Rab5A at indicated time points following NZ washout. Scale bar indicates 10 μm, and min indicates minutes. Boxed regions are magnified in B). (B) Magnified images of boxed regions shown in A). Scale bar indicates 5 μm, and min indicates minutes. Arrowheads indicate distinct puncta showing colocalization of Rab5 and Ift20. (C) Quantification of colocalization of Rab5 and Ift20 as measured by a colocalization coefficient. Statistical values were computed using a Mann–Whitney U test. Data represent more than 60 cells per condition obtained from two independent experiments. (D) IF micrographs of –Cre control or +Cre IFT20 fl/fl keratinocytes at various time points during FA turnover (min indicates minutes) showing the localization of β1 integrin and Rab5 endosomal compartments. Boxed regions are shown magnified in F). Scale bar indicates 10 μm. (F) Magnification of Rab5 endosomes and β1 integrin puncta. Arrows at 90 min point to colocalization of β1 integrin/Rab5 puncta in +Cre IFT20 fl/fl cKO cells. Scale bar indicates 5 μm. (E) The colocalization coefficient between Rab5 and β1 integrin was calculated at various time points of FA disassembly/MT regrowth (min indicates minutes); data in plot represents 60–81 cells from two independent experiments. P values calculated using Mann–Whitney U test.
FIGURE 7:
FIGURE 7:
IFT20 is required for the polarized migration and invasion of hair follicle–derived stem cells and their clonal contribution to wound repair. (A) Schematic of lineage tracing strategy showing the localization of K15-Cre Tomato(+) HF-SCs. (B) Schematic of strategy used for RU486 treatment and Cre induction prior to wound healing and epithelial repair (see Materials and Methods). (C) IF images of Tomato(+) signal (red) labeling the HF-SCs of the bulge (Bu) and their transiently amplifying progenitors in the hair germ (HG). (D) IF images of Ift20 in HF-SCs (red) of control (IFT20 +/fl) vs. IFT20 cKO (IFT20 fl/fl) telogen staged mouse skin. (E) Quantification of the number of ciliated HF-SCs in control (IFT20 +/fl) vs. IFT20 cKO (IFT20 fl/fl) skin. Data in histogram represent 20–30 hair follicles from n = 3 mice. (F) Scatter plot from FACS purification of CD34 (high)/α6 integrin (high)/Tomato (+) HF-SCs. (G) qPCR of IFT20 using mRNA isolated from FACS-purified HF-SCs from WT (IFT20 +/fl) vs. IFT20 cKO (IFT20 fl/fl) mouse skin. (H) Sagittal section of skin isolated from WT control (IFT20 +/fl) Rosa Tomato(+) mouse subjected to a full-thickness punch biopsy wound. IF image shows HF-SCs (red) migrating toward, and contributing to, the epidermal wound bed. Arrows indicate direction of migration, dotted line denotes dermal–epidermal border, and DAPI (blue) label nuclei. (I) Sagittal sections from control (IFT20 +/fl) or IFT20 cKO (IFT20 fl/fl) wounded epidermis demonstrating migrated HF-SCs (red), keratin 10 (K10) to label suprabasal layer (green), and DAPI-labeled nuclei. Boxed region is magnified at right in (J). (J) Examples of epidermal clones from control vs. IFT20 cKO epidermis. (K) Quantification of the number of migrated Rosa-Tomato (+) HF-SCs and their contribution to basal or suprabasal layers of the wounded epidermis. Nonwounded epidermis (hatched bars) was used as a control. Histogram represents average data from five regions surrounding a wound from n = 3 mice per condition. Error bars are SD. Statistical values were computed using a Student’s t test. L) Images of explanted skin from control (IFT20 +/fl) and IFT20 cKO (IFT20 fl/fl) mice 14 days after explant. Tomato fluorescent (red) cells are HF-SCs which have migrated outward. Scale bar is 167 μm. Dotted line demarcates border of explant. Quantification of HF-SC migration in explants is provided on the right. Data is from n = 3 independent samples for each condition. * indicates p = 0.013 by Student’s t test.

Similar articles

Cited by

References

    1. Absalon S, Blisnick T, Kohl L, Toutirais G, Dore G, Julkowska D, Tavenet A, Bastin P. (2008). Intraflagellar transport and functional analysis of genes required for flagellum formation in trypanosomes. Mol Biol Cell , 929–944. - PMC - PubMed
    1. Ansel JC, Tiesman JP, Olerud JE, Krueger JG, Krane JF, Tara DC, Shipley GD, Gilbertson D, Usui ML, Hart CE. (1993). Human keratinocytes are a major source of cutaneous platelet-derived growth factor. J Clin Invest , 671–678. - PMC - PubMed
    1. Aoki T, Nishita M, Sonoda J, Ikeda T, Kakeji Y, Minami Y. (2019). Intraflagellar transport 20 promotes collective cancer cell invasion by regulating polarized organization of Golgi-associated microtubules. Cancer Sci , 1306–1316. - PMC - PubMed
    1. Arriagada C, Silva P, Millet M, Solano L, Moraga C, Torres VA. (2019). Focal adhesion kinase-dependent activation of the early endocytic protein Rab5 is associated with cell migration. J Biol Chem , 12836–12845. - PMC - PubMed
    1. Behne MJ, Tu CL, Aronchik I, Epstein E, Bench G, Bikle DD, Pozzan T, Mauro TM. (2003). Human keratinocyte ATP2C1 localizes to the Golgi and controls Golgi Ca2+ stores. J Invest Dermatol , 688–694. - PubMed

Publication types

MeSH terms

LinkOut - more resources