

Comprehensive analysis reveals a metabolic ten-gene signature in hepatocellular carcinoma
- PMID: 32518728
- PMCID: PMC7258935
- DOI: 10.7717/peerj.9201
Comprehensive analysis reveals a metabolic ten-gene signature in hepatocellular carcinoma
Abstract
Background: Due to the complicated molecular and cellular heterogeneity in hepatocellular carcinoma (HCC), the morbidity and mortality still remains high level in the world. However, the number of novel metabolic biomarkers and prognostic models could be applied to predict the survival of HCC patients is still small. In this study, we constructed a metabolic gene signature by systematically analyzing the data from The Cancer Genome Atlas (TCGA), Gene Expression Omnibus (GEO) and International Cancer Genome Consortium (ICGC).
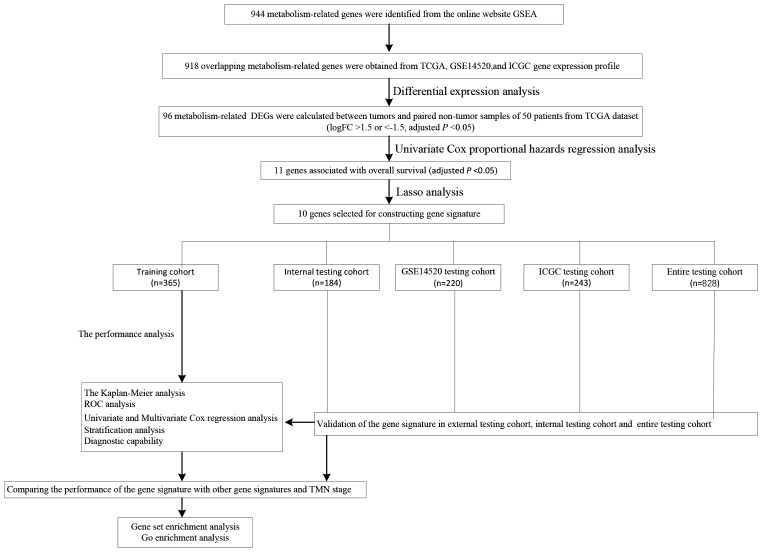
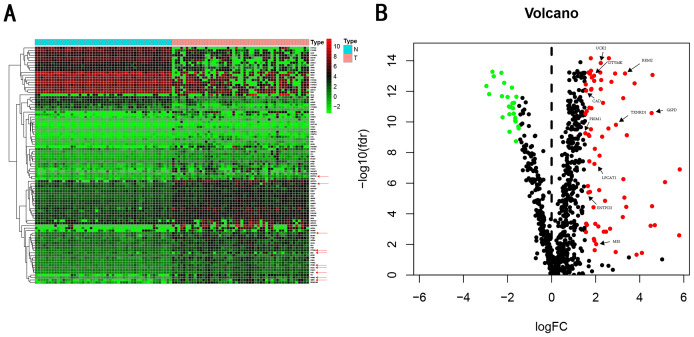
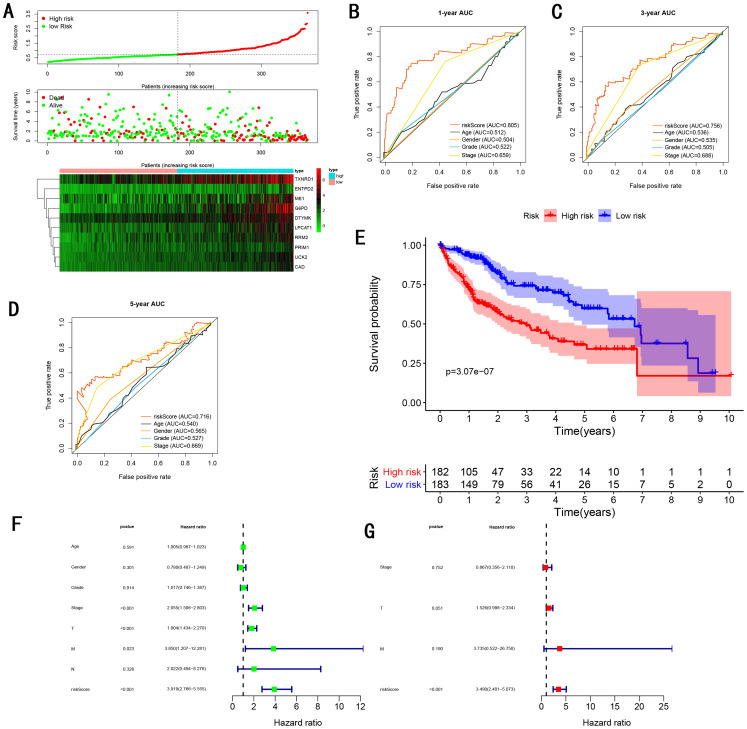
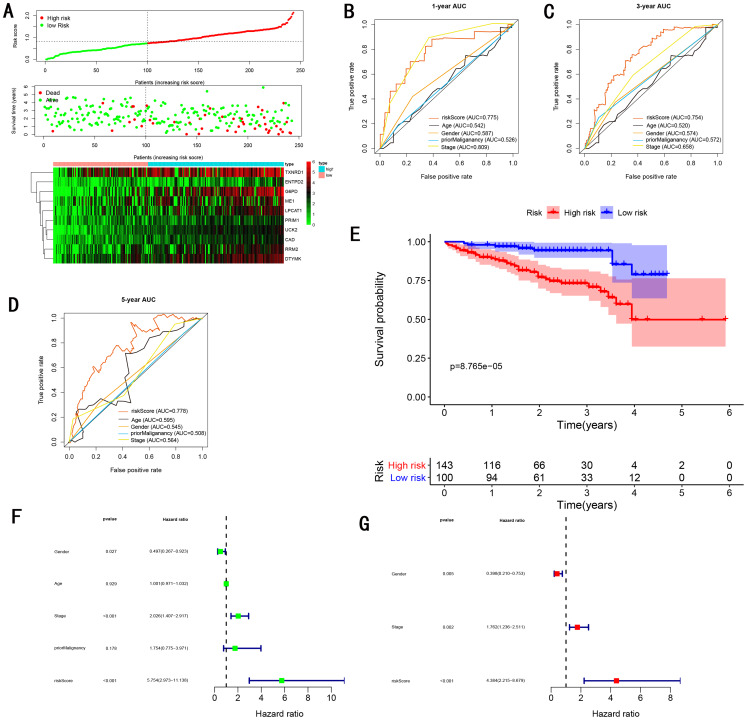
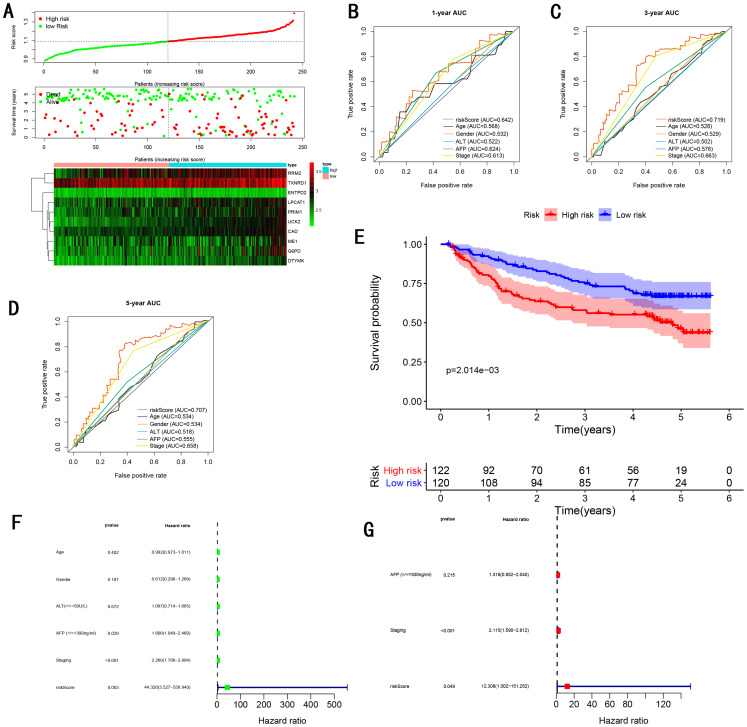
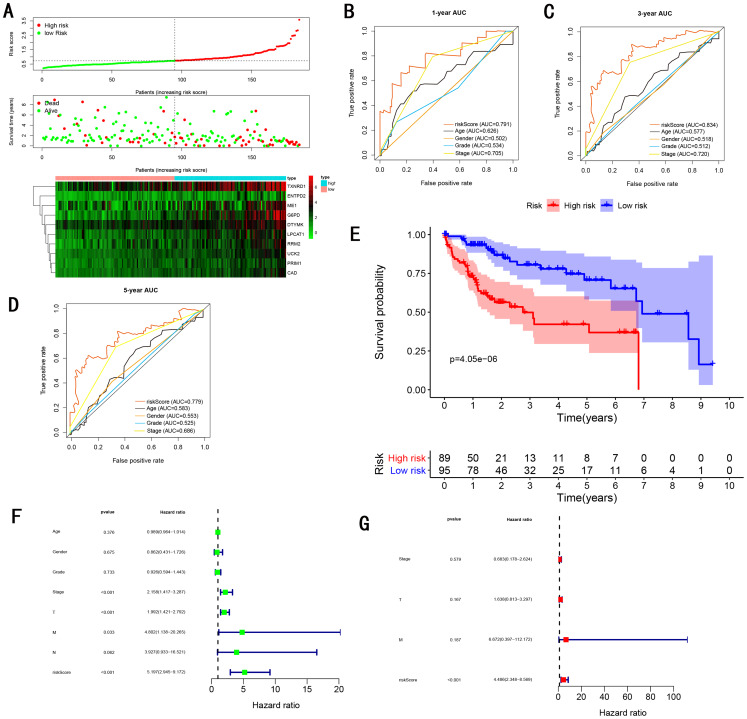
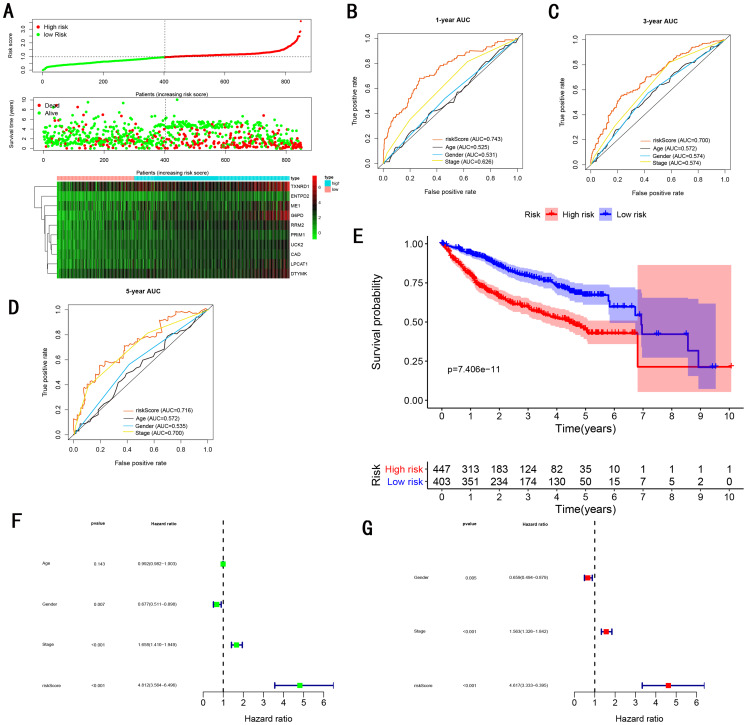
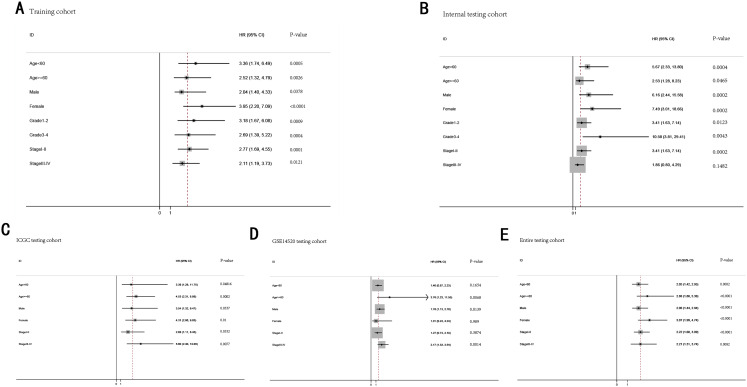
Methods: Differentially expressed genes (DEGs) between tumors and paired non-tumor samples of 50 patients from TCGA dataset were calculated for subsequent analysis. Univariate cox proportional hazard regression and LASSO analysis were performed to construct a gene signature. The Kaplan-Meier analysis, time-dependent receiver operating characteristic (ROC), Univariate and Multivariate Cox regression analysis, stratification analysis were used to assess the prognostic value of the gene signature. Furthermore, the reliability and validity were validated in four types of testing cohorts. Moreover, the diagnostic capability of the gene signature was investigated to further explore the clinical significance. Finally, Go enrichment analysis and Gene Set Enrichment Analysis (GSEA) have been performed to reveal the different biological processes and signaling pathways which were active in high risk or low risk group.
Results: Ten prognostic genes were identified and a gene signature were constructed to predict overall survival (OS). The gene signature has demonstrated an excellent ability for predicting survival prognosis. Univariate and Multivariate analysis revealed the gene signature was an independent prognostic factor. Furthermore, stratification analysis indicated the model was a clinically and statistically significant for all subgroups. Moreover, the gene signature demonstrated a high diagnostic capability in differentiating normal tissue and HCC. Finally, several significant biological processes and pathways have been identified to provide new insights into the development of HCC.
Conclusion: The study have identified ten metabolic prognostic genes and developed a prognostic gene signature to provide more powerful prognostic information and improve the survival prediction for HCC.
Keywords: Bioinformatics; Biomarker; Diagnosis; Gene signature; Hepatocellular carcinoma; Metabolism; Prognosis; Survival.
© 2020 Zhu et al.
Conflict of interest statement
The authors declare that they have no competing interests.
Figures
Similar articles
-
Identification of a six-gene signature predicting overall survival for hepatocellular carcinoma.Cancer Cell Int. 2019 May 21;19:138. doi: 10.1186/s12935-019-0858-2. eCollection 2019. Cancer Cell Int. 2019. PMID: 31139015 Free PMC article.
-
Identification of a Liver Progenitor Cell-Related Genes Signature Predicting Overall Survival for Hepatocellular Carcinoma.Technol Cancer Res Treat. 2021 Jan-Dec;20:15330338211041425. doi: 10.1177/15330338211041425. Technol Cancer Res Treat. 2021. PMID: 34866477 Free PMC article.
-
Development and validation of a robust epithelial-mesenchymal transition (EMT)-related prognostic signature for hepatocellular carcinoma.Clin Res Hepatol Gastroenterol. 2021 Sep;45(5):101587. doi: 10.1016/j.clinre.2020.101587. Epub 2021 Mar 1. Clin Res Hepatol Gastroenterol. 2021. PMID: 33662631
-
Identification and Validation of a Novel Six-Gene Expression Signature for Predicting Hepatocellular Carcinoma Prognosis.Front Immunol. 2021 Dec 1;12:723271. doi: 10.3389/fimmu.2021.723271. eCollection 2021. Front Immunol. 2021. PMID: 34925311 Free PMC article.
-
Mitochondrial-Related Transcriptome Feature Correlates with Prognosis, Vascular Invasion, Tumor Microenvironment, and Treatment Response in Hepatocellular Carcinoma.Oxid Med Cell Longev. 2022 Apr 30;2022:1592905. doi: 10.1155/2022/1592905. eCollection 2022. Oxid Med Cell Longev. 2022. PMID: 35535359 Free PMC article.
Cited by
-
Metabolic Signature-Based Subtypes May Pave Novel Ways for Low-Grade Glioma Prognosis and Therapy.Front Cell Dev Biol. 2021 Nov 23;9:755776. doi: 10.3389/fcell.2021.755776. eCollection 2021. Front Cell Dev Biol. 2021. PMID: 34888308 Free PMC article.
-
Identification of a Novel Four-Gene Signature Correlated With the Prognosis of Patients With Hepatocellular Carcinoma: A Comprehensive Analysis.Front Oncol. 2021 Mar 12;11:626654. doi: 10.3389/fonc.2021.626654. eCollection 2021. Front Oncol. 2021. PMID: 33777771 Free PMC article.
-
Development and validation of epithelial mesenchymal transition-related prognostic model for hepatocellular carcinoma.Aging (Albany NY). 2021 Apr 30;13(10):13822-13845. doi: 10.18632/aging.202976. Epub 2021 Apr 30. Aging (Albany NY). 2021. PMID: 33929972 Free PMC article.
-
Construction and validation of a metabolic risk model predicting prognosis of colon cancer.Sci Rep. 2021 Mar 25;11(1):6837. doi: 10.1038/s41598-021-86286-z. Sci Rep. 2021. PMID: 33767290 Free PMC article.
-
Risk Signature Related to Immunotherapy Reaction of Hepatocellular Carcinoma Based on the Immune-Related Genes Associated With CD8+ T Cell Infiltration.Front Mol Biosci. 2021 Mar 19;8:602227. doi: 10.3389/fmolb.2021.602227. eCollection 2021. Front Mol Biosci. 2021. PMID: 33816550 Free PMC article.
References
Grants and funding
LinkOut - more resources
Full Text Sources
