. 2020 Jun 9:9:e51735.
doi: 10.7554/eLife.51735.

Mature oligodendrocytes bordering lesions limit demyelination and favor myelin repair via heparan sulfate production

Affiliations

Mature oligodendrocytes bordering lesions limit demyelination and favor myelin repair via heparan sulfate production

Magali Macchi et al. Elife. .

Abstract

Myelin destruction is followed by resident glia activation and mobilization of endogenous progenitors (OPC) which participate in myelin repair. Here we show that in response to demyelination, mature oligodendrocytes (OLG) bordering the lesion express Ndst1, a key enzyme for heparan sulfates (HS) synthesis. Ndst1+ OLG form a belt that demarcates lesioned from intact white matter. Mice with selective inactivation of Ndst1 in the OLG lineage display increased lesion size, sustained microglia and OPC reactivity. HS production around the lesion allows Sonic hedgehog (Shh) binding and favors the local enrichment of this morphogen involved in myelin regeneration. In MS patients, Ndst1 is also found overexpressed in oligodendroglia and the number of Ndst1-expressing oligodendroglia is inversely correlated with lesion size and positively correlated with remyelination potential. Our study suggests that mature OLG surrounding demyelinated lesions are not passive witnesses but contribute to protection and regeneration by producing HS.

Keywords: Human; Ndst1; heparan sulfate; microglia; mouse; multiple sclerosis; myelin; neuroscience.


Conflict of interest statement

MM, KM, CZ, EP, BE, BB, SJ, KG, FK, AW, MC, PD No competing interests declared

Figures
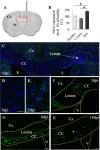
Figure 1.
Figure 1.. Ndst1 up-regulation upon LPC-induced demyelination of the corpus callosum.
(A) Scheme showing the site of LPC injection (red point) in the adult corpus callosum and the location of picture shown in C (red rectangle). (B) Ndst1 expression levels (RT-qPCR) in the corpus callosum of healthy or demyelinated mice, contralateral (contra) and ipsilateral (ipsi) to the lesion site showing the Ndst1 up-regulation in the ipsilateral side. Tissues from five mice were pooled in each condition. Error bars represent S.E.M. *p<0.05, non-parametric ANOVA followed by Kruskal-Wallis test (independent two group comparisons). (C–H) Ndst1 in situ hybridization performed at 5 (C-F, n = 4), 8 (G, n = 4) and 14 (H, n = 4) dpi illustrating the Ndst1 expression pattern at different time points of demyelination (C–F) and remyelination (G–H). (D–E) Enlarged views of the CC in (C) corresponding to contralateral side (D) and positive cells at the margin of the demyelinated area at the site of LPC injection (E). CC, corpus callosum; Cx, cortex; SVZ, sub-ventricular zone; V, ventricle (structures are delineated by brown dotted lines, lesion with white dotted lines). Scale bars: 50 µm in F, G and H; 20 µm in D, F, H; 10 µm in D and E Asterisk in G indicates the site of injection since the demyelinated lesion is no longer visible at 14 dpi.
Figure 1—figure supplement 1.
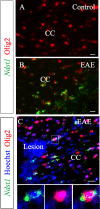
Figure 1—figure supplement 1.. Ndst1 is up-regulated by the Olig2+ cell population in close proximity to inflammation sites in corpus callosum, in the experimental autoimmune encephalomyelitis mouse model of demyelination.
Ndst1 is not expressed in control brain (A) (n = 2) while it is up-regulated by Olig2+ cells after experimental autoimmune encephalomyelitis induction (B) (n = 3) in close proximity to lesions in the corpus callosum (C). Enlarged views correspond to boxed region. CC, corpus callosum. Scale bars: 50 µm in A-B; 20 µm in C.
Figure 1—figure supplement 2.
Figure 1—figure supplement 2.. PlpGFP mice (n = 3) were used to detect demyelinated lesions (A, B, D, E).
Demyelination was clearly visible in the corpus callosum around the injection site by the lack of GFP fluorescence (B, E). Hoechst staining shows a high cell density (C, F) correlating with the loss of myelin (A, D). CC, corpus callosum, Cx, cortex, V, ventricle, St, Striatum. Scale bars: 100 µm.
Figure 2.
Figure 2.. N-sulfate-enriched microenvironment forms a belt around the demyelinated lesion.
HS (10E4) labeling on the contra- (A) and ipsi- (B–C) lateral side to the lesion illustrates the generation of a N-sulfated microenvironment surrounding the lesion (delimited by white dashed lines) at five dpi (n = 3). No immunoreactivity was found after Heparinase I treatment (D) thus validating the 10E4 antibody specificity. Scale bars: 20 µm in A, B, D; 10 µm in C. CC, corpus callosum; V, ventricle.
Figure 3.
Figure 3.. Ndst1 expressing cells around the lesion belong to the oligodendroglial lineage.
(A–B) Ndst1 in situ hybridization successively combined with Olig2 immunostaining (A) or Plp in situ hybridization (B) labeling, two OLG markers, illustrating Ndst1 up-regulation in oligodendroglia lineage cells surrounding the lesion site at five dpi (n = 3). (C–D) Representative images of Ndst1/PDGFRα (C) and Ndst1/CC1 (D) co-labeling illustrating that both OPC (C) and mature OLG (D) up-regulate Ndst1 after demyelination at five dpi (n = 4). Inserts in (A–D) illustrate boxed regions at high magnification. Scale bars: 20 µm.
Figure 4.
Figure 4.. Ndst1 inactivation in oligodendrocyte lineage cells in Olig2-Cre+/-; Ndst1 Flox/Flox mice.
(A–B) Representative images of the lesion site (delineated by white dashed lines) in the corpus callosum of control (A) (n = 2) and mutant (B) (n = 2) mice at eight dpi illustrating the enlargement of the lesion size in mutant mice compared to control mice. Olig2 (in red) is used to label oligodendrocyte lineage cells. In situ hybridization revealed a marked reduction in Ndst1 expression surrounding the lesion site in mice with conditional inactivation in the oligodendroglial lineage cells (B, D, F) compared to control mice (A, C, E). C and D are high magnifications of the squares in A and B respectively. E and F are high magnifications of the squares in C and D respectively. Representative images of 10E4 immunostaining at the lesion site (delineated by white dashed lines. 8dpi) in the corpus callosum of control (G) and mutant (H) mice showing a strong reduction of heparan sulfate labeling in absence of Ndst1 in oligodendrocytes. (I) Quantitative analysis of heparan sulfate labeling area fraction in control and Mutant conditions (n = 4 mice per condition). Error bars represent S.E.M. *p<0.05, non-parametric Mann-Whitney test (independent two group comparisons). CC, corpus callosum, V, ventricle, St, Striatum. Scale bars: 100 µm in A-; 20 µm in C-D. 30 µm in G-H. Source files of the quantitative analyses are available in the Figure 4—source data 1.
Figure 4—figure supplement 1.
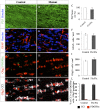
Figure 4—figure supplement 1.. Myelin content and glial density in adult unlesioned Olig2-Cre+/-; Ndst1 Flox/Flox mice.
(A–B) Representative images of the myelin content in the corpus callosum of control (A) and Olig2-Cre; Ndst1 Flox/Flox (B) mice. (C) Quantitative analysis of the myelin content by double blind scoring of PLP staining in control (n = 3) and mutant mice (n = 3). Results are expressed in percentage of the control. (D–E) Astrocyte labeling by GFAP immunofluorescence in the corpus callosum of control (D) (n = 2) and mutant (n = 3) mouse brain (E). (G–H, J–K) Phenotype of oligodendroglia in the corpus callosum of control (G, J) (n = 5) and mutant (H, K) (n = 5) mice by triple immunostaining for Olig2/PDGFRα/CC1. (F, I) Quantification of mean cell density of astrocytes (GFAP+ cells) (n = 2 and 3) (F) and oligodendroglia (Olig2+ cells) (I) in the corpus callosum of control and mutant mice (n = 5 in each group). (L) Quantitative analysis of the percentage of Olig2+/CC1+ and Olig2+/PDGFRα+ in the corpus callosum of control and mutant mice (n = 3). No significant difference was observed between the two groups using non-parametric Mann-Whitney test (independent two group comparisons). Error bars represent S.E.M. Scale bars: 10 µm. Source files of the quantitative analyses are available in the Figure 4—figure supplement 1—source data 1.
Figure 5.
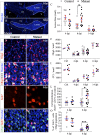
Figure 5.. Deletion of Ndst1 in Olig2+ cells affects lesion size and OPC mobilization after LPC-induced demyelination of the corpus callosum.
(A–B) Representative images of the lesion site (delineated by white dashed lines) in the corpus callosum of control (A) and mutant (B) mice at eight dpi illustrating the enlargement of the lesion size in mutant mice compared to control mice. (C) Quantitative analysis of the lesion size at 4, 8 and 14 dpi (n = 8,9,4 control and n = 9,12,6 mutant mice respectively). (D–E) Oligodendroglia labeled by Olig2 staining within the demyelinated area at eight dpi (E) compared to control mice (D). (F) Olig2 mean cell density in healthy (CTL) or demyelinated control and mutant mice at 4, 8, 14 dpi. (G–H) Mature OLG co-labeled by Olig2/CC1 within the demyelinated lesion at eight dpi in control (G) and mutant (H) mice. (I) Quantification of mean cell density of Olig2+/CC1+ cells within the demyelination lesion in healthy (CTL) or demyelinated control and mutant mice at 4, 8, 14 dpi. (J–K) Ki67+ immunolabeling shows the proliferation status of cells within the lesion 8dpi in control (J) and mutant (K) mouse. (L) Graph represents the cell proliferation (Ki67+ cells) in mutant relative to control mice at 4 and 8 dpi (n = 9,12 control and n = 8,16 mutant mice respectively). (M–N) Co-immunolabelling of Olig2 and Ki67 showing OPC proliferation in control (M) and mutant (N) mouse 8dpi. (I) Quantification of proliferating OPC (Ki67+/olig2+ cells) in lesion sites at 4 and 8 dpi (n = 6,11 control and n = 7,13 mutant mice respectively). Error bars represent S.E.M. *p<0.05, ***p<0.001, non-parametric Mann-Whitney test (independent two group comparisons). Scale bars: 50 µm in A, B, D, E and 10 µm in, G, H, J, K, M and N. Source files of quantitative analyses are available in the Figure 4—source data 1.
Figure 6.
Figure 6.. Effect of Ndst1 deletion on microglia/macrophage activation.
(A–B) CD68+/Ki67+ co-immunolabeling shows the proliferation status of activated microglia/macrophages. (C) Quantification of proliferating microglia/macrophages (Ki67+/CD68+ cells) in lesion sites at 4 and 8 dpi (n = 3,7 control and n = 3,7 mutant mice respectively). Iba1 (D–E) and CD68 immunolabeling (F–G) shows the increase in rhomboid-polarized microglia/macrophages in the demyelinated area of mutant mice at eight dpi. (H) Quantification of the ratio of rhomboid/branched CD68+ cells in lesion sites at 4 and 8 dpi (n = 3,4 control and n = 3,6 mutant mice respectively) showing a switch of the microglia/macrophage polarization in favor of the rhomboid phenotype in mutant mice at eight dpi. (I–J) Cox2 immunolabeling shows an increase in this M1 phenotype marker at 8dpi in mutant mice. (K) Quantification of Cox2+ cells in lesion sites at 8dpi (n = 4 control and n = 5 mutant mice). Error bars represent S.E.M. *p≤0.05, non-parametric Mann-Whitney test (independent two group comparisons). Scale bars: 50 µm in I-J and 10 µm in A-B, D-E, F-G. Source file of quantitative analyses are available in the Figure 5—source data 1.
Figure 7.
Figure 7.. AP-tagged Shh protein binds to HS concentrated around LPC-induced lesions in the corpus callosum.
Representative images of adjacent serial coronal sections derived from control mice 4 days after LPC injection and incubated with the fusion proteins AP-Shh-WT (A–B’) or AP-Shh-CW in which the CW sequence responsible for HS binding is absent (C–D) (n = 4). The lesion site is delineated by dashed lines. Staining using B-gal is clearly visible around the lesion after AP-Shh incubation (B–B’), while no staining is observed when the AP-Shh-CW deleted protein is used (D). These data show that Shh is concentrated around the lesion and that this distribution depends on the integrity of the HS binding motif. (E) Quantification of Ptch1 expression at 8dpi in control and mutant mice reported in number of dots per cell (n = 4 control and n = 5 mutant mice, p=0.07). (F–G) Illustration of Ptch1 expression in peri-lesional areas in control (F) and mutant (G) mice after labeling as detected by RNAscope technology. CC, corpus callosum; Cx, cortex. Scale bars: 100 µm in A-D. 10 µm in F and G. Source file of quantitative analysis is available in the Figure 6—source data 1.
Figure 8.
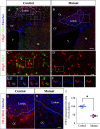
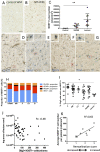
Figure 8.. NDST1 is highly expressed in MS tissue and NDST1+OLIG2+ cell density negatively correlates with lesion size.
(A–B) Representative images of NDST1 staining in control (A) and MS (B) WM. (C) Quantification of NDST1 labeling shows a significant over-expression of NDST1 in MS lesions (n = 9) compared to control tissue (n = 4) (Kruskal-Wallis test, H = 13.09, n = 4,9,9, p<0.01, means plus standard deviation). The colors represent paired samples from the same patients. (D–G) Representative images of immunostaining against NDST1 successively co-labeled with OLIG2+ for oligodendroglia (D), GFAP+ for astrocytes (E), NEUN+ for neurons (F), and IBA1+ for microglia/macrophages (G). (H) Quantification of the proportions of different NDST1+ cell types in normal appearing WM and various MS lesions shows that NDST1 expressing cells are mainly oligodendroglia. (I) The proportion of OLIG2+ cells which is NDST1+ is significantly increased in active lesions compared to control (Kruskal-Wallis test, H = 13.92, n = 7,21,4,14,14 p<0.05). Overall, the majority of OLIG2+ cells are NDST1+ in MS lesions and NAWM while this is not true in control brain tissue. (J) The number of oligodendroglia expressing NDST1 is inversely correlated to lesion size. (K) NDST1+ cell numbers positively correlate with the remyelination score assigned to each patient, summing all lesions within blocks from the same MS patients (see Materials and methods). NAWM, normal appearing white matter; RM, remyelinated lesion; A, active lesion; CA, chronic active lesion; CI, chronic inactive lesion. Scale bars represent 50 µm (A–B) or 10 µm (D–G). Source files of quantitative analyses are available in the Figure 7—source data 1.
Figure 8—figure supplement 1.
Figure 8—figure supplement 1.. Comparisons of Ndst1 expression levels in control and MS brain tissue from all nuclei (A), or just oligodendroglia (B) showing a tendency to increased levels in MS samples.
Data extracted from snRNA seq (Carrasco et al., 2005).
Figure 8—figure supplement 2.
Figure 8—figure supplement 2.. NDST1 staining is specific and no lesion belt effect is observed in human brain.
(A) Staining with NDST1 antibody in MS WM (B) There is no staining of MS WM with NDST1 antibody in in the presence of human recombinant NDST1. (C) LFB stain of MS tissue with the lesion delineated in red. (D) Representative NDST1+ staining in lesion (delineated with red line) shows uniform NDST1+ cell distribution. Scale bars: 100 µm.

Similar articles

Cited by

References

    1. Aguirre A, Dupree JL, Mangin JM, Gallo V. A functional role for EGFR signaling in Myelination and remyelination. Nature Neuroscience. 2007;10:990–1002. doi: 10.1038/nn1938. - DOI - PubMed
    1. Armstrong RC, Le TQ, Frost EE, Borke RC, Vana AC. Absence of Fibroblast Growth Factor 2 Promotes Oligodendroglial Repopulation of Demyelinated White Matter. The Journal of Neuroscience. 2002;22:8574–8585. doi: 10.1523/JNEUROSCI.22-19-08574.2002. - DOI - PMC - PubMed
    1. Bansal R, Pfeiffer SE. Regulation of oligodendrocyte differentiation by fibroblast growth factors. Advances in Experimental Medicine and Biology. 1997;429:69–77. doi: 10.1007/978-1-4757-9551-6_5. - DOI - PubMed
    1. Berezin V, Walmod PS, Filippov M, Dityatev A. Targeting of ECM molecules and their metabolizing enzymes and receptors for the treatment of CNS diseases. Progress in Brain Research. 2014;214:353–388. doi: 10.1016/B978-0-444-63486-3.00015-3. - DOI - PubMed
    1. Boyd A, Zhang H, Williams A. Insufficient OPC migration into demyelinated lesions is a cause of poor remyelination in MS and mouse models. Acta Neuropathologica. 2013;125:841–859. doi: 10.1007/s00401-013-1112-y. - DOI - PMC - PubMed

Publication types

MeSH terms