. 2020 Aug;584(7822):646-651.
doi: 10.1038/s41586-020-2357-y. Epub 2020 Jun 3.

Structures of human pannexin 1 reveal ion pathways and mechanism of gating

Affiliations

Structures of human pannexin 1 reveal ion pathways and mechanism of gating

Zheng Ruan et al. Nature. 2020 Aug.

Abstract

Pannexin 1 (PANX1) is an ATP-permeable channel with critical roles in a variety of physiological functions such as blood pressure regulation1, apoptotic cell clearance2 and human oocyte development3. Here we present several structures of human PANX1 in a heptameric assembly at resolutions of up to 2.8 angström, including an apo state, a caspase-7-cleaved state and a carbenoxolone-bound state. We reveal a gating mechanism that involves two ion-conducting pathways. Under normal cellular conditions, the intracellular entry of the wide main pore is physically plugged by the C-terminal tail. Small anions are conducted through narrow tunnels in the intracellular domain. These tunnels connect to the main pore and are gated by a long linker between the N-terminal helix and the first transmembrane helix. During apoptosis, the C-terminal tail is cleaved by caspase, allowing the release of ATP through the main pore. We identified a carbenoxolone-binding site embraced by W74 in the extracellular entrance and a role for carbenoxolone as a channel blocker. We identified a gap-junction-like structure using a glycosylation-deficient mutant, N255A. Our studies provide a solid foundation for understanding the molecular mechanisms underlying the channel gating and inhibition of PANX1 and related large-pore channels.


Figures
Extended Data Figure 1:
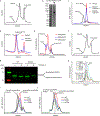
Extended Data Figure 1:. Purification and biochemical analysis of hsPANX1.
a, Size-exclusion chromatography (SEC) profile of wt-hsPANX1 purification using glyco-diosgenin (GDN). b, SDS gel of purified wt-hsPANX1-GFP (For gel source data, see Supplementary Figure 1a for gel source data). c, Fluorescence size-exclusion chromatography (FSEC) experiment on caspase 3/7 cleavage of wt-hsPANX1-GFP. GFP absorbance (480 nm) is shown in y-axis. d, Caspase 7 cleavage of purified wt-hsPANX1-GFP. The cleavage of CTT results in a peak shift. Tryptophan absorbance (280 nm) is shown in y-axis. e, Styrene maleic acid (SMA) solubilization screening of wt-hsPANX1 using FSEC. Three SMA polymers (SMA25010, SMA30010, and SMA40001) were tested. GFP absorbance (480 nm) is shown in y-axis. f, SEC profile of hsPANX1 purification using SMA30010. Tryptophan absorbance (280 nm) is shown in y-axis. g, Deglycosylation test of wt-hsPANX1-GFP and N255A-hsPANX1-GFP using PNGase F. Bands correspond to the glycosylated and non-glycosylated hsPANX1 are marked. See Supplementary Figure 1b for gel source data. h, FSEC analysis on the hsPANX1 mutations with electrophysiology data. Cells expressing hsPANX1 WT or mutants are solubilized using GDN. Gain-of-function mutations with less expression level are labeled. R75E mutant contains a peak position shifted to the right. i and j, FSEC analysis on extracellular gate mutations of hsPANX1 solubilized using GDN (i) or SMA30010 (j). Peak positions of correctly assembled hsPANX1 and incorrectly assembled hsPANX1 are indicated by arrows and vertical bars. The W74R, R75D, and R75E showed decreased stability relative to wild-type because, when extracted using detergent, they mostly ran at positions representing incorrect assemblies (i). Nevertheless, the SMA-extracted W74R, R75D, and R75E all showed peaks at positions representing correct assemblies (j), indicating that they are able to form correctly assembled channel complex in a native lipid environment.
Extended Data Figure 2:
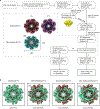
Extended Data Figure 2:. The workflow of cryo-EM data processing of hsPANX1 constructs that do not form gap junctions.
a, The data analysis pipeline for hsPANX1 cryo-EM analysis with no gap junction. Special attention was paid to determine whether the dataset indeed adheres to C7 symmetry. Two examples of hsPANX1 adopting a symmetric conformation (ΔCTT-hsPANX1) or a non-symmetric conformation (CBX-ΔCTT-hsPANX1) are shown. A detailed description of the data analysis procedure can be found in the Method section. b, The overlay of the C1 refined maps of ΔCTT-hsPANX1, CBX-ΔCTT-hsPANX1, ΔNTH/ΔCTT-hsPANX1 and CBX-ΔNTH/ΔCTT-hsPANX1 with the symmetric model of wt-hsPANX1. The CBX-ΔCTT-hsPANX1, ΔNTH/ΔCTT-hsPANX1 and CBX-ΔNTH/ΔCTT-hsPANX1 maps adopt a non-symmetric shape.
Extended Data Figure 3:
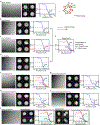
Extended Data Figure 3:. Representative micrographs, 2D class averages, and Fourier shell correlation (FSC) curves for all datasets in this study.
For each dataset, a representative micrograph, four 2D class averages and FSC curve plot are shown, except for N255A-hsPANX1 dataset, in which two structures are shown. The map resolution is determined based on the “gold-standard” 0.143 criterion. If an atomic model is available for the dataset, a model vs map FSC curve is also provided. The model vs map resolution is determined based on the 0.5 FSC criterion. Panel (a) contains a slice view of the SMA-wt-hsPANX1 map showing the organization of TMD.
Extended Data Figure 4:
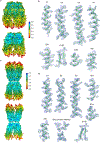
Extended Data Figure 4:. Local resolution estimation and representative densities.
a, b, wt-hsPANX1 map. c, d, The N255A-hsPANX1Gap map. To provide better visualization on the exterior and interior map quality, a non-sliced and a sliced view of the maps are shown. The unit for the color bar is in Å. The representative densities were shown for a few selected secondary structure elements of hsPANX1.
Extended Data Figure 5:
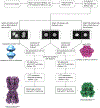
Extended Data Figure 5:. The workflow of cryo-EM data processing of N255A-hsPANX1.
To separate gap junction particles from hemichannel particles, we relied on 2D classification to distinguish tilted and side views. The top/down views were separated during 3D classification. A more detailed description of the data analysis pipeline can be found in the Methods section.
Extended Data Figure 6:
Extended Data Figure 6:. The structures of ΔNTH/ΔCTT-hsPANX1.
a, The apo state. b, In complex with CBX. The CBX is shown in orange. For both panels, odd- or even-numbered subunits are in blue or white, respectively; the 7th subunit is in green. The left and middle panels are cryo-EM maps viewed parallel to the membrane and from the extracellular side, respectively; the unsharpened map is shown as a transparent envelope. The right panels are structural models viewed from the intracellular side. c, The slice view of the extracellular entrance of ΔNTH/ΔCTT-hsPANX1 (left) and CBX-ΔNTH/ΔCTT-hsPANX1 (right) maps. The CBX molecule and the side chain of W74 are shown as stick.
Extended Data Figure 7:
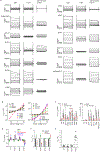
Extended Data Figure 7:. Patch-clamp analysis of the wild type hsPANX1 and its mutants.
a, Representative traces of whole-cell current density from patch-clamped tsA201 control cells (N=6) and tsA201 cells overexpressing: wt-hsPANX1 (n=12), ΔNTH (n=5), W74A (n=8), R75E (n=5), N255A (n=5), Δ21–23 (n=6), Δ21–27 (n=7), R29A (n=9), A33W (n=10), A33W/ΔCTT (n=4), ΔCTT (n=4), and A33C (n=5). Voltage steps (0.25 s) of 20 mV were imposed from −100 mV to +80 mV from a holding potential of −10 mV. Cells were first measured in standard bath solution and then re-measured following the superfusion of a bath solution containing 0.1 mM carbenoxolone. b, Mean current measured at 5 ms of experiments in (a) plotted as a function of clamp voltage. c, Current amplitudes of experiments in (a) with and without carbenoxolone. Each paired point represents an individual cell and the bar represents the mean. d, Plot of zero-current reversal potentials using a 2 s voltage ramp for various bath solutions containing either (in mM): 145 NaCl, 145 Na-Iodide, 145 Na-Gluconate, 14.5 NaCl, or 145 NMDG-Cl (see Methods for complete solutions). The number of cells patched (indicated in parenthesis) for the various bath solutions were as follows, 145 mM NaCl: WT (5), R29A (7), W74A (5), R75E (7); 145 mM NaI: WT (5), R29A (7), W74A (5), R75E (7); 145 mM Na-gluconate: WT (5), R29A (7), W74A (5), R75E (7); 14.5 NaCl mM WT (4), R29A (4), W74A (5), R75E (5); 145 mM NMDG-Cl WT (3), R29A (2), W74A (5), R75E (3). e, and f, Plots of the calculated (see methods) permeability of iodide relative to chloride, PI/PCl, the permeability of Gluconate relative to chloride, PGluconate/PCl, and permeability of sodium relative to chloride, PNa/PCl for WT and mutant channels. For statistical comparisons to WT, one-way ANOVA with Bonferroni correction was performed. The p values for the PI/PCl ratios are 0.99, 3.7×10⁻⁵, 5.9×10⁻⁵ for R29A, W74A, and R75E, respectively. The p values for the PGluconate/PCl ratios are 0.046, 0.99, 6.8×10⁻⁹ for R29A, W74A, and R75E, respectively. The p values for the PNa/PCl ratios are 0.99, 0.99, 2.2×10⁻⁶ for R29A, W74A, and R75E, respectively. Each point represents an individual cell and the bar represents the mean value. All error bars are SEM.
Extended Data Figure 8:
Extended Data Figure 8:. Comparison of large-pore channels.
a, The structures of large-pore channels, viewed parallel (upper) or perpendicular (lower) to the membrane. One subunit (or one pair of subunits) is in green. The diameter of VRAC is calculated without the cytoplasmic leucine-rich repeat domain. b, Organization of the transmembrane domain, viewed from the intracellular side. The NTH and transmembrane helices S1, S2, S3, and S4 are labeled for two subunits. Only CALHM2 has its transmembrane helices arranged in a clockwise manner. The contact between adjacent TMDs in PANX1 is made by the NTH with the S1and S2 helices in the neighboring subunit; the same contact in CALHM2 is made by the S2 and S4 of adjacent subunits, and in connexin by the S1 and S2 of adjacent subunits. There is no major contact in innexin and VRAC.
Extended Data Figure 9:
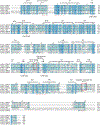
Extended Data Figure 9:. Secondary structure arrangement and sequence alignment.
Secondary structures based on the hsPANX1 structure model are labeled. The W74 forming the extracellular entry is marked with an arrow. Key residues forming the side tunnel are labeled with a red asterisk. The cysteine residues forming the extracellular disulfide bonds are highlighted by an orange dot. The N255 glycosylation site is marked with a green dot. The gap junction interface and caspase 3/7 cleavage site are indicated with a red frame. A gain-of-function disease mutation (Δ21–23) of hsPANX1 is also marked.
Figure 1:
Figure 1:. PANX1 overall architecture.
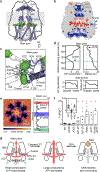
Odd- and even-numbered subunits are in blue and white, respectively; the 7th subunit is in green. a, The cryo-EM map of wt-hsPANX1 viewed parallel to the membrane. The unsharpened map is shown as a transparent envelope. Lipid-like densities and N-acetylglucosamine (NAG) densities are in yellow and red, respectively. The position of the disordered CTT is outlined by a dashed ellipse. b, The structure of wt-hsPANX1, side (left) and bottom (right) views. c, The 2D class averages in side view, and the 3D classes obtained without imposing symmetry in both side and bottom views for ΔCTT-hsPANX1 and apo-wt-hsPANX. The CTT density in the 2D averages and 3D maps are labeled. d, Whole-cell CBX-sensitive current density (+80 mV, 5 ms) from patch-clamped tsA201 cells (n=6 cells), and tsA201 cells overexpressing wt-hsPANX1(n=12) and mutants (Δ2–20, n=5; N255A, n=5; ΔCTT, n=4). Each point represents one cell and the bar represents the mean. For statistical comparisons to WT, a two-tailed unpaired Mann-Whitney test with Bonferroni correction was applied (The p values are 0.748, 0.011, and 0.013, respectively, for Δ2–20, N255A, and ΔCTT). Asterisk indicates p<0.05. e, The structure and 2D class average (side view) of N255A-hsPANX1 gap junction shown in surface representation. The docking of two hemichannels is mediated through the EL2 linker, where D256, S257, and T258 in the paired subunits form hydrophilic and hydrophobic interactions.
Figure 2:
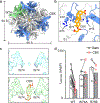
Figure 2:. CBX binding site of hsPANX1.
a, The structure of CBX-ΔCTT-hsPANX1 viewed from the intracellular side. b, The CBX binding site in the extracellular entrance. Subunits are shown alternately in blue and white. The three subunits in the front are hidden for clarity. c, The slice view of the extracellular entrance of ΔCTT-hsPANX1 and CBX-ΔCTT-hsPANX1 maps, respectively. The CBX and the side chain of W74 are shown as stick. d, Whole-cell current density (+80 mV, 5 ms) from patch-clamped tsA201 cells overexpressing wt-hsPANX1 (n=12 cells), W74A (n=8), and R75E (n=5) before and after superfusion of extracellular solution containing 0.1 mM CBX. Each paired point represents an individual cell and the bar represents the mean. CBX inhibition for each construct was evaluated using a two-tailed paired Wilcoxon test with Bonferroni correction. The p values are 0.0015, 1.00, and 0.18, respectively for WT, W74A, and R75E.
Figure 3:
Figure 3:. A single hsPANX1 subunit.
a, The disordered IH1-IH2 linker (residues 163–190) and the CTT (residues after 373) are indicated by dashed lines. b, The ECD of single subunit viewed from the extracellular side. SS stands for disulfide bond. c, Superimposition of the subunits of wt-hsPANX1 (red) and N255A-hsPANX1 (cyan) aligned by ECD.
Figure 4:
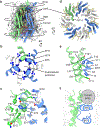
Figure 4:. Channel assembly of hsPANX1.
a, An overview of the intersubunit interfaces at the ECD, TMD and ICD using wt-hsPANX1 model. b, The intersubunit interface at the ECD, viewed from the intracellular side. The extracellular entrance is formed by W74 on the EH1 helix. c, The ECD intersubunit interface viewed parallel to the membrane. R75 forms a cation-π interaction and a salt bridge with adjacent W74 and D81, respectively; F67 is inserted in a hydrophobic pocket in the adjacent subunit. Part of the EH1 in is transparent. d, The intersubunit interface of the TMD between NTH and the adjacent S1 and S2, viewed from the intracellular side. Only the TMD helices are shown. The gap between adjacent TMDs is filled with lipids. e, The TMD interface viewed parallel to the membrane. f, The intersubunit interface at the lower part of the ICD between the IH1 and IH2 helices and the adjacent IH6 and IH7 helices. A crevice in the upper part of the ICD forms a tunnel that connects to the main pore.
Figure 5:
Figure 5:. Ion conducting pathways and channel gating.
a, An overview of the main pore (gray body) and the side tunnels (green) in wt-hsPANX1. The pore lining structural elements of are shown as cartoons. The position of the disease-causing, gain-of-function mutation in the NTH-S1 linker (Δ21–23) is highlighted by a red box. b, The interior surface of wt-hsPANX1 colored according to the electrostatic surface potential from –3 to 3 kT/e (red to blue). c, The key elements that constitute the side tunnel. IH5 is shown as a transparent tube for clarity. d, The size and electrostatic potential (EP) profiles of the main pore and side tunnel. In the upper panel, the y-axis is numbered according to PDB coordinates along z dimension; the location of the side tunnel and W74 is marked. e, MD simulation of hsPANX1. Left, density of water molecules projected using a range of 127.6–145.6 Å along the z dimension (PDB coordinates) covering the side tunnel. Right, average root mean square fluctuation (RMSF) of single hsPANX1 subunit Cα atoms from 100-ns MD trajectory. The NTH-S1 linker (red), IH1 and IH2 (blue), and IH6 and IH7 (green) showed the highest flexibility; the NTH-S1 linker gates the tunnel, whereas the IH1, IH2, IH6, and IH7 constitute the periphery of the tunnel. f, Whole-cell CBX-sensitive current density (+80 mV, 5 ms) from patch-clamped tsA201 cells overexpressing wt-hsPANX1 (n=12) and mutants A33W (n=10), A33C (n=5), Δ21–27 (n=7), Δ21–23 (n=6), R29A (n=9), ΔCTT (n=4), A33W/ΔCTT (n=4). For statistical comparisons to WT, a two-tailed Mann-Whitney test with Bonferroni correction was applied. The p values are 0.0006, 1.00, 0.011, 0.006, 0.003, 0.031, and 0.031, respectively, for A33W, A33C, Δ21–27, Δ21–23, R29A, ΔCTT, and A33W/ΔCTT. Asterisk indicates p<0.05. g, A cartoon showing the two ion pathways, and the mechanism of CBX blocking.

Similar articles

Cited by

References

Main text references

    1. Billaud M et al. A molecular signature in the pannexin1 intracellular loop confers channel activation by the α1 adrenoreceptor in smooth muscle cells. Sci. Signal. 8, (2015). - PMC - PubMed
    1. Chekeni FB et al. Pannexin 1 channels mediate ‘find-me’ signal release and membrane permeability during apoptosis. Nature 467, 863–867 (2010). - PMC - PubMed
    1. Sang Q et al. A pannexin 1 channelopathy causes human oocyte death. Sci. Transl. Med 11, (2019). - PubMed
    1. Tozaki-Saitoh H, Tsuda M & Inoue K Role of purinergic receptors in CNS function and neuroprotection. Adv. Pharmacol 61, 495–528 (2011). - PubMed
    1. Ren J & Bertrand PP Purinergic receptors and synaptic transmission in enteric neurons. Purinergic Signal. 4, 255–266 (2008). - PMC - PubMed

Additional References

    1. Goehring A et al. Screening and large-scale expression of membrane proteins in mammalian cells for structural studies. Nat. Protoc 9, 2574–2585 (2014). - PMC - PubMed
    1. Zhou Q et al. Target protease specificity of the viral serpin CrmA. Analysis of five caspases. J. Biol. Chem 272, 7797–7800 (1997). - PubMed
    1. Denault J-B & Salvesen GS Expression, purification, and characterization of caspases. Curr. Protoc. protein Sci Chapter 21, Unit 21.13 (2003). - PubMed
    1. Haley E et al. Expression and Purification of the Human Lipid-sensitive Cation Channel TRPC3 for Structural Determination by Single-particle Cryo-electron Microscopy. J. Vis. Exp (2019) doi:10.3791/58754. - DOI - PubMed
    1. Mastronarde DN Automated electron microscope tomography using robust prediction of specimen movements. J. Struct. Biol 152, 36–51 (2005). - PubMed

Publication types

MeSH terms

LinkOut - more resources