. 2020 Jun 2;11(1):2759.
doi: 10.1038/s41467-020-16491-3.

Human norovirus targets enteroendocrine epithelial cells in the small intestine

Affiliations

Human norovirus targets enteroendocrine epithelial cells in the small intestine

Kim Y Green et al. Nat Commun. .

Abstract

Human noroviruses are a major cause of diarrheal illness, but pathogenesis is poorly understood. Here, we investigate the cellular tropism of norovirus in specimens from four immunocompromised patients. Abundant norovirus antigen and RNA are detected throughout the small intestinal tract in jejunal and ileal tissue from one pediatric intestinal transplant recipient with severe gastroenteritis. Negative-sense viral RNA, a marker of active viral replication, is found predominantly in intestinal epithelial cells, with chromogranin A-positive enteroendocrine cells (EECs) identified as a permissive cell type in this patient. These findings are consistent with the detection of norovirus-positive EECs in the other three immunocompromised patients. Investigation of the signaling pathways induced in EECs that mediate communication between the gut and brain may clarify mechanisms of pathogenesis and lead to the development of in vitro model systems in which to evaluate norovirus vaccines and treatment.


Conflict of interest statement

The authors declare no competing interests.

Figures

Fig. 1
Fig. 1. Detection of norovirus in jejunal biopsy from pediatric intestinal transplant patient (GT-1).
a Chromogenic staining and brightfield imaging with monoclonal antibody TV19 directed against the viral capsid protein (VP1) showed the presence of epithelial cells with an apical distribution of capsid antigen (staining brown) oriented toward the lumen (black arrows) as well as capsid-positive cells in the lamina propria (LP) (orange arrow). b Chromogenic staining of a different section of the same jejunal biopsy illustrated the presence of intensely stained epithelial cells above GALT (black arrows) as well as VP1-positive cells within the LP around the periphery of the GALT (orange arrow). c Chromogenic staining of jejunal biopsy from a norovirus-negative intestinal transplant patient (GT-4) with the TV19 capsid-specific monoclonal antibody was included as control. d In situ hybridization (ISH) analysis of patient GT-1 jejunal biopsy to detect positive-sense viral RNA (staining red) showed distribution patterns similar to VP1 in a, with an apical orientation of viral RNA toward the intestinal lumen in epithelial cells, as well as virus-positive cells within the LP. e ISH analysis of jejunal biopsy to detect positive-sense RNA showed a distribution pattern similar to VP1 in b, with epithelial cells above the GALT and in the LP on the periphery of GALT displaying positive reactivity. f Positive-sense RNA probe hybridized with jejunal biopsy from norovirus-negative transplant patient (GT-4) as control. (Magnifications: a, b, d and e 40×; c and f 20×).
Fig. 2
Fig. 2. Positive and negative-sense norovirus RNA differ in distribution and intensity in GT-1 jejunal biopsies.
The GT-1 biopsy was analyzed by ISH with RNAscope norovirus-specific probes to detect: a–c positive strand RNA (+RNA) or d–f negative-strand RNA (-RNA). Characteristic distribution patterns of the different RNA species (red) are highlighted by white arrows and described in the text. The negative-sense RNA signal marked by the arrow in panel e was rendered in a 3D format with the Imaris Software package (Supplementary Movie 1). Cells in the epithelial layer were visualized by antibodies to detect cytokeratin (CK) (cyan) and those in the LP were represented by the detection of macrophage with marker IBA-1 (green). Nuclei are stained with DAPI (blue).
Fig. 3
Fig. 3. Association of capsid VP1 expression with positive or negative-sense viral RNA.
a Confocal microscopy imaging of VP1 (green, visualized with TV19) and positive-sense RNA (red, hybridized with positive RNAscope probe) in the GT-1 ileal biopsy. Merged and separate staining patterns for each marker are shown. Side views of the merged images show overlap of positive-sense RNA and VP1 expression (indicated by yellow arrows) in the presence or absence of DAPI staining. b Confocal microscopy imaging of VP1 (green, visualized with TV19) and negative-sense RNA (red, hybridized with negative RNAscope probe) in the GT-1 ileal biopsy. Merged and separate staining patterns for each marker are shown. The overlap between VP1 and negative-sense RNA is shown in two cross sections (yellow arrows) from proximal regions in the tissue (inset box outline colors correspond to highlighted regions in merged (b) image).
Fig. 4
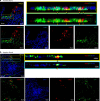
Fig. 4. Presence of norovirus negative-sense RNA in chromogranin A-positive cells.
Chromogranin A (CgA) is a protein released by neuroendocrine cells, and it has been used as a general marker for intestinal enteroendocrine cells (EECs). a Confocal imaging of the GT-1 jejunal biopsy showing CgA (green)-positive cells with and without the presence of norovirus negative-strand RNA (red) and VP1 (cyan) in the intestinal epithelium. Inset shows magnified view of the norovirus-positive EEC. b Confocal imaging and side views of an individual cell staining with CgA (green), negative-sense RNA (red) and VP1 (cyan). c GT-1 jejunal biopsy with two proximal epithelial cells bearing the presence of both CgA and negative-sense RNA. Merged and separate images of norovirus negative strand (red), CgA (cyan), and DAPI (blue) nuclei staining are shown.
Fig. 5
Fig. 5. Association of norovirus VP1 capsid protein with myeloid immune cells in the lamina propria.
Chromogenic staining and brightfield imaging were used to show the relationship between VP1 and DC-SIGN bearing cells in two areas of the GT-1 small intestine. a Villus structure showing VP1 and DC-SIGN staining merged, with heavy presence of VP1 within the LP. b Area containing GALT showing VP1 and DC-SIGN staining merged. c View near villus tip shows association of VP1 with macrophage bearing IBA-1 in the LP. Magnified inset shows extension of a macrophage dendrite appearing to engulf VP1 antigen (marked by arrows). d An area of intense VP1 expression in the epithelial layer is shown with an accumulation of underlying macrophage containing aggregated VP1. Magnified inset highlights evidence for direct interaction of IBA-1 positive cells with the epithelium as indicated by arrows. (Magnifications: a–d 40×, scale bars represent 20 μm). e Immunofluorescence imaging of a section of the jejunum hybridized with the negative-sense RNA probe (red) in the presence of macrophage marker IBA-1 (cyan). f A different field of the section shown in e was visualized by confocal imaging, and an epithelial cell expressing negative-strand RNA (red) is shown proximal to a macrophage (cyan) in the lamina propria.
Fig. 6
Fig. 6. Relationship of human norovirus to B and T lymphoid cells.
The GT-1 jejunal biopsy was probed for expression of VP1 in cells expressing various immune cell markers by chromogenic staining and brightfield imaging. a Reproduction and wider view of the identical image in Fig. 1e showing the distribution of positive-sense norovirus RNA, included here for direct comparison with panels b and c. b The region of the biopsy containing GALT and norovirus positive cells shown in a. was probed only with B cell marker CD20 (brown), and the density of B cells within the GALT can be seen. c An area in proximity to a and b was probed only with T cell marker CD3 (brown) to demonstrate the expected presence of T cells in GALT. Additional areas of the GT1 jejunal biopsy were probed for both VP1 (brown) and: d T cell marker CD3 (red). e T helper cell marker CD4 (red) and f CD103, a marker for intraepithelial lymphocytes (red). g Confocal microscopy imaging showing merged and unmerged channels to detect norovirus negative-sense RNA (white), B cells (green), and T cells (magenta) in the presence of DAPI staining (blue). Location of the norovirus target cell is indicated with orange arrow in top panel, and 3D modeling (Supplementary Movie 5) of this cell showed the absence of co-localization with T cell marker CD3 (Magnifications: a–c 20×, scale bars 50 μm; d–f 40×, scale bars 20 μM; g 20×, scale bar 30 μm).

Similar articles

Cited by

References

    1. Bok K, Green KY. Norovirus gastroenteritis in immunocompromised patients. N. Engl. J. Med. 2012;367:2126–2132. doi: 10.1056/NEJMra1207742. - DOI - PMC - PubMed
    1. Kapikian AZ. The discovery of the 27-nm Norwalk virus: an historic perspective. J. Infect. Dis. 2000;181(Suppl 2):S295–S302. doi: 10.1086/315584. - DOI - PMC - PubMed
    1. Karst SM, Zhu S, Goodfellow IG. The molecular pathology of noroviruses. J. Pathol. 2015;235:206–216. doi: 10.1002/path.4463. - DOI - PubMed
    1. Orchard RC, et al. Discovery of a proteinaceous cellular receptor for a norovirus. Science. 2016;353:933–936. doi: 10.1126/science.aaf1220. - DOI - PMC - PubMed
    1. Wobus CE, et al. Replication of Norovirus in cell culture reveals a tropism for dendritic cells and macrophages. PLoS Biol. 2004;2:e432. doi: 10.1371/journal.pbio.0020432. - DOI - PMC - PubMed

Publication types