. 2020 Jun 16;117(24):13447-13456.
doi: 10.1073/pnas.1921815117. Epub 2020 Jun 1.

TiPARP forms nuclear condensates to degrade HIF-1α and suppress tumorigenesis

Affiliations

TiPARP forms nuclear condensates to degrade HIF-1α and suppress tumorigenesis

Lu Zhang et al. Proc Natl Acad Sci U S A. .

Abstract

Precisely controlling the activation of transcription factors is crucial for physiology. After a transcription factor is activated and carries out its transcriptional activity, it also needs to be properly deactivated. Here, we report a deactivation mechanism of HIF-1 and several other oncogenic transcription factors. HIF-1 promotes the transcription of an ADP ribosyltransferase, TiPARP, which serves to deactivate HIF-1. Mechanistically, TiPARP forms distinct nuclear condensates or nuclear bodies in an ADP ribosylation-dependent manner. The TiPARP nuclear bodies recruit both HIF-1α and an E3 ubiquitin ligase HUWE1, which promotes the ubiquitination and degradation of HIF-1α. Similarly, TiPARP promotes the degradation of c-Myc and estrogen receptor. By suppressing HIF-1α and other oncogenic transcription factors, TiPARP exerts strong antitumor effects both in cell culture and in mouse xenograft models. Our work reveals TiPARP as a negative-feedback regulator for multiple oncogenic transcription factors, provides insights into the functions of protein ADP-ribosylation, and suggests activating TiPARP as an anticancer strategy.

Keywords: ADP-ribosylation; HIF-1; TiPARP; nuclear condensates; ubiquitination.


Conflict of interest statement

The authors declare no competing interest.

Figures
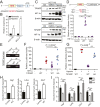
Fig. 1.
Fig. 1.
TiPARP is a direct target gene and a negative regulator of HIF. (A) A schematic representation of TiPARP promoter. Core sequence of hypoxia-response element (HRE) is highlighted in red. (B) HCT116 and MCF-7 cells were cultured at normoxia or 1% O2 (hypoxia) for 16 h. Expression of TiPARP was analyzed by qRT-PCR. Data are represented as means + SD (n = 3). (C) HCT116 and MCF-7 cells were treated with 1 mM DMOG or incubated at 1% O2 (hypoxia) for 18 h. Endogenous TiPARP and HIF-1α were analyzed by Western blot. (D) Luciferase reporter assay showing that HIF-1 binds to HRE of TiPARP. Luciferase reporter construct used in this experiment contained about 1.2-kb proximal promoter fragment of human Tiparp gene. (Top) Schematic representation of the luciferase reporter construct with WT or mutated (Mut) HRE. (Bottom) HIF-1α transactivation measured by luciferase reporter with WT or mutant HRE from TiPARP promoter. Transfection efficiencies were normalized to cotransfected Renilla-luciferase. Data are represented as means ± SD (n = 2 for the vector control and n = 4 for WT and mutant). (E) ChIP assay assessing the binding of HIF-1α to HRE in endogenous TiPARP promoter. RNA polymerase II (Pol II) was used as a positive control. (F) HIF-1 luciferase reporter activity in HEK 293T cells showing that WT TiPARP, but not inactive H532A mutant (HA), decreases HIF-1 transcriptional activity. Luciferase reporter construct used in this experiment contained three hypoxia response elements from the Pgk-1 gene. Relative luciferase activities were normalized with the cotransfected Renilla-luciferase. Data are represented as means ± SD (n = 6). (G) HIF-1 luciferase reporter activity measured in hypoxic HEK 293T cells transfected with empty vector, Flag-tagged TiPARP WT or H532A mutant. Luciferase reporter construct used in this experiment contained three HREs from the Pgk-1 gene. Data are represented as means ± SD (n = 6 for the hypoxic WT TiPARP samples and n = 3 for other samples). (H) qRT-PCR analysis of HIF-1 target gene induction in response to hypoxia, in HCT116 cells stably expressing control shRNA (Control) or shTiPARP (KD). The ratio of hypoxic to normoxic gene expression is shown. Data are represented as means + SD (n = 3). (I) HCT116 cells were treated with 1 μg/mL doxycycline for 24 h to induce the overexpression of empty vector (EV), Flag-tagged WT TiPARP, or inactive H532A mutant. Cells were then incubated at hypoxia (1% O2) for 16 h. Hypoxic induction of HIF target genes were measured by qRT-PCR. Data are represented as means + SD (n = 6). Statistical analyses were performed using unpaired two-tailed t tests. *P < 0.05; **P < 0.01; ***P < 0.001; ns, not significant.
Fig. 2.
Fig. 2.
TiPARP promotes the degradation of HIF-1α in a catalytic activity-dependent manner. (A) HEK 293T cells were transfected with empty vector (EV), Flag-tagged WT TiPARP, or the H532A mutant. Cells were treated with 1 mM DMOG to stabilized endogenous HIF-1α protein. Co-IP of Flag-TiPARP and endogenous HIF-1α was detected by Western blot. Protein levels of WT TiPARP in cell lysates were very low due to its self-promoted degradation. (B) Western blot of HIF-1α in HAP-1 WT or TiPARP KO cells after 6 and 8 h of hypoxia (1% O2) treatment. (C) Western blot of HIF-1α in HAP-1 WT or TiPARP KO cells after 6 h of 1 mM DMOG treatment followed by treatment with 50 μM cycloheximide (CHX) (Left) or 20 μM MG132 (Right). (D) HCT116 cells were treated with 1 μg/mL doxycycline for 24 h to induce the expression of empty vector, Flag-tagged TiPARP WT, or inactive H532A mutant (HA). Cells were then incubated at hypoxia (1% O2) (Top) or with DMOG (Bottom) for 6 h. The protein level of HIF-1α was analyzed by Western blot. (E) Western blot of HIF-1α in HCT116 cells expressing empty vector, Flag-tagged WT TiPARP, or H532A mutant treated with DMOG for 6 h followed by treatment with CHX (Top) or MG132 (Bottom).
Fig. 3.
Fig. 3.
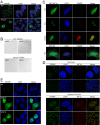
TiPARP forms nuclear foci and recruits HIF-1α. (A) HEK 293T cells were transfected with Flag-tagged WT and H532A mutant of TiPARP and analyzed by immunofluorescence microscopy with anti-FLAG antibody (green). Nuclei were stained with DAPI (blue). (B) Purified Flag-tagged WT TiPARP, but not the H532A mutant, formed droplets in the presence of 100 μM NAD+. (Scale bar, 10 μm.) (C, Top) HEK 293T cells were cotransfected with GFP-HIF-1α, as well as empty vector (EV), Flag-tagged WT, or H532A mutant TiPARP. In the Bottom, as a negative control, cells were transfected with GFP empty vector and Flag-TiPARP. (Scale bar, 5 μm.) (D) HEK 293T cells were incubated in normal condition (normoxia) (Top section) or 1% O2 (hypoxia) (Bottom section) for 18 h, followed by fixation and immunofluorescent analysis using anti-TiPARP and anti-HIF1α antibodies. (Scale bar: 2 μm for zoomed images and 10 μm for unzoomed images.) Representative images are shown. (E) HEK 293T cells were transfected with Flag-tagged WT, W347A, or W357A mutant of TiPARP and analyzed by immunofluorescence microscopy with anti-FLAG antibody (green). Nuclei were stained with DAPI (blue). The images are representative of three independent experiments. (Scale bar, 5 μm.)
Fig. 4.
Fig. 4.
TiPARP recruits E3 ubiquitin-protein ligases to degrade HIF-1α. (A) HEK 293T cells transfected with Flag-tagged WT and H532A mutant TiPARP were analyzed by immunofluorescence microscopy with anti-ubiquitin (green) and anti-FLAG (red) antibodies. Nuclei were stained with DAPI (blue). (B) HEK 293T cells cotransfected with GFP-HIF1α and empty vector, Flag-tagged WT, or H532A mutant TiPARP. HIF-1α was immunoprecipitated by anti-GFP affinity resins, and the ubiquitination of HIF-1α was analyzed by Western blot. (C) Scheme showing identification of TiPARP interacting proteins in HEK 293T cells using SILAC. (D) List of E3 ubiquitin ligases from TiPARP interactome and the heavy/light ratios (100 is the maximum in the forward SILAC, and 0.01 is the minimum heavy/light ratio in the reverse SILAC). (E) HEK 293T cells were transfected with empty vector (EV), Flag-tagged WT, or H532A mutant TiPARP overnight, followed by incubation with 10 μM MG132 for 6 h to increase the protein level of WT TiPARP. Flag-tagged TiPARP was immunoprecipitated with anti-FLAG resins, and the co-IP with endogenous HUWE1 was analyzed by Western blot. (F) Colocalization of V5-tagged HUWE1 with Flag-tagged TiPARP WT or H532A mutant in HEK 293T cells was analyzed by immunofluorescence with anti-V5 (green) and anti-FLAG (red) antibodies. (Scale bar, 5 μm.) (G) HUWE1 KD abolished the effect of TiPARP on HIF-1α in HCT116 cells. Cells expressing empty vector (EV), Flag-tagged WT, or H532A mutant (HA) TiPARP and either control or HUWE1 siRNA were incubated in hypoxia for 6 h, and the levels of HIF-1α was detected by Western blot. (H) HUWE1 KD abolished the effect of TiPARP on HIF-1α in HAP-1 cells. HAP-1 WT and TiPARP KO cells expressing control or HUWE1 siRNA were cultured in hypoxia for 6 h. Western blot analysis of cell lysate was performed with indicated antibodies. (I) HEK 293T cells were transfected with empty vector or GFP-HIF1α, followed by IP with anti-GFP affinity resins. Co-IP of GFP-HIF1α and endogenous HUWE1 E3 ubiquitin–protein ligase was detected by Western blot.
Fig. 5.
Fig. 5.
TiPARP represses Warburg effect and tumorigenesis. (A) TiPARP knockdown (KD) promoted (Left) while doxycycline (Dox)-induced TiPARP overexpression (Right) inhibited the 2D proliferation of HCT116 cells. Relative cell numbers were normalized to that of day 1. Error bars represent SD from three independent experiments. (B, Left) Anchorage-independent growth of HCT116 cells stably expressing shRNA targeting luciferase (Ctrl) or TiPARP (KD) (n = 9). (B, Right) Anchorage-independent growth of HCT116 cells treated with 1 μg/mL doxycycline to induce the overexpression of empty vector (EV), Flag-tagged WT TiPARP (WT), or inactive H532A mutant (HA) (n = 6). Colony numbers in each well of a six-well plate were counted. (C) TiPARP KD increased lactate production (n = 5) and glucose consumption (n = 6) in HCT116 cells cultured in hypoxia for 24 h. Values were normalized to normoxic controls. Data are represented as means ± SD (n = 5 for the control and n = 8 for the KD). (D) Xenograft tumor growth of HCT116 cells with (n = 22) or without (n = 18) Dox-inducible TiPARP expression. (E and F) Xenograft tumor growth of control (Ctrl) and TiPARP KD (sh1 and sh2) HCT116 cells (n = 8) (E) and MCF-7 cells (n = 9) (F). (G) Immunohistochemical analysis of CD31 expression in HCT116 xenografts. Vascular distribution in tumors was quantified by counting CD31-positive microvessels per 20× field (n = 8). (Scale bar, 200 μm.) (H) Kaplan–Meier survival curve of 3,951 (Left) and 157 (Right) breast cancer patients in TCGA, GEO, and EGA databases analyzed using miRpower and PROGgene. Patients were divided into two groups (top and bottom 50% TiPARP expression) based on TiPARP mRNA levels in their tumors. In AG, results are shown as mean ± SD. ns, not significant. *P < 0.05; **P < 0.01; ***P < 0.001.
Fig. 6.
Fig. 6.
TiPARP inhibits ERα and c-MYC. (A) HEK 293T cells were cotransfected with Flag-cMyc, as well as empty vector (EV) or GFP-TiPARP (green). c-Myc was stained with anti-FLAG (red) antibodies. (Scale bar, 5 μm.) (B) Transcriptional activity of c-Myc was measured using a luciferase reporter with c-Myc binding sites. c-Myc was cotransfected with empty vector, TiPARP WT, or H532A mutant (HA) in HEK 293T cells. Data are represented as means ± SEM (n = 6). (C) Western blot analysis of cMyc in HEK 293T cells expressing empty vector (EV), Flag-tagged WT, or H532A inactive mutant (HA) TiPARP. (D) Western blot analysis of cMyc in WT and TiPARP KO HAP-1 cells. (E) Western blot of cMyc in HCT116 cells expressing empty vector (EV), Flag-tagged WT, or H532A mutant of TiPARP and treated with or without MG132. (F) qRT-PCR analysis of TiPARP mRNA expression in MCF-7 cells treated with DMSO or 10 nM β-estradiol for 24 h. Data are represented as means + SD (n = 8). (G) Transactivation of ERα measured using a luciferase reporter containing estrogen response elements (EREs). HEK 293T cells were transfected with ERE-luciferase, Flag-TiPARP, together with HA-tagged ERα. Twelve hours after transfection, cells were treated with 1 μM β-estradiol for 24 h, followed by luciferase measurement. Data are represented as means ± SEM (n = 6). (H) HeLa cells were cotransfected with HA-tagged ERα and empty vector (EV) or Flag-TiPARP. Colocalization was analyzed by immunofluorescence with anti-HA (green) and anti-FLAG (red) antibodies. Nuclei were stained with DAPI (blue). (Scale bar, 5 μm.) (I) Western blot analysis of endogenous ERα in MCF-7 cells transfected with control or TiPARP siRNA. (J) Western blot of endogenous ERα in HCT116 cells expressing empty vector (EV), Flag-tagged WT, or H532A mutant (HA) of TiPARP.
Fig. 7.
Fig. 7.
Proposed model depicting the negative-feedback loop regulation of HIF-1α via TiPARP nuclear bodies.

Similar articles

Cited by

References

    1. Gibson B. A., Kraus W. L., New insights into the molecular and cellular functions of poly(ADP-ribose) and PARPs. Nat. Rev. Mol. Cell Biol. 13, 411–424 (2012). - PubMed
    1. Hottiger M. O., Hassa P. O., Lüscher B., Schüler H., Koch-Nolte F., Toward a unified nomenclature for mammalian ADP-ribosyltransferases. Trends Biochem. Sci. 35, 208–219 (2010). - PubMed
    1. Corda D., Di Girolamo M., Functional aspects of protein mono-ADP-ribosylation. EMBO J. 22, 1953–1958 (2003). - PMC - PubMed
    1. Bütepage M., Eckei L., Verheugd P., Lüscher B., Intracellular mono-ADP-ribosylation in signaling and disease. Cells 4, 569–595 (2015). - PMC - PubMed
    1. Corda D., Di Girolamo M., Mono-ADP-ribosylation: A tool for modulating immune response and cell signaling. Sci. STKE 2002, pe53 (2002). - PubMed

Publication types

MeSH terms

LinkOut - more resources