. 2020 Oct:40:101027.
doi: 10.1016/j.molmet.2020.101027. Epub 2020 May 30.

Mitochondrial AIF loss causes metabolic reprogramming, caspase-independent cell death blockade, embryonic lethality, and perinatal hydrocephalus

Affiliations

Mitochondrial AIF loss causes metabolic reprogramming, caspase-independent cell death blockade, embryonic lethality, and perinatal hydrocephalus

Laure Delavallée et al. Mol Metab. 2020 Oct.

Abstract

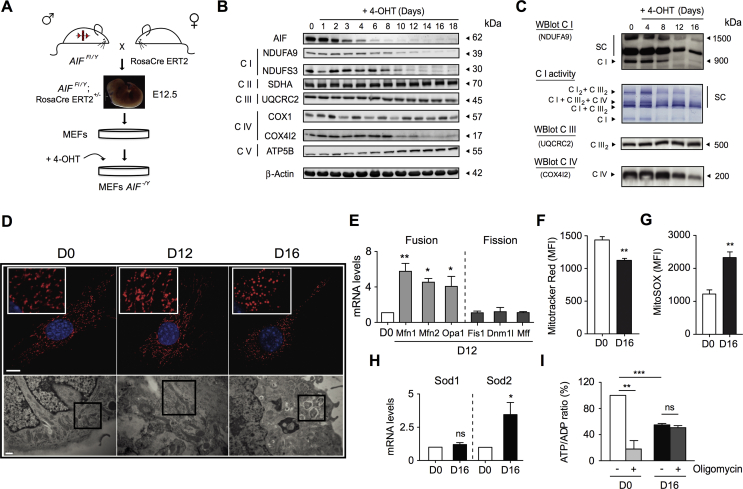
Objectives: Apoptosis-Inducing Factor (AIF) is a protein involved in mitochondrial electron transport chain assembly/stability and programmed cell death. The relevant role of this protein is underlined because mutations altering mitochondrial AIF properties result in acute pediatric mitochondriopathies and tumor metastasis. By generating an original AIF-deficient mouse strain, this study attempted to analyze, in a single paradigm, the cellular and developmental metabolic consequences of AIF loss and the subsequent oxidative phosphorylation (OXPHOS) dysfunction.

Methods: We developed a novel AIF-deficient mouse strain and assessed, using molecular and cell biology approaches, the cellular, embryonic, and adult mice phenotypic alterations. Additionally, we conducted ex vivo assays with primary and immortalized AIF knockout mouse embryonic fibroblasts (MEFs) to establish the cell death characteristics and the metabolic adaptive responses provoked by the mitochondrial electron transport chain (ETC) breakdown.

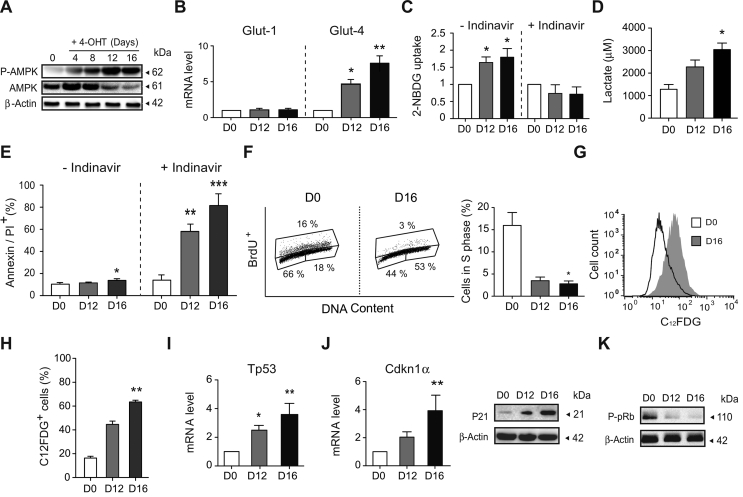
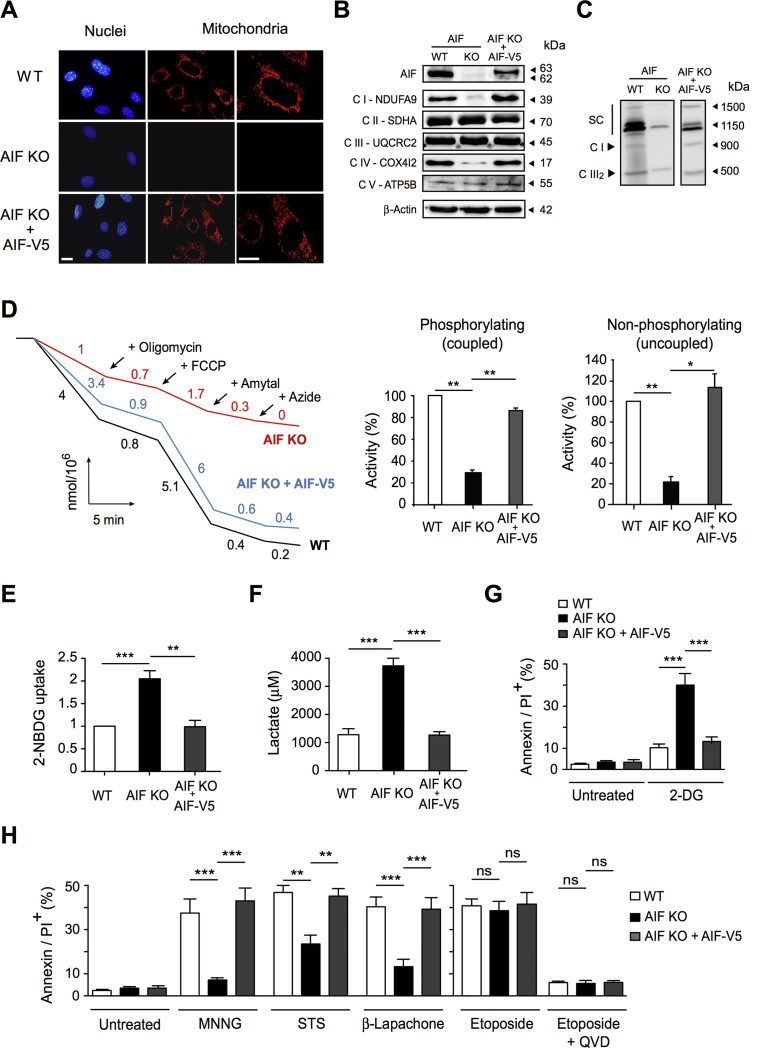
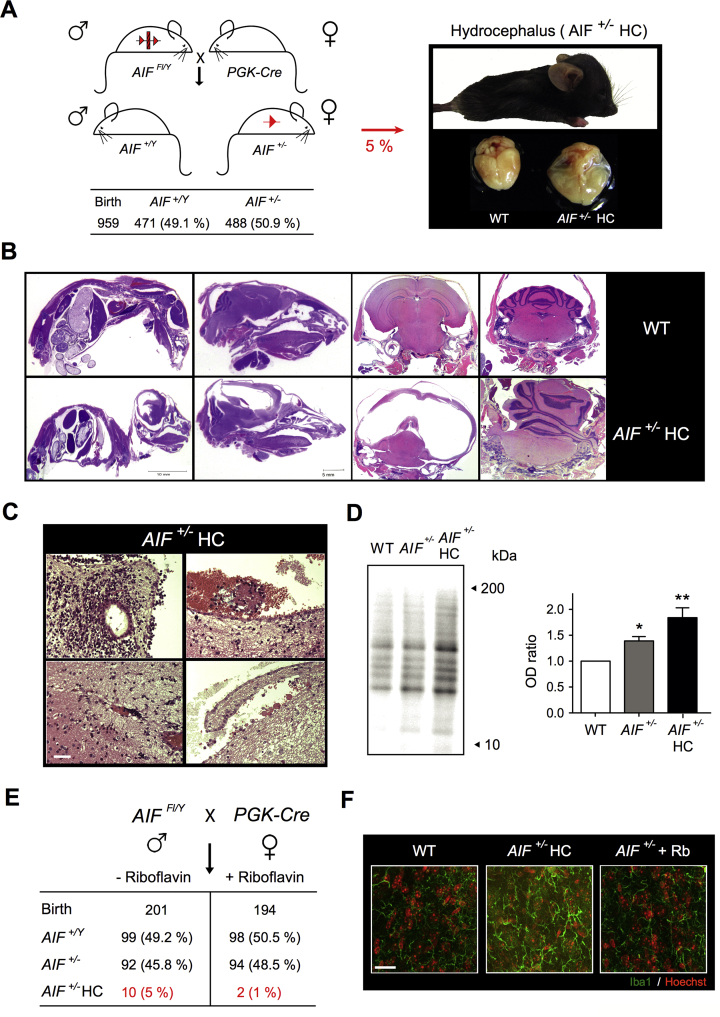
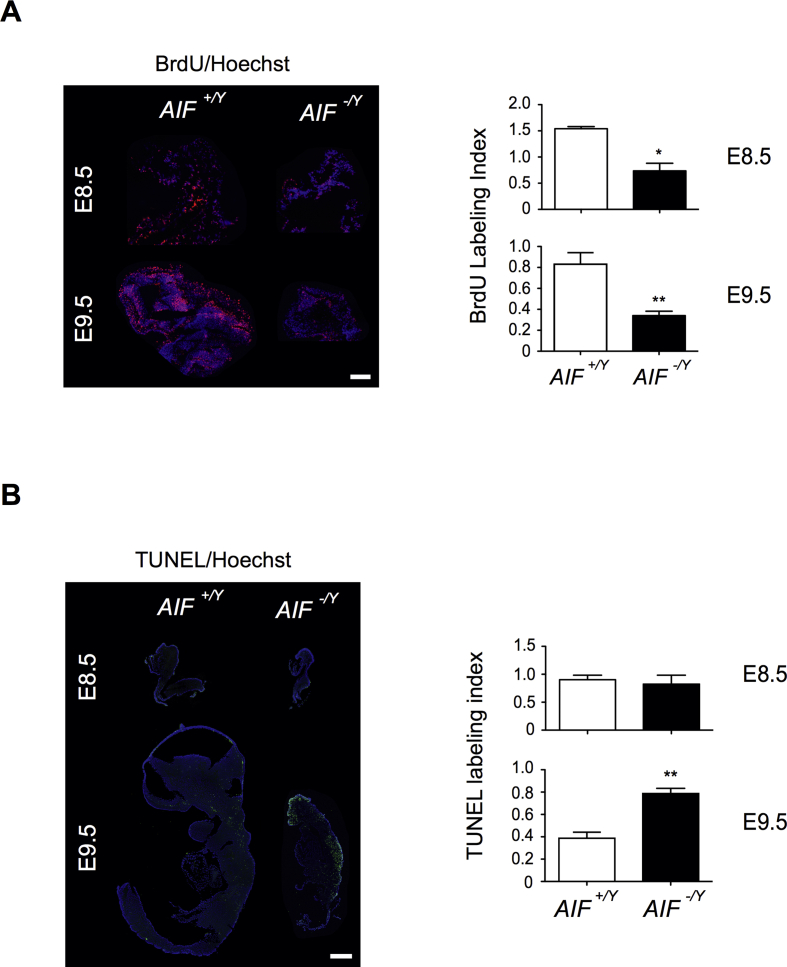
Results: AIF deficiency destabilized mitochondrial ETC and provoked supercomplex disorganization, mitochondrial transmembrane potential loss, and high generation of mitochondrial reactive oxygen species (ROS). AIF-/Y MEFs counterbalanced these OXPHOS alterations by mitochondrial network reorganization and a metabolic reprogramming toward anaerobic glycolysis illustrated by the AMPK phosphorylation at Thr172, the overexpression of the glucose transporter GLUT-4, the subsequent enhancement of glucose uptake, and the anaerobic lactate generation. A late phenotype was characterized by the activation of P53/P21-mediated senescence. Notably, approximately 2% of AIF-/Y MEFs diminished both mitochondrial mass and ROS levels and spontaneously proliferated. These cycling AIF-/Y MEFs were resistant to caspase-independent cell death inducers. The AIF-deficient mouse strain was embryonic lethal between E11.5 and E13.5 with energy loss, proliferation arrest, and increased apoptotic levels. Contrary to AIF-/Y MEFs, the AIF KO embryos were unable to reprogram their metabolism toward anaerobic glycolysis. Heterozygous AIF+/- females displayed progressive bone marrow, thymus, and spleen cellular loss. In addition, approximately 10% of AIF+/- females developed perinatal hydrocephaly characterized by brain development impairment, meningeal fibrosis, and medullar hemorrhages; those mice died 5 weeks after birth. AIF+/- with hydrocephaly exhibited loss of ciliated epithelium in the ependymal layer. This phenotype was triggered by the ROS excess. Accordingly, it was possible to diminish the occurrence of hydrocephalus AIF+/- females by supplying dams and newborns with an antioxidant in drinking water.

Conclusions: In a single knockout model and at 3 different levels (cell, embryo, and adult mice) we demonstrated that by controlling the mitochondrial OXPHOS/metabolism, AIF is a key factor regulating cell differentiation and fate. Additionally, by providing new insights into the pathological consequences of mitochondrial OXPHOS dysfunction, our new findings pave the way for novel pharmacological strategies.

Keywords: AIF; Caspase-independent cell death; Hydrocephaly; Metabolism; Mitochondria; OXPHOS.


Figures

Figure 1
Figure 1
AIF loss led to ETC dysfunction and mitochondrial network disorganization. (A) To generate AIF-/Y MEFs, we crossed the Rosa26-CreERT2 mice with the Aifm1 floxed strain [35]. Among the embryos, E12.5 AIFFl/Y; RosaCre ERT2+/− embryos were genetically identified and dissected. After MEFs generation and expansion, cells were treated overnight with tamoxifen (4-OHT; 1 μM) to induce Aifm1 exon 11 excision [35]. (B) Representative time-course immunoblot of untreated (0) or 4-OHT-treated MEFs (1–18 days post-treatment) revealing the progressive loss of AIF and key proteins of the ETC complexes I and IV. Equal loading was confirmed by β-Actin probing. This experiment was repeated three times with similar results. (C) Multiprotein complex assessment by blue native polyacrylamide gel electrophoresis (BN-PAGE) in mitochondria purified from control (0) or 4-OHT-treated MEFs (4–16 days post-addition). Up to down gel pictures: (i) Mitochondrial complex I and complex I-containing supercomplexes visualized by immunoblot (NDUFA9); (ii) Representative result of an NADH dehydrogenase complex I in-gel test revealing ETC supercomplex disorganization after AIF loss; (iii) and (iv) Complex III dimer (UQCRC2) and IV monomer (COX4I2) detected by immunoblot. This experiment was repeated five times with similar results. (D) Analysis of the mitochondrial network changes associated with AIF loss. Upper panels, representative immunofluorescence images of control (D0), and AIF-/Y MEFs (D12 and D16) labeled with Mitotracker Red (mitochondria) and Hoechst (nucleus). Bar: 100 μm. Lower panels, control (D0), and AIF-/Y MEFs (D12 and D16) analyzed by electron microscopy. Representative microphotographs are shown. Black squares underline mitochondrial features. Bar: 0.5 μm. (E) Mitofusin 1 (Mfn1), mitofusin 2 (Mfn2), mitochondrial dynamin-like GTPase (Opa1), mitochondrial fission 1 protein (Fis1), dynamin-related protein 1 (Dnm1l), and mitochondrial fission factor (Mff) mRNA levels determined by quantitative RT-PCR in control (D0) and AIF-/Y MEFs (D12; n = 4). 18S mRNA expression was used to normalize data. Results are expressed as a ratio of mRNA expression relative to control (D0) cells (set at 1.0). (F) Flow cytometry ΔΨm assessment performed by Mitotracker Red labeling in control (D0) and AIF-/Y MEFs (D16) and expressed as a plot (n = 8). Data were obtained in 10,000 cells and expressed as mean fluorescence intensity (MFI). (G) Mitochondrial ROS levels recorded in control (D0) and AIF-/Y MEFs (D16) and graphed (n = 9). Data were obtained in 10,000 cells and expressed as mean fluorescence intensity (MFI). (H) Sod1 and Sod2 mRNA levels determined by quantitative RT-PCR in control (D0) and AIF-/Y MEFs (D16; n = 5). 18S mRNA expression was used to normalize data. Results are expressed as a ratio of mRNA expression relative to control (D0) cells (set at 1.0). (I) ATP/ADP ratio recorded in control (D0) and AIF-/Y MEFs (D16) left untreated or pre-treated with oligomycin (10 μM; n = 7). Results are expressed as a ratio of ATP/ADP relative to control (D0) cells (considered as 100%). Statistical significance was calculated by Mann–Whitney (E, H) or student t (F, G, I) tests. Bars represent mean ± SEM.
Figure 2
Figure 2
Mitochondrial OXPHOS dysfunction was counterbalanced in AIF-/YMEFs by a shift towards anaerobic glycolysis and the development of a senescent phenotype. (A) Kinetic phosphorylation of AMPK visualized by immunoblot in left untreated (0) or 4-OHT-treated MEFs (4–16 days post-treatment). Equal loading was confirmed by β-Actin probing. This experiment was repeated three times with similar results. (B) Glut-1 and Glut-4 mRNA levels determined by quantitative RT-PCR in control (D0) and AIF-/Y MEFs (D12 and D16; n = 8). 18S mRNA expression was used to normalize data. Results are expressed as a ratio of mRNA expression relative to control (D0) cells (set at 1.0). (C) Glucose uptake measured by the assimilation of 2-NBDG in control (D0) and AIF-/Y MEFs (D12 and D16) untreated or pre-treated with indinavir (50 μM; n = 6). Results are expressed as a ratio relative to control (D0) cells (set at 1.0). (D) Lactate release, recorded in control (D0) and AIF-/Y MEFs (D12 and D16), was measured as described in the Methods section (n = 4). (E) Cytofluorometric assessment of cell death performed in control (D0) and AIF-/Y MEFs (D12 and D16) untreated or pre-treated with indinavir (50 μM) and labeled with AnnexinV and PI. The frequency of positive staining, which represents dying cells, was recorded and expressed as a plot (n = 6). (F) Flow cytometry cell cycle analysis performed in control (D0) and AIF-/Y MEFs (D12 and D16) by BrdU and PI (DNA content) co-labeling. Left, representative cytometric panels of control (D0) and AIF-/Y MEFs (D16). Right, the percent of cells in phase S was quantified and expressed as a plot (n = 4). (G) Cytometric evaluation of senescence in control (D0) and AIF-/Y MEFs (D12 and D16) using the β-galactosidase substrate C12FDG. Representative flow cytometric profiles of control (D0) and AIF-/Y MEFs (D16). (H) The percentage of C12FDG positive control (D0) and AIF-/Y MEFs (D12 and D16) measured as in (G) was calculated and graphed (n = 4). (I) Tp53 mRNA levels determined by qPCR in control (D0) and AIF-/Y MEFs (D12 and D16; n = 5). 18S mRNA expression was used to normalize data. Results are expressed as a ratio of mRNA expression relative to control (D0) cells (set at 1.0). (J) Left, Cdkn1α mRNA levels determined by qPCR in control (D0) and AIF-/Y MEFs (D12 and D16; n = 6). 18S mRNA expression was used to normalize data. Results are expressed as a ratio of mRNA expression relative to control (D0) cells (set at 1.0). Right, representative immunoblot of control (D0) and AIF-/Y MEFs (D12 and D16) revealing the cell cycle inhibitor P21. Equal loading was confirmed by β-Actin probing (n = 4 experiments with similar results). (K) Representative immunoblot of control (D0) and AIF-/Y MEFs (D12 and D16) revealing the decrease in pRb phosphorylation (P-pRb) associated with AIF loss. Equal loading was confirmed by β-Actin probing (n = 3 experiments with similar results). Statistical significance was calculated by Mann–Whitney (D, F, H, I) or student t (B, C, E, J) tests. Bars represent mean ± SEM.
Figure 3
Figure 3
Lentiviral transduction of AIF-/YMEFs with V5 tagged AIF-wt cDNA restored normal mitochondrial OXPHOS/metabolism and corroborated the specific role of AIF in MNNG- and β-Lapachone-mediated cell death. (A) Representative confocal images of AIF+/Y (WT), AIF-/Y (AIF KO), and AIF-/Y expressing AIF-wt MEFs (AIF KO + AIF-V5) labeled with MitoTrackerRed (mitochondria) and Hoechst (nucleus), corroborating that lentiviral transduced AIF-V5 relocalized into mitochondria and reconstituted the mitochondrial network. Bar: 100 μm. (B) Representative immunoblot of the panel of MEFs used in (A) demonstrating the presence of AIF and key proteins of the ETC complexes I to V after the lentiviral transduction of AIF-V5 into the AIF-/Y MEFs. Equal loading was confirmed by β-Actin. This experiment was repeated 5 times with similar results. (C) Mitochondrial supercomplex picturing of WT, AIF KO, and AIF KO + AIF-V5 was performed by 1D BN-PAGE, such as in Figure 1C. Mitochondrial supercomplexes and complex I were detected by NDUFA9 immunoblotting, complex III (dimer) was visualized by UQCRC2 blotting. This experiment was repeated 3 times with similar results. (D) Assessment of basal (coupled) and maximal respiration (uncoupled) in WT, AIF KO, and AIF KO + AIF-V5 MEFs by using a Clark's electrode. Basal respiration corresponds to O2 consumption rate coupled to ATP production, whereas sequential addition of 10 μM oligomycin (ATP synthase inhibitor), 15 μM fluoro-carbonyl cyanide phenylhydrazone (FCCP; uncoupling agent measuring the maximal respiration capacity), 2 mM amytal (complex I inhibitor), or 5 mM sodium azide (mitochondrial OXPHOS inhibitor) enable calculation of the maximal oxygen consumption rate. The percent of activity (relative to that measured in WT cells—considered as a 100%) in coupled and uncoupled conditions was expressed as a histogram (n = 5 independent experiments). Notably, the lentiviral transduction of AIF-V5 into the AIF KO MEFs fully restored mitochondrial respiration. (E) Glucose uptake measured by assimilation of 2-NBDG in WT, AIF KO, and AIF KO + AIF-V5 MEFs (n = 4). Results are expressed as a ratio of mRNA expression relative to control (D0) cells (set at 1.0). (F) Lactate release recorded in WT, AIF KO, and AIF KO + AIF-V5 MEFs as described in the Methods section (n = 4). (G) The panel of MEFs used in (A) to (F) were untreated or treated with 2-Deoxy-d-Glucose (2-DG; 10 mM; 24 h) and labeled with AnnexinV and PI. The frequency of positive staining, which represents dying cells, was recorded and expressed as a plot (n = 4). (H) The panel of MEFs used in (A) to (F) was untreated or treated with N-methyl-N′-nitro-N′-nitrosoguanidine (MNNG; 250 mM; 9 h), staurosporine (STS; 1 μM; 6 h), β-Lapachone (4 μM; 18 h), or etoposide (20 μM; 6 h) in the absence or presence of the broad caspase inhibitor QVD.OPh (1 μM). Next, MEFs were labeled with AnnexinV and PI, and the frequency of positive staining, which represents dying cells, was recorded and graphed (n = 6). Statistical significance was calculated by Mann–Whitney (D, E, F, G) or student t (H) tests. Bars represent mean ± SEM.
Figure 4
Figure 4
A significant percentage of AIF+/-females developed a hydrocephalus phenotype associated with developmental defaults and an excess of mitochondrial ROS. (A) To generate AIF+/- animals, we crossed Aifm1 floxed males with PGK-Cre females. The table below indicates the offspring distribution. Approximately 10% of AIF+/- females developed a hydrocephalus (HC) phenotype. Photographs depict the phenotype of a 2.5-week-old AIF+/- HC female and a HC brain compared to a WT brain. Note the swelling of the cranial cavity of the mice and the excess of cerebrospinal fluid (CSF) that warps the HC brain. (B) Representative hematoxylin/eosin (HE)-labeled sections of 2.5-week-old WT and AIF+/- HC females showing (left to right) sagittal sections (entire mice and head) and coronal sections (brain and cerebellum). Note the extension of the hydrocephaly, the brain compression exerted by the CSF excess, and the herniated cerebellum in the AIF+/- HC. (C) HE stained brain sections from 2.5-week-old AIF+/- HC animals showing spinal and parenchymatous hemorrhages and loss and defects of ciliation in the ependymal epithelium. Bar: 50 μm. (D) Oxidative modification of proteins assessed by carbonylation immunoblot on brain homogenates from 2.5-week-old WT, AIF+/-, and AIF+/- HC mice. This experiment was repeated 3 times with similar results. The OD ratio depicted in the graph illustrates the levels of protein carbonylation of the different phenotypes. Results are expressed as a ratio of OD relative to WT cells (set at 1.0). (E) PGK-Cre dams were supplied or not with riboflavin in drinking water (5 mg/L) and the number and genotype/phenotype of the progeny were assessed and reported in a table. (F) Characteristic immunofluorescence images of brains from 2.5-week-old WT, AIF+/- HC, and AIF+/- mice supplied with riboflavin (AIF+/- + Rb), showing the microglial (Iba1 labeling) status. Individual cells were visualized by Hoechst (nuclear) co-staining. Bar: 200 μm. Statistical significance in (D) was calculated by a Mann–Whitney test. Bars represent mean ± SEM.
Figure 5
Figure 5
Mitochondrial AIF deficiency-induced murine embryonic lethality linked to OXPHOS deficiency and energy loss. (A) To generate AIF KO mice, we crossed AIF+/- females with C57BL/6 WT males. After genetic identification, the result of the crossing (progeny and E8.5 to E13.5 embryos) was reported in a table. (B) Light microscope images of E7.5 to E9.5 AIF+/Y and AIF-/Y embryos illustrating the progressive growth delay of the AIF KO embryos. Bar: 500 μm. (C) Hematoxylin/eosin staining performed on the sagittal sections of E8.5 and E9.5 AIF+/Y and AIF-/Y embryos, underlining the morphology and the abnormal nervous development of the AIF KO embryos. Bar: 500 μm. (D) Electron microscopy picturing mitochondria of E9.5 AIF+/Y and AIF-/Y embryos. Representative microphotographs are shown. Arrowheads in the picture mark the mitochondria. White squares show characteristic mitochondria. Bar: 0.5 μm. (E) Immunoblot of AIF and key proteins of the ETC complexes I to V performed in whole protein extracts from E9.5 AIF+/Y and AIF-/Y embryos. Equal loading was confirmed by β-Actin probing. This experiment was repeated 4 times with similar results. (F) Representative results of the histochemical assessment of mitochondrial OXPHOS activity in E9.5 AIF+/Y and AIF-/Y embryos using cytochrome c oxidase/succinate dehydrogenase (COX/SDH) double labeling. Bar: 50 μm. Whereas OXPHOS activity is normal in AIF+/Y embryos, as demonstrated by the brown color of the section, AIF-/Y showed defective OXPHOS activity (absence of brown staining). This experiment was repeated 3 times with similar results. (G) Total ATP levels recorded, as described in the Methods section, in E9.5 AIF+/Y and AIF-/Y embryos (n = 6). Results are expressed as RLU (relative light units). (H) Lactate release measured, as described in the Methods section, in E9.5 AIF+/Y and AIF-/Y embryos (n = 6). Statistical significance in (G) and (H) was calculated by the student t test. Bars represent mean ± SEM.
Figure 6
Figure 6
Embryonic AIF loss triggered the arrest of proliferation and enhancement of cellular apoptotic levels. (A) BrdU immunofluorescence analysis of a frozen section of AIF+/Y and AIF-/Y embryos at E8.5 and E9.5. Photographs of the head of a representative embryo. Bar: 500 μm. The BrdU labeling index was calculated as the ratio of BrdU/Hoechst fluorescence measured in a fixed surface. Data in the histogram represent mean ± SEM (n = ratio obtained in at least 5 different surfaces of 3 independent embryonic sections). (B) TUNEL staining of a PFA fixed cryosection of AIF+/Y and AIF-/Y embryos at E8.5 and E9.5. Bar: 500 μm. The TUNEL labeling index was obtained as the ratio of TUNEL/Hoechst fluorescence measured in a fixed surface. Data in the histogram represent mean ± SEM (n = ratio obtained in at least 5 different surfaces of 3 independent embryonic sections). Statistical significance in (A) and (B) was calculated by the student t test. Bars represent mean ± SEM.

Similar articles

Cited by

References

    1. MacIver N.J., Michalek R.D., Rathmell J.C. Metabolic regulation of T lymphocytes. Annual Review of Immunology. 2013;31:259–283. - PMC - PubMed
    1. Pearce E.L., Poffenberger M.C., Chang C.H., Jones R.G. Fueling immunity: insights into metabolism and lymphocyte function. Science. 2013;342(6155):1242454. - PubMed
    1. Holmstrom K.M., Finkel T. Cellular mechanisms and physiological consequences of redox-dependent signalling. Nature Reviews Molecular Cell Biology. 2014;15(6):411–421. - PubMed
    1. Pearce E.L., Pearce E.J. Metabolic pathways in immune cell activation and quiescence. Immunity. 2013;38(4):633–643. - PMC - PubMed
    1. Folmes C.D., Dzeja P.P., Nelson T.J., Terzic A. Metabolic plasticity in stem cell homeostasis and differentiation. Cell Stem Cell. 2012;11(5):596–606. - PMC - PubMed

Publication types

MeSH terms