. 2020 Aug:178:114056.
doi: 10.1016/j.bcp.2020.114056. Epub 2020 May 26.

Rapamycin treatment correlates changes in primary cilia expression with cell cycle regulation in epithelial cells

Affiliations

Rapamycin treatment correlates changes in primary cilia expression with cell cycle regulation in epithelial cells

Maha H Jamal et al. Biochem Pharmacol. 2020 Aug.

Abstract

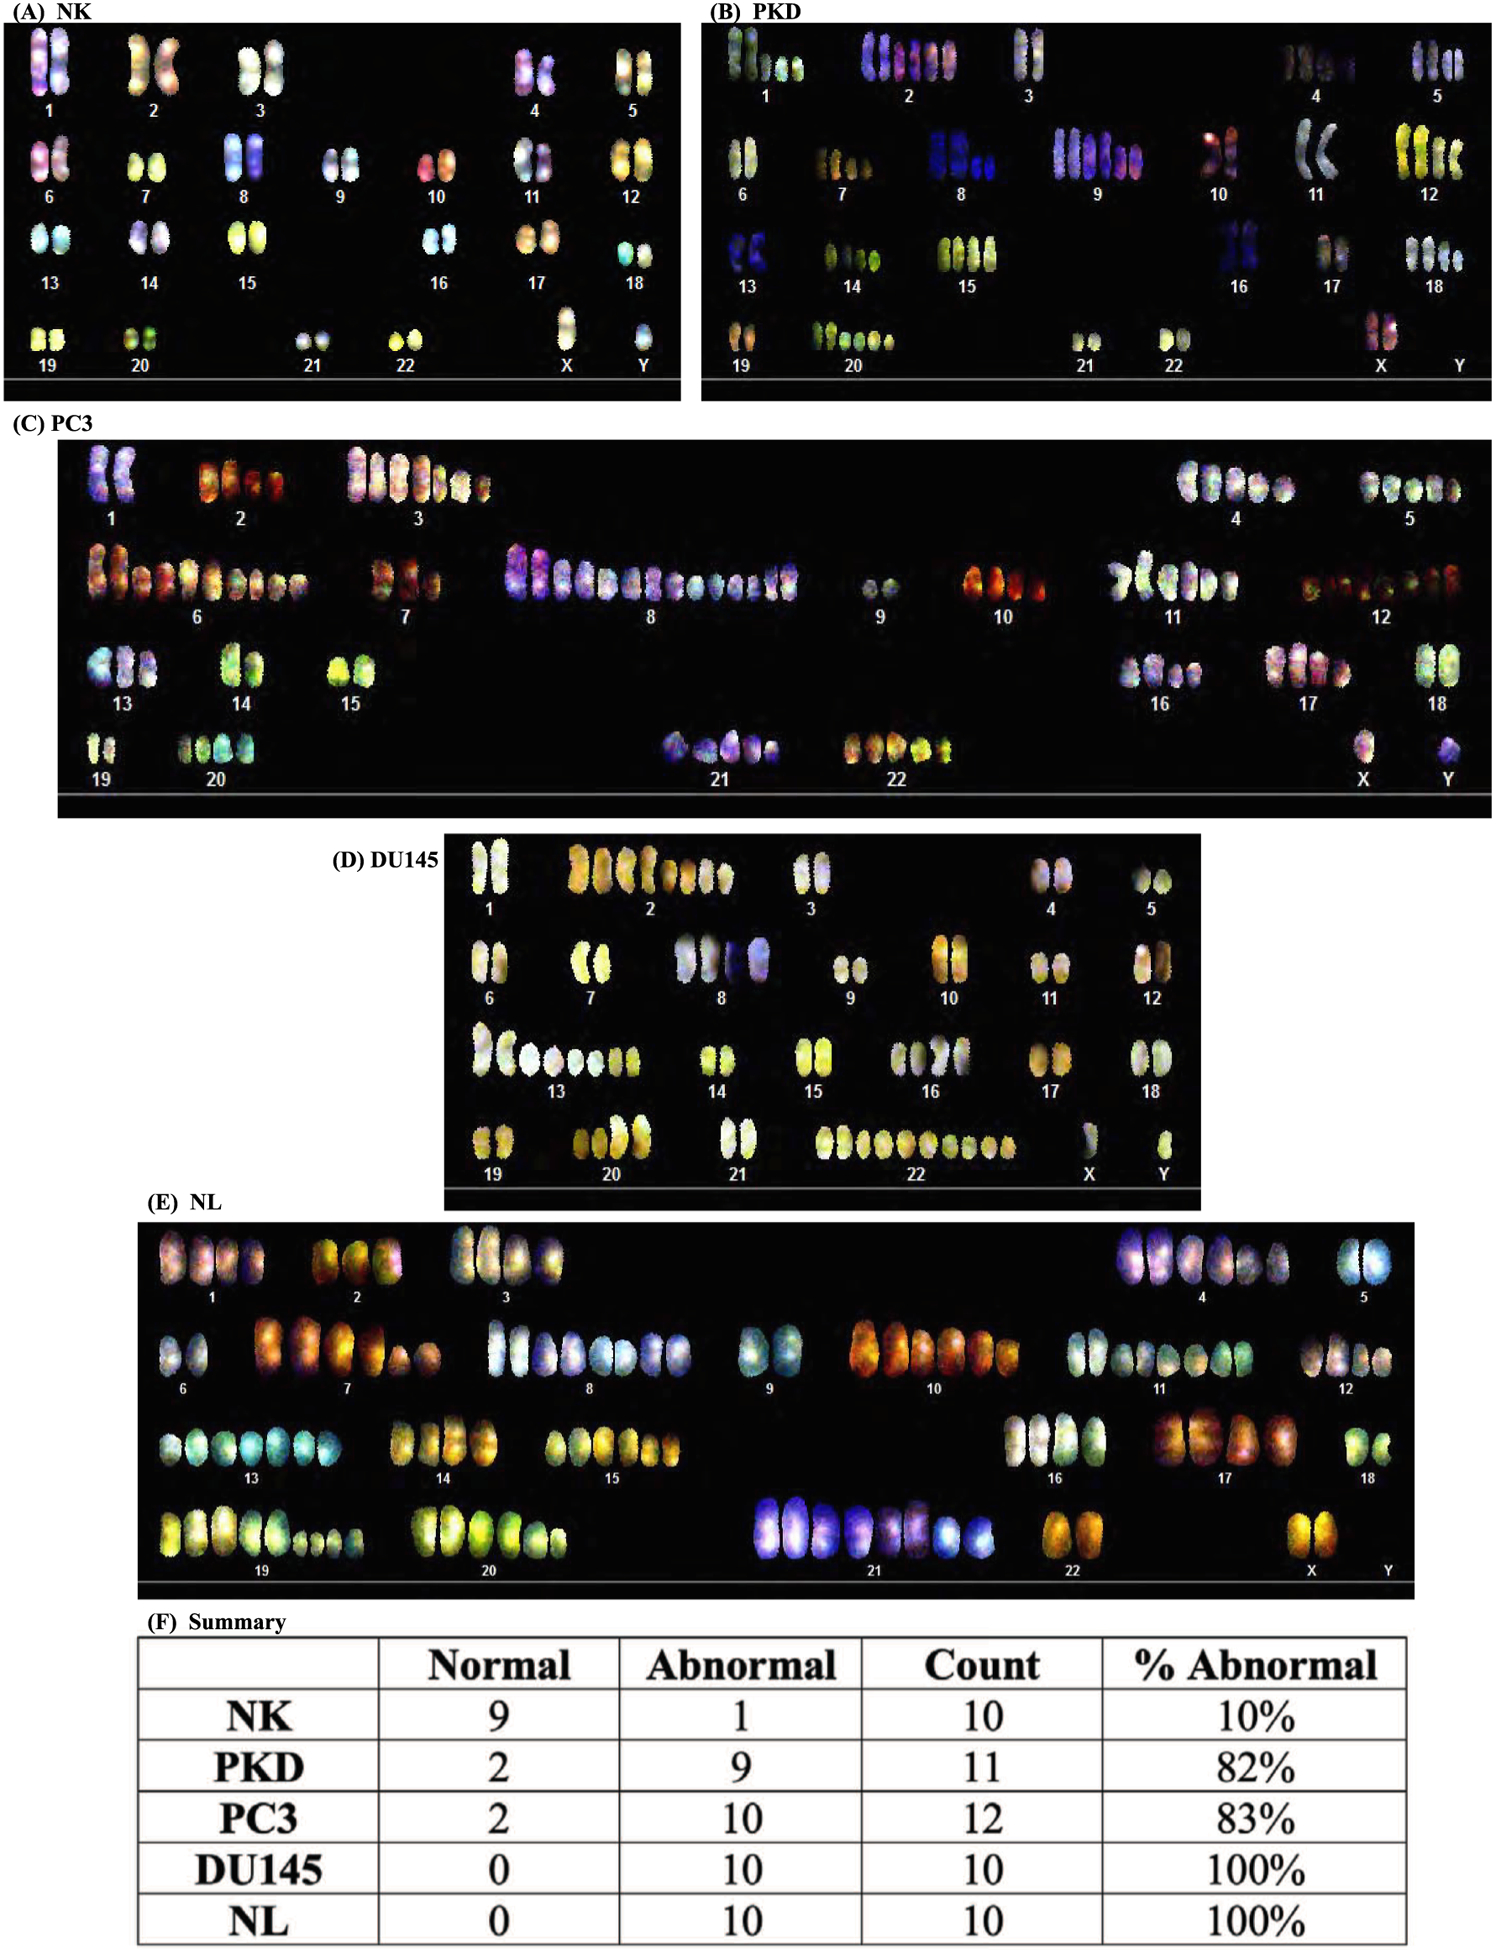
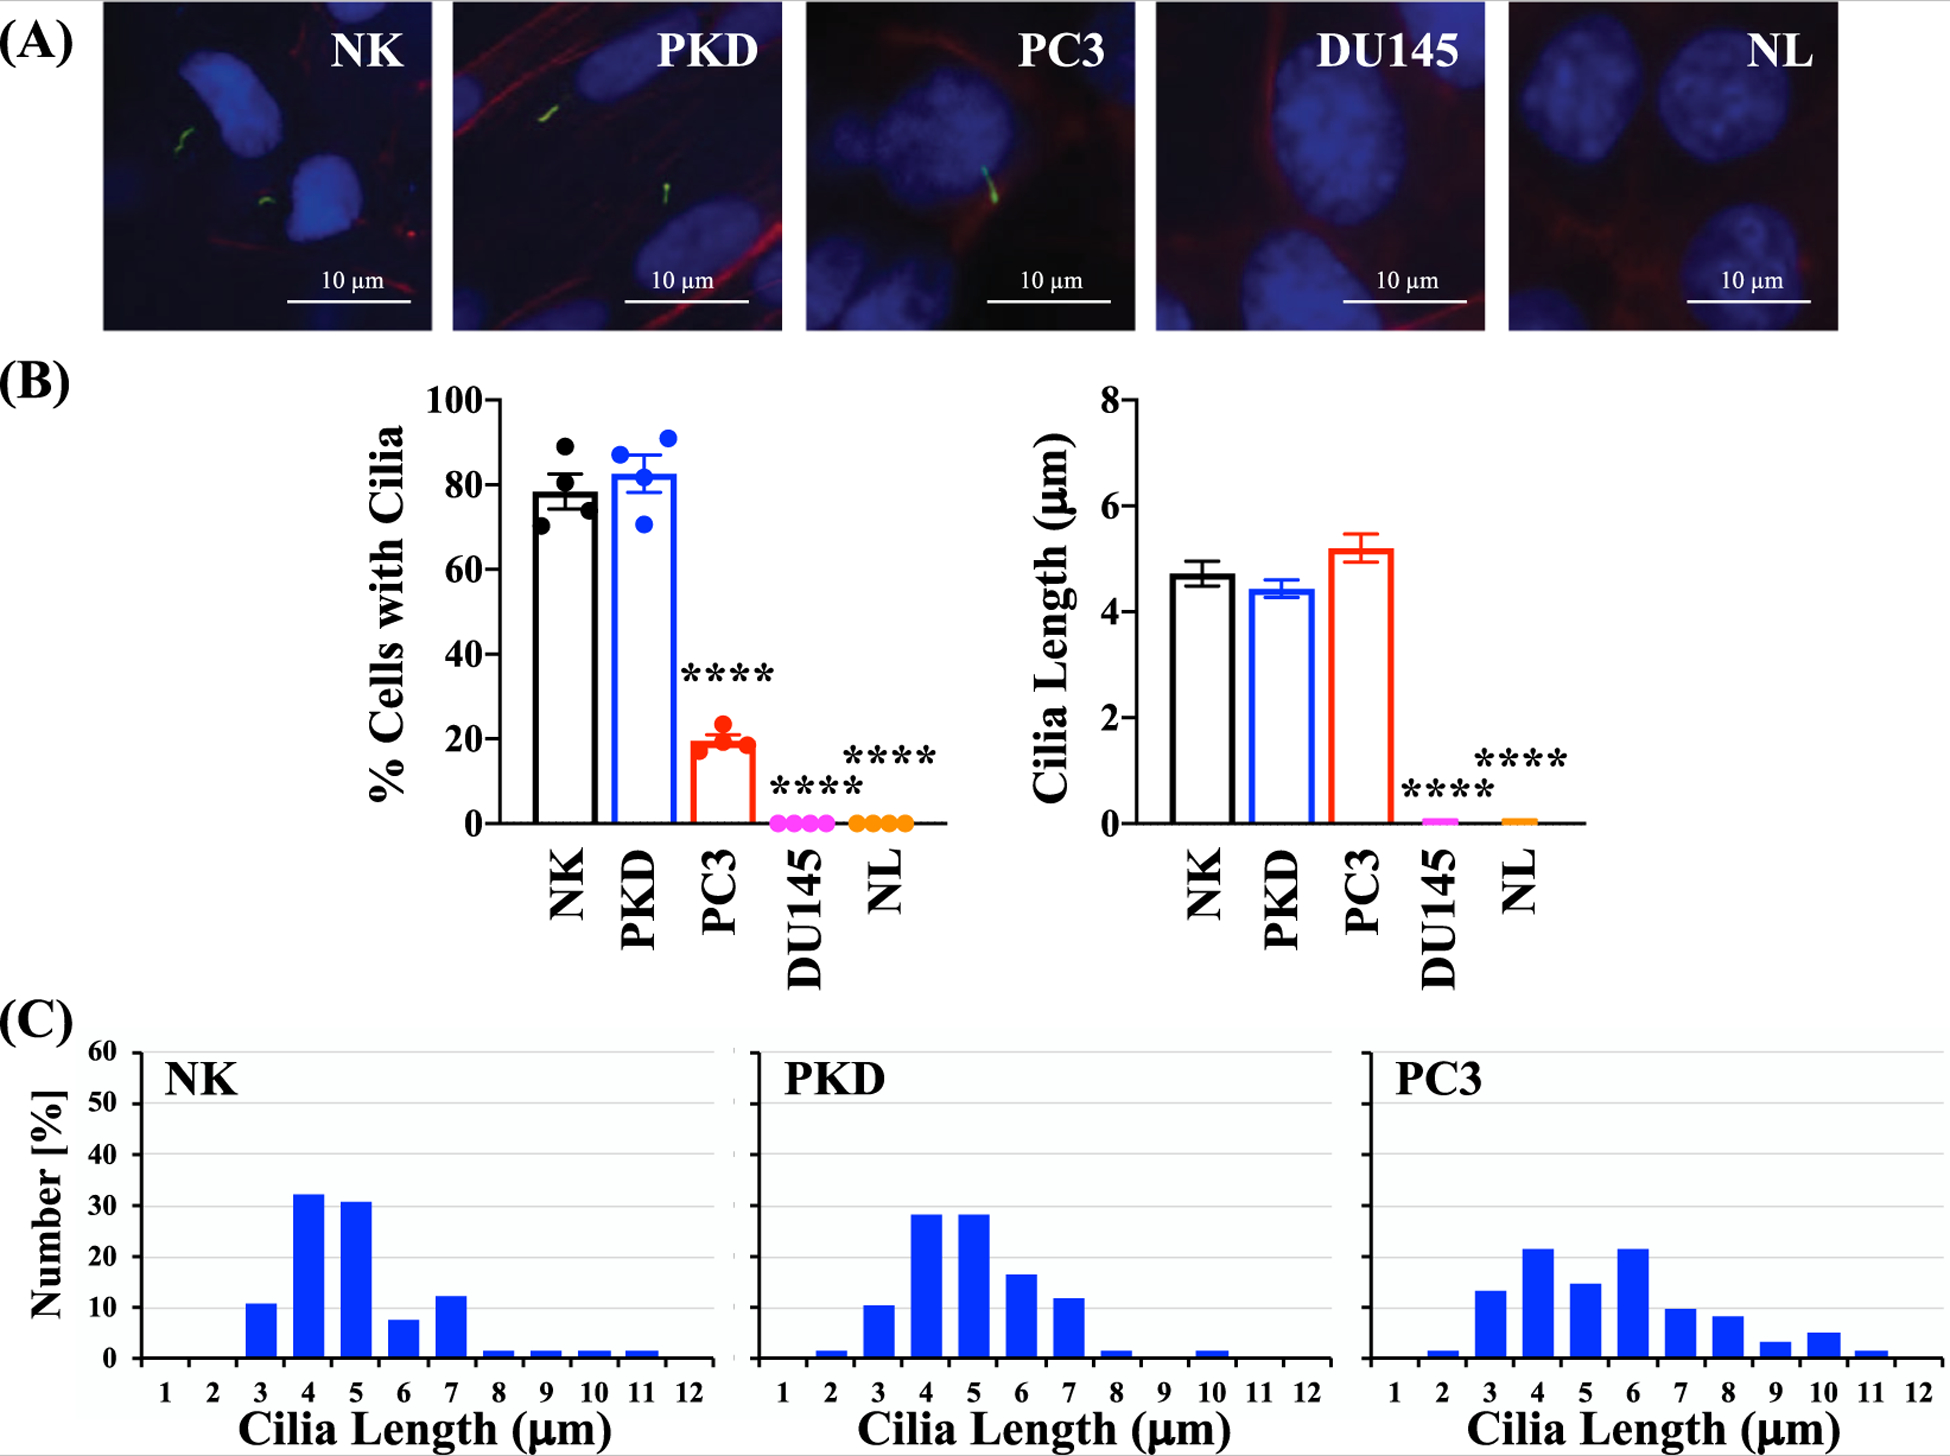
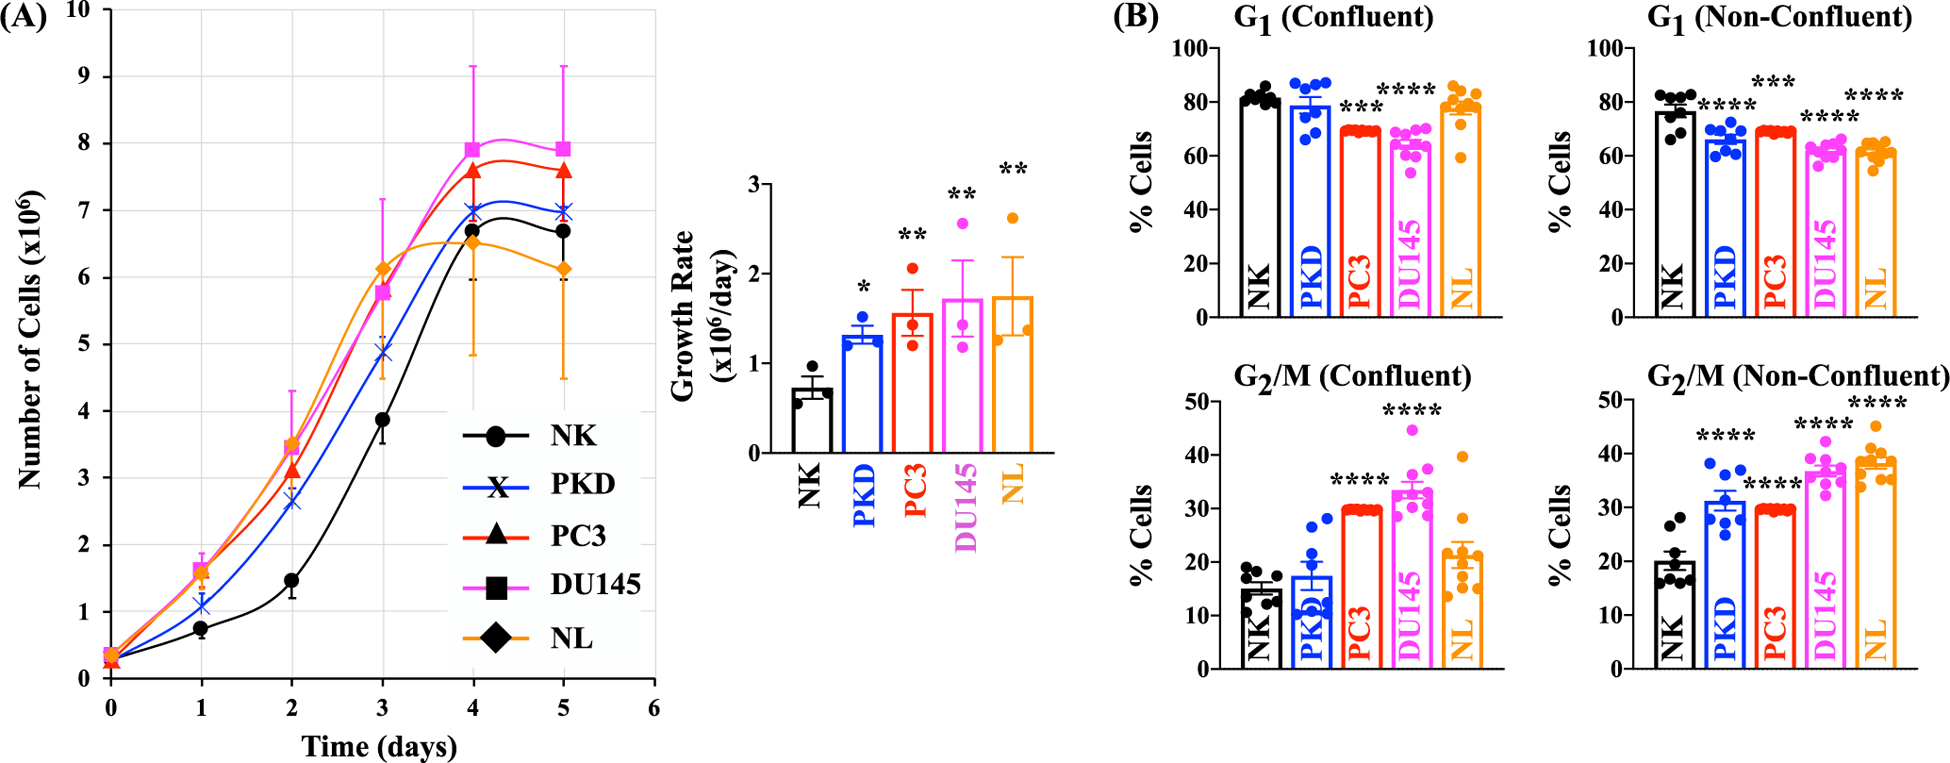
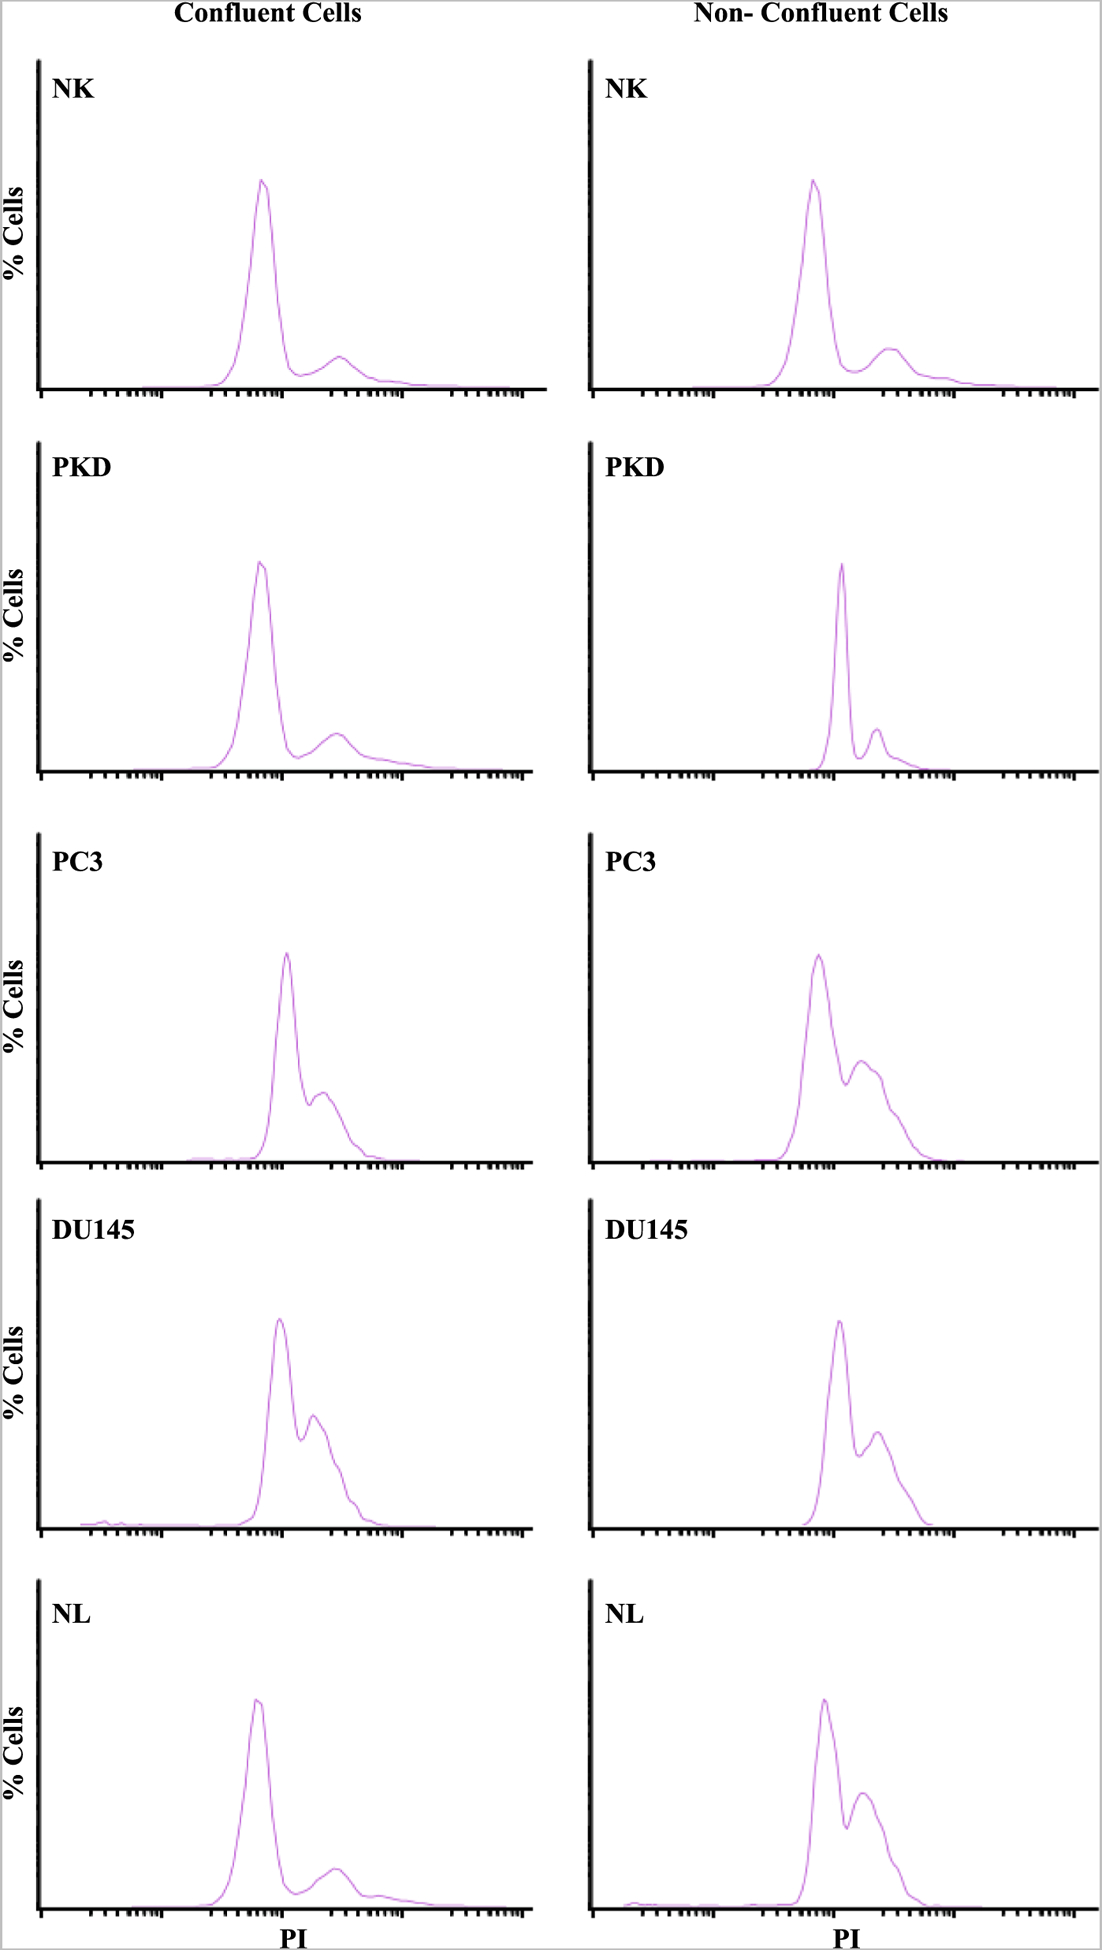
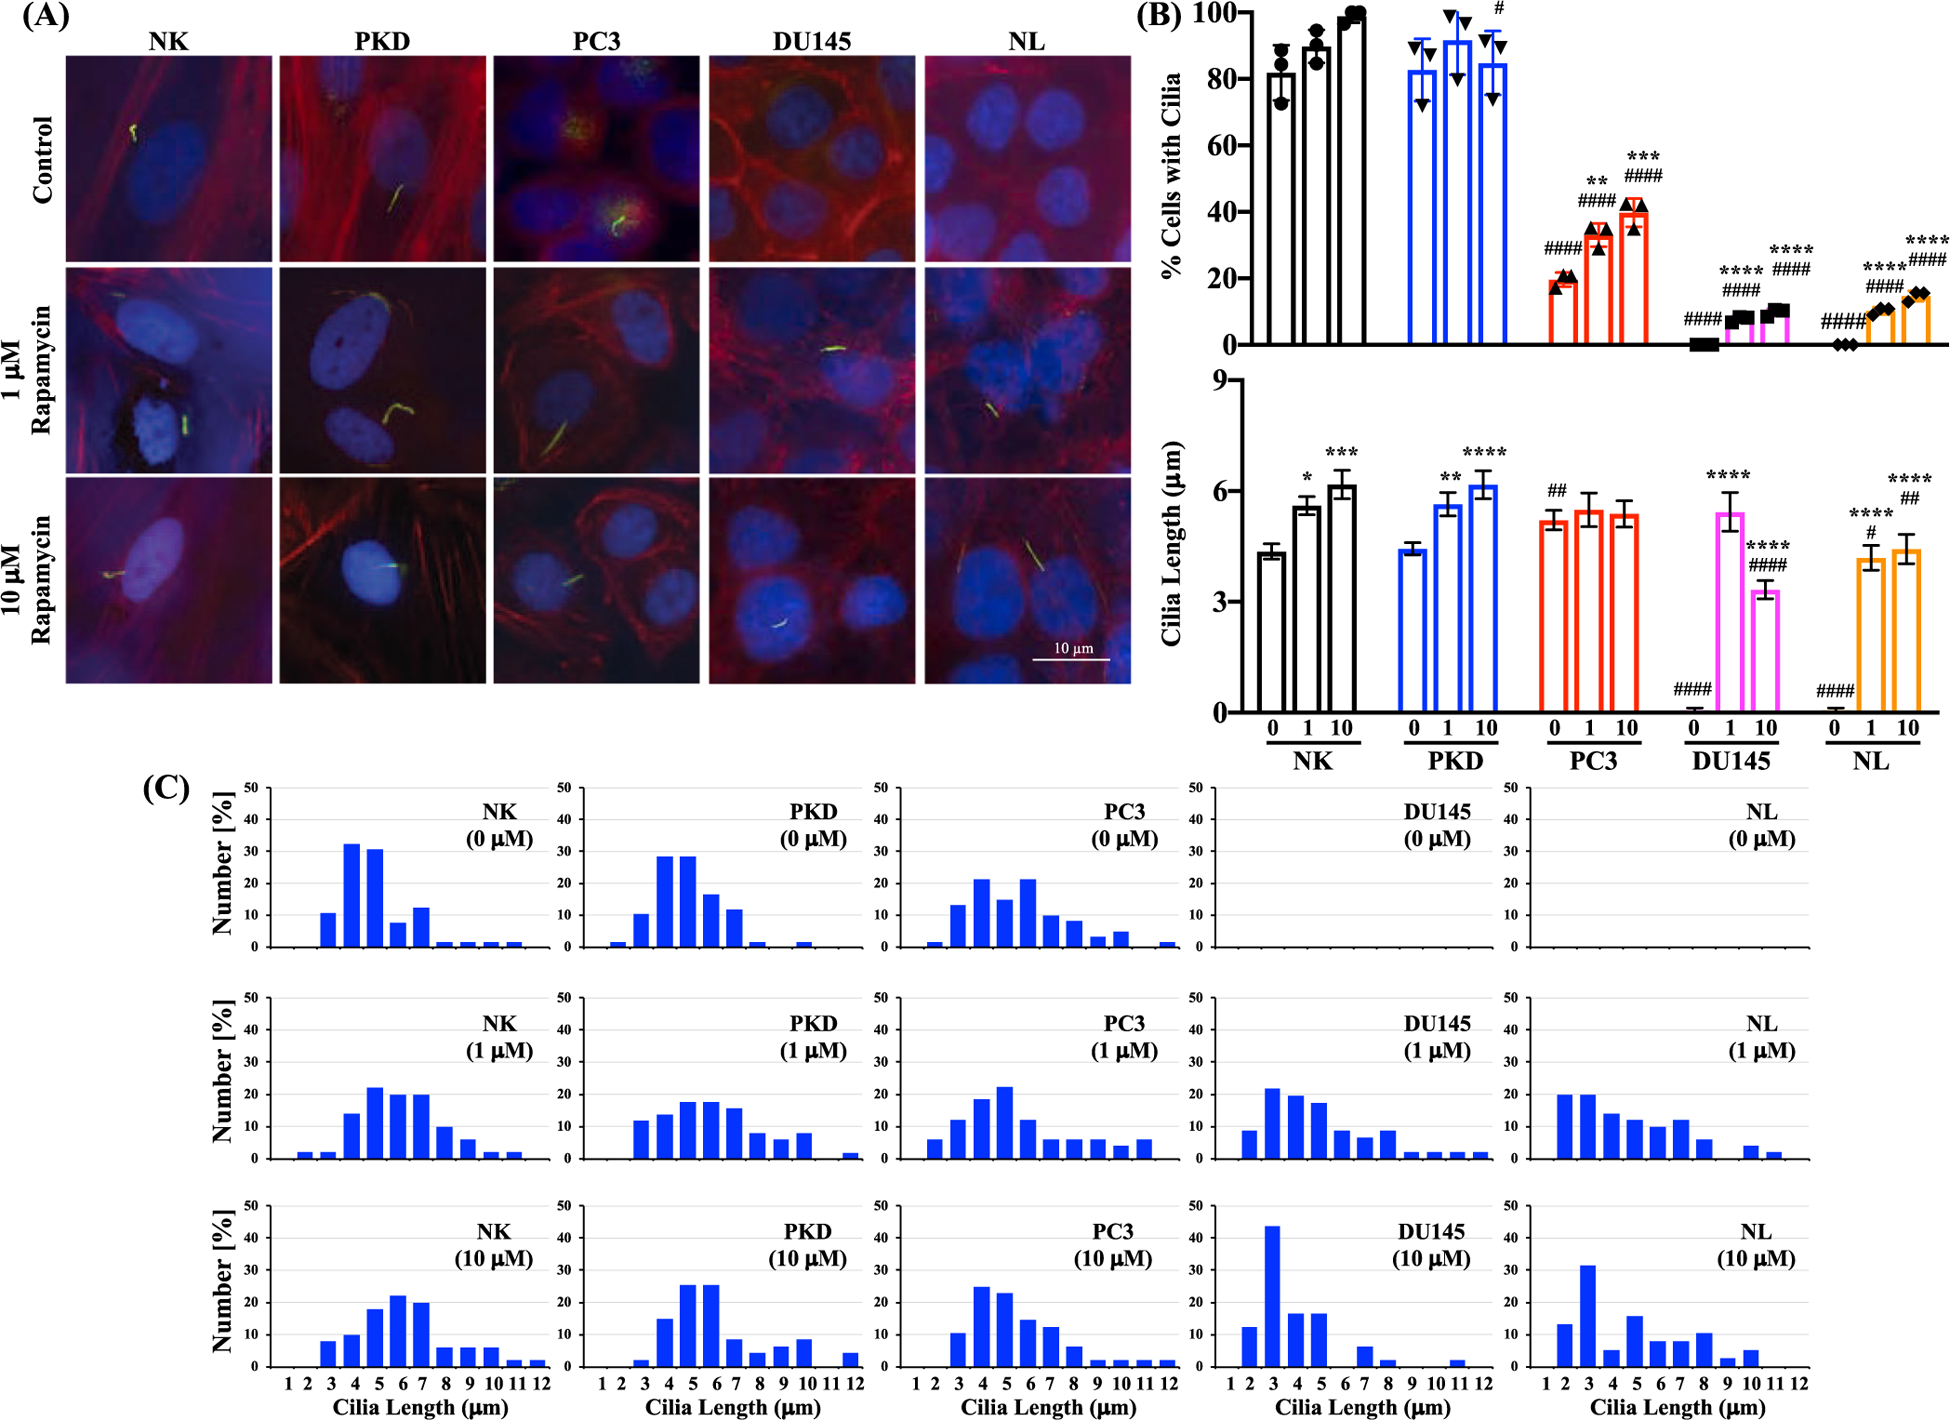
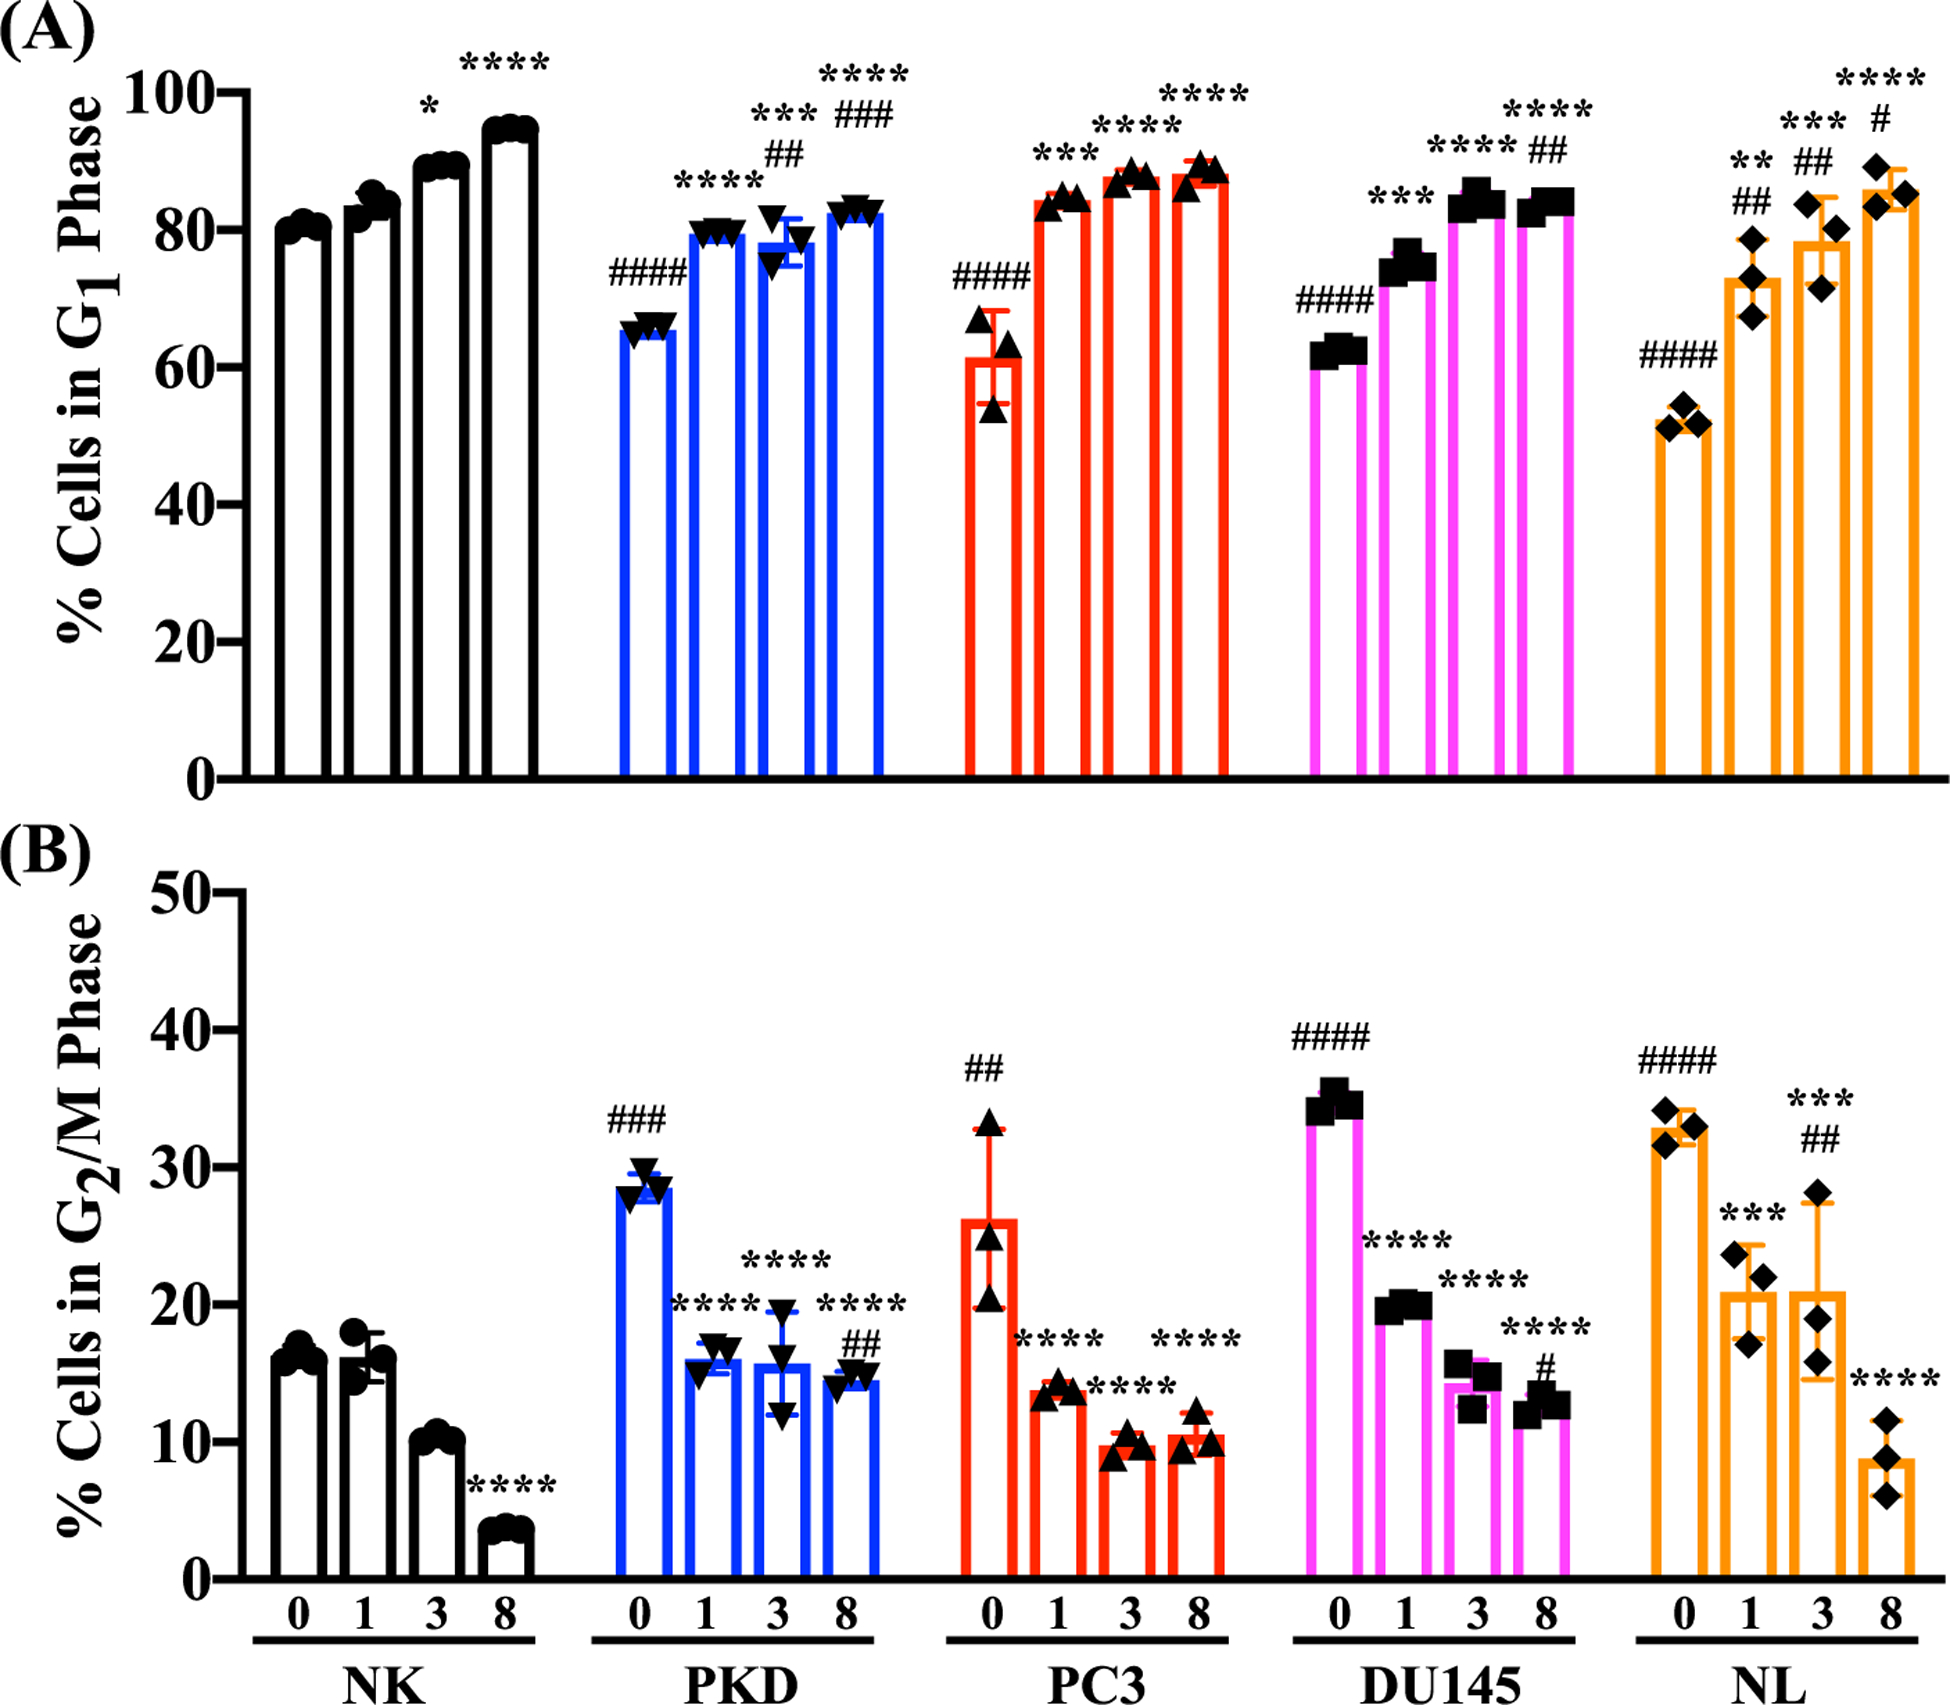
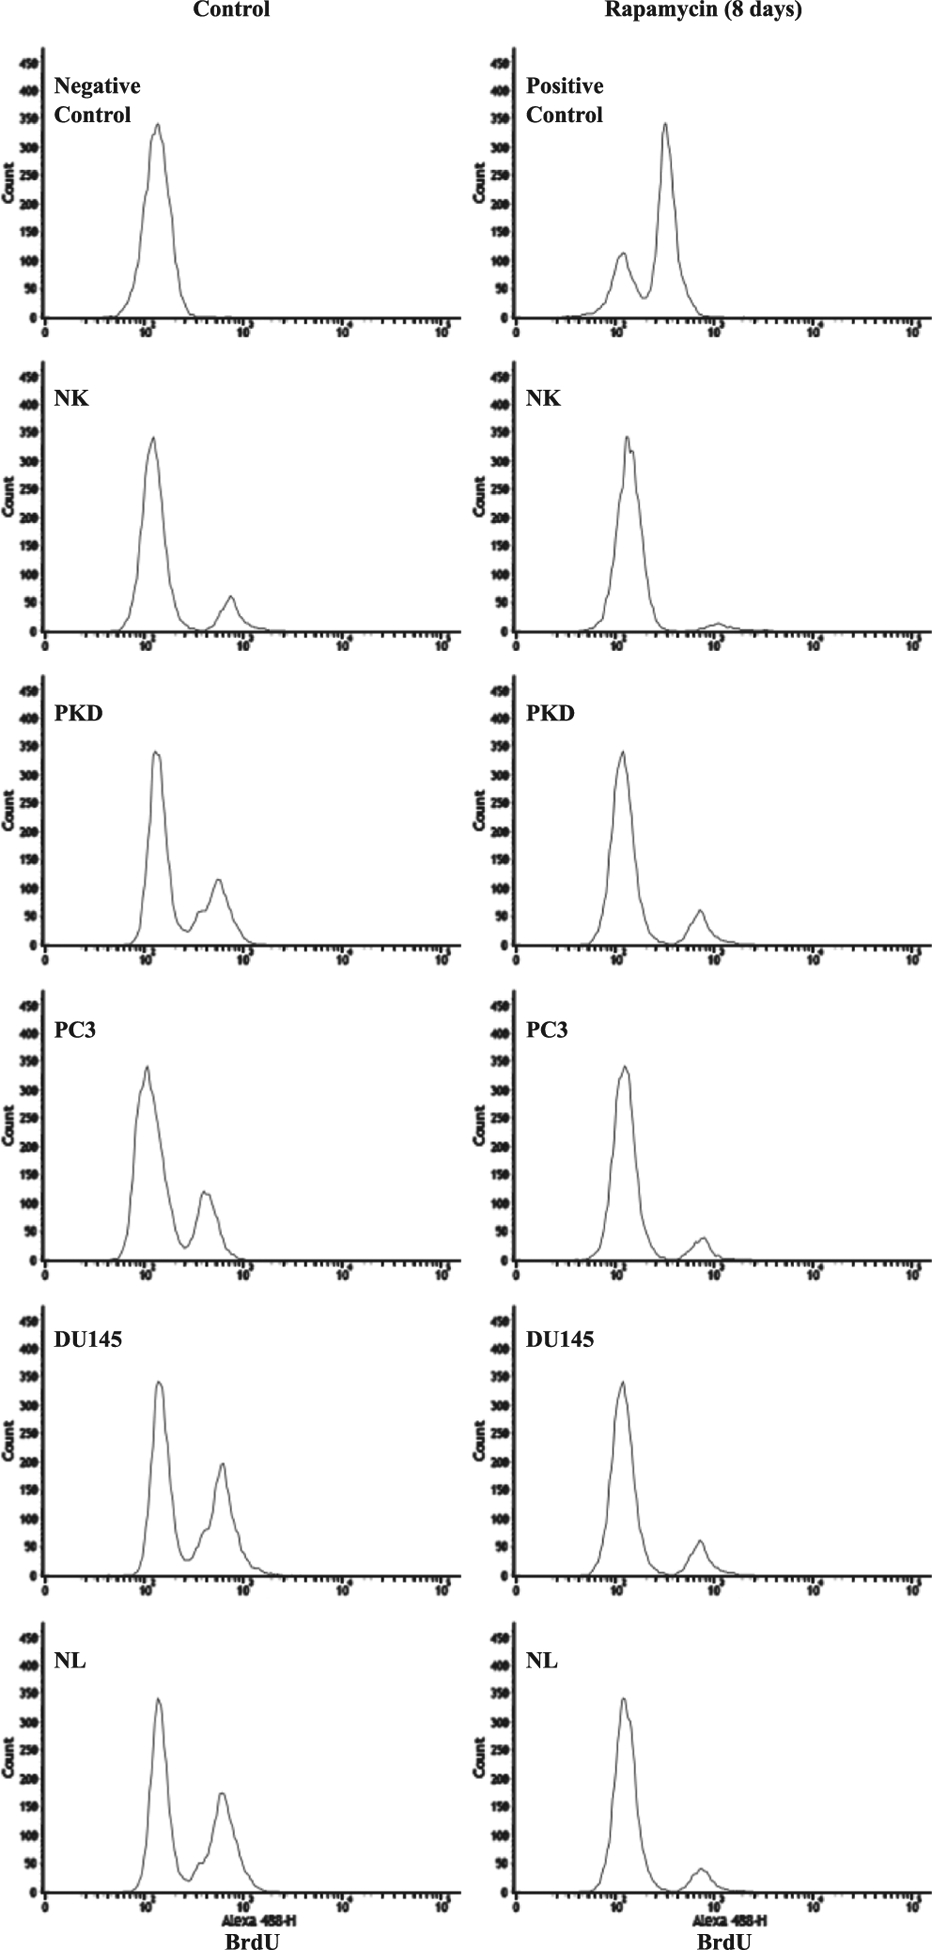
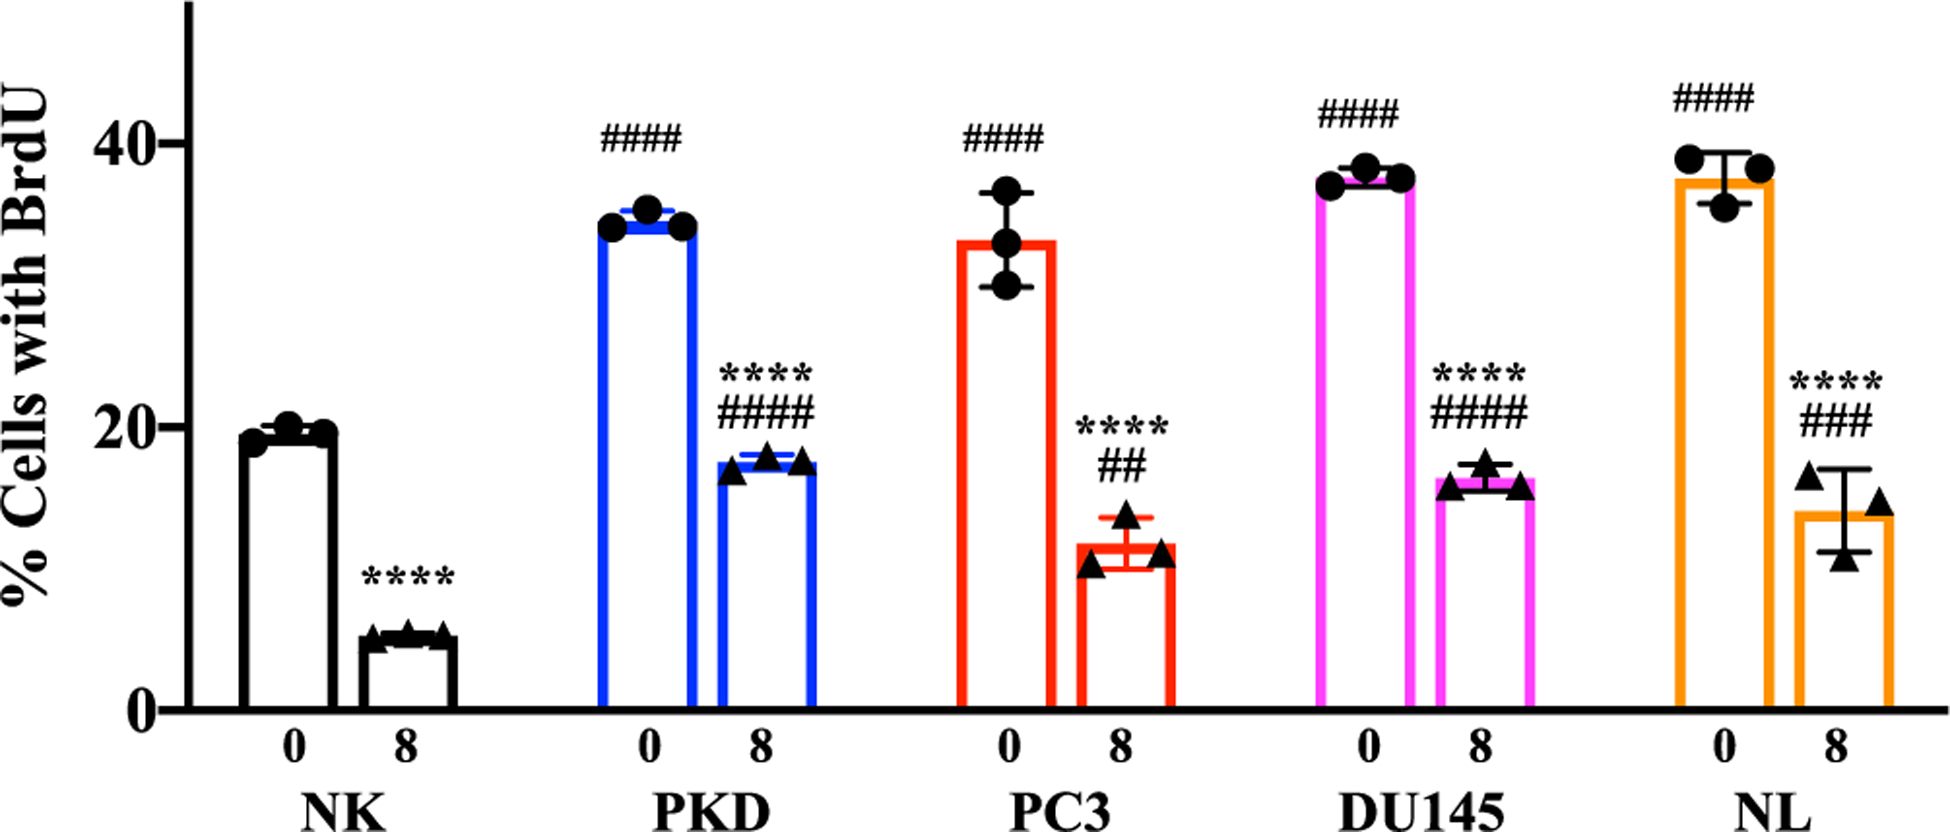
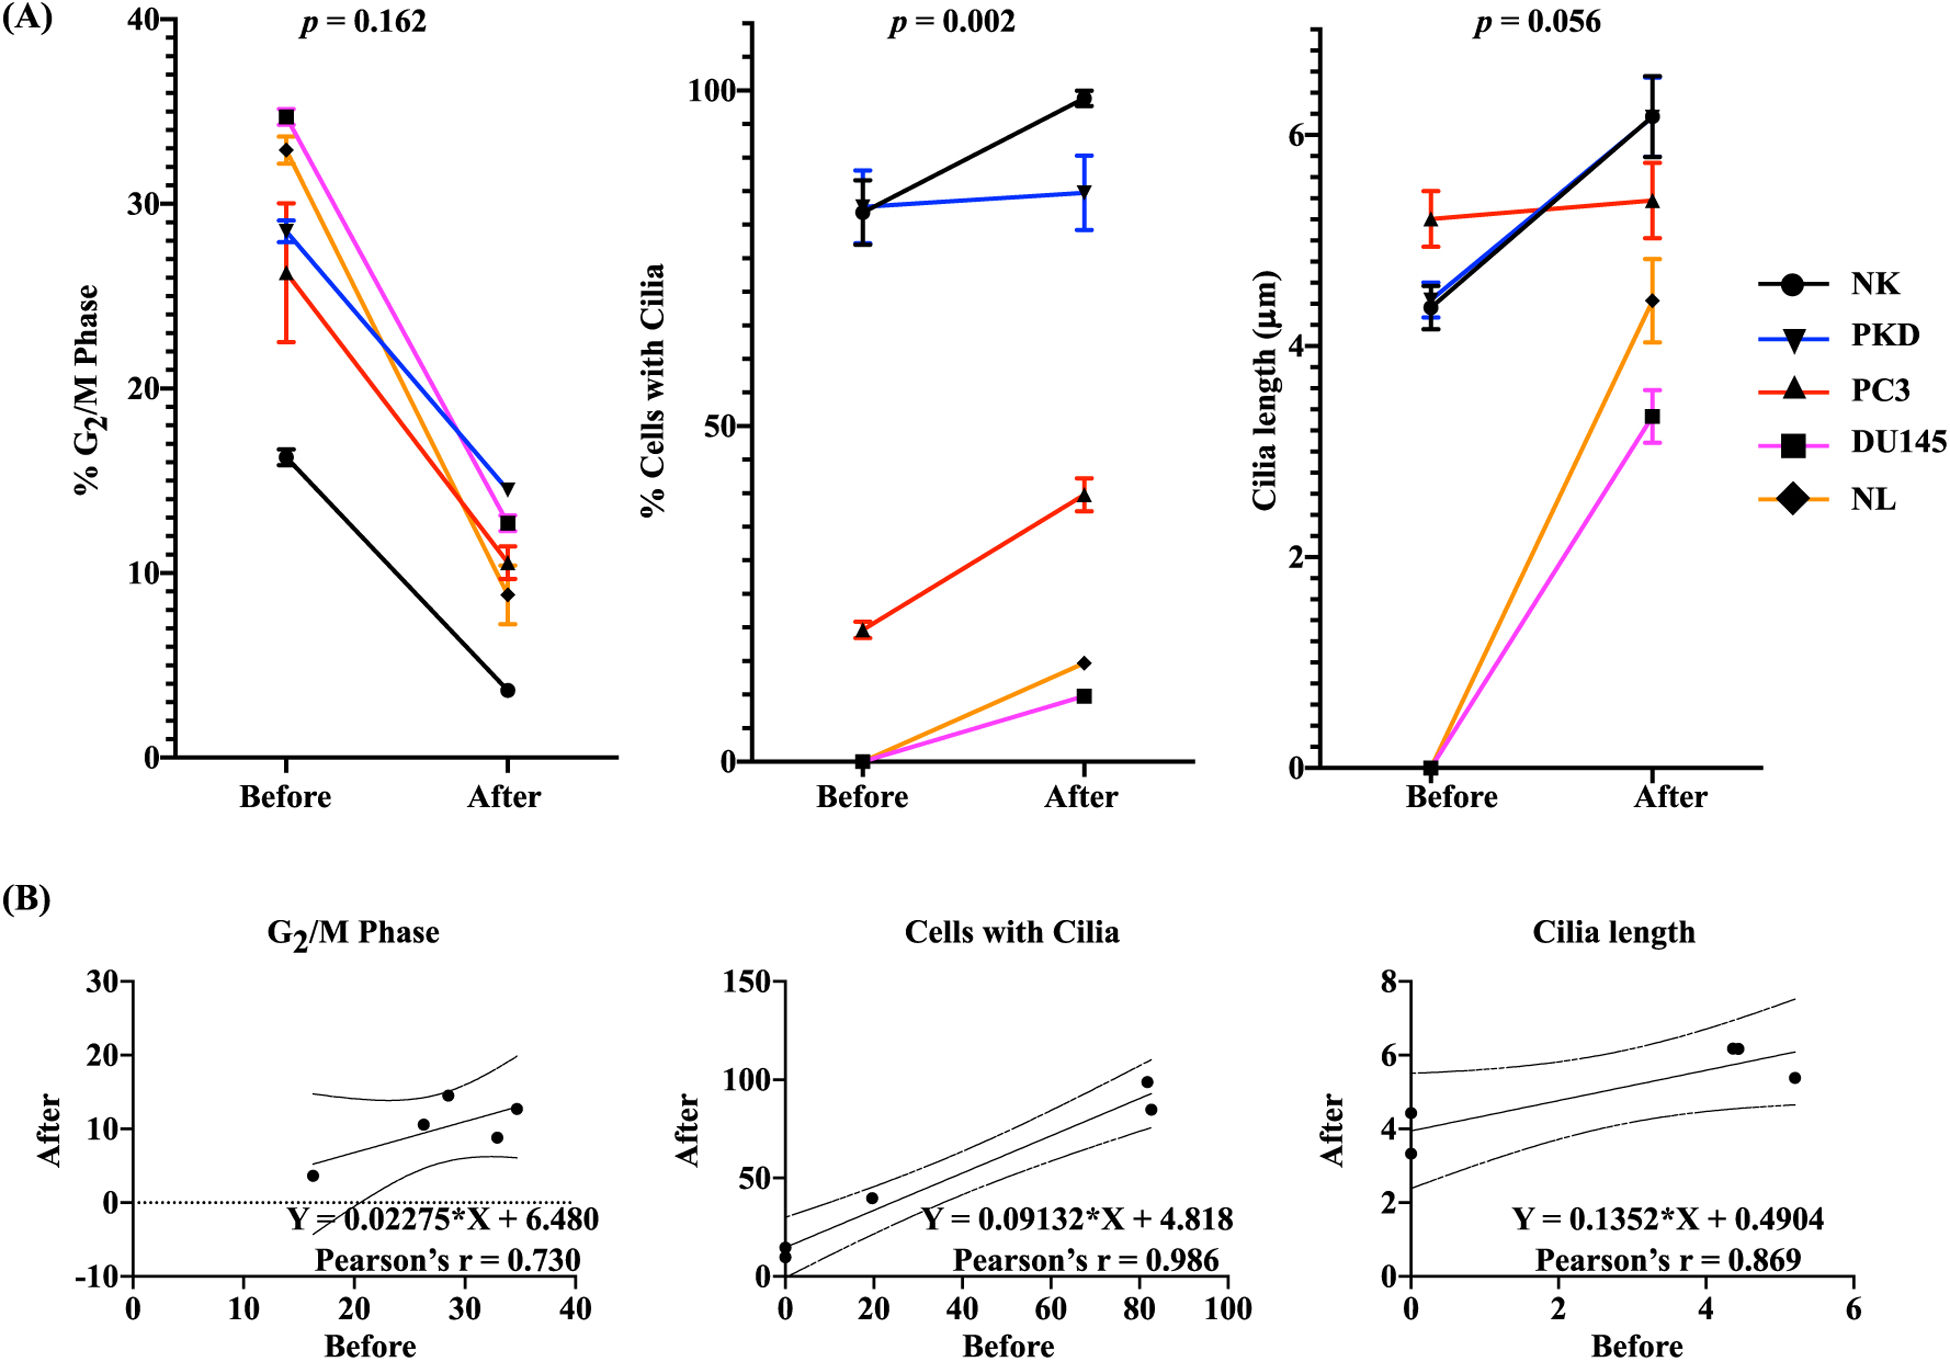
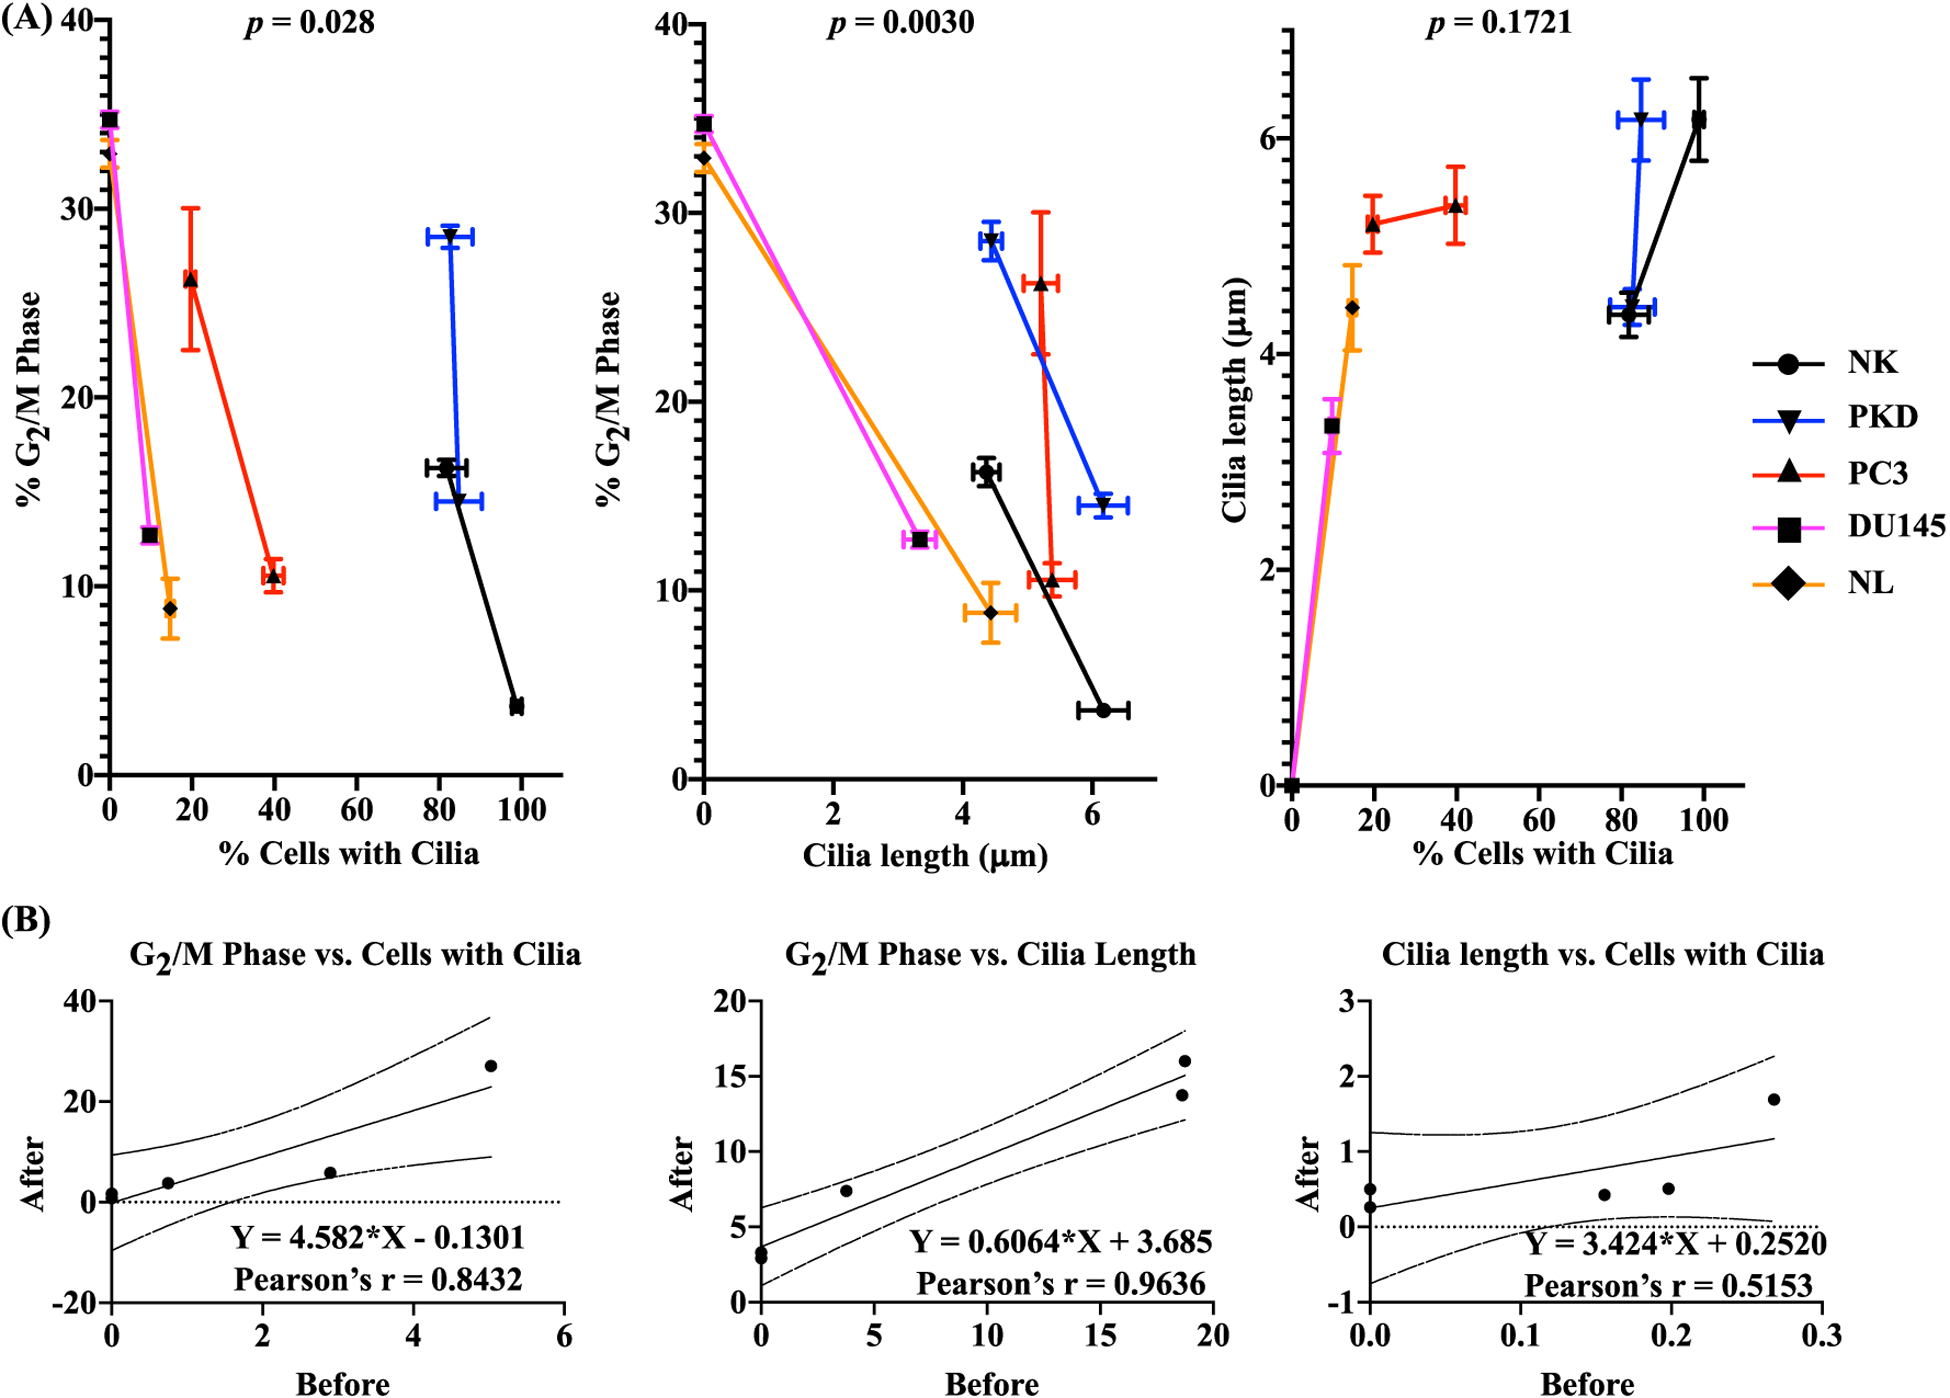
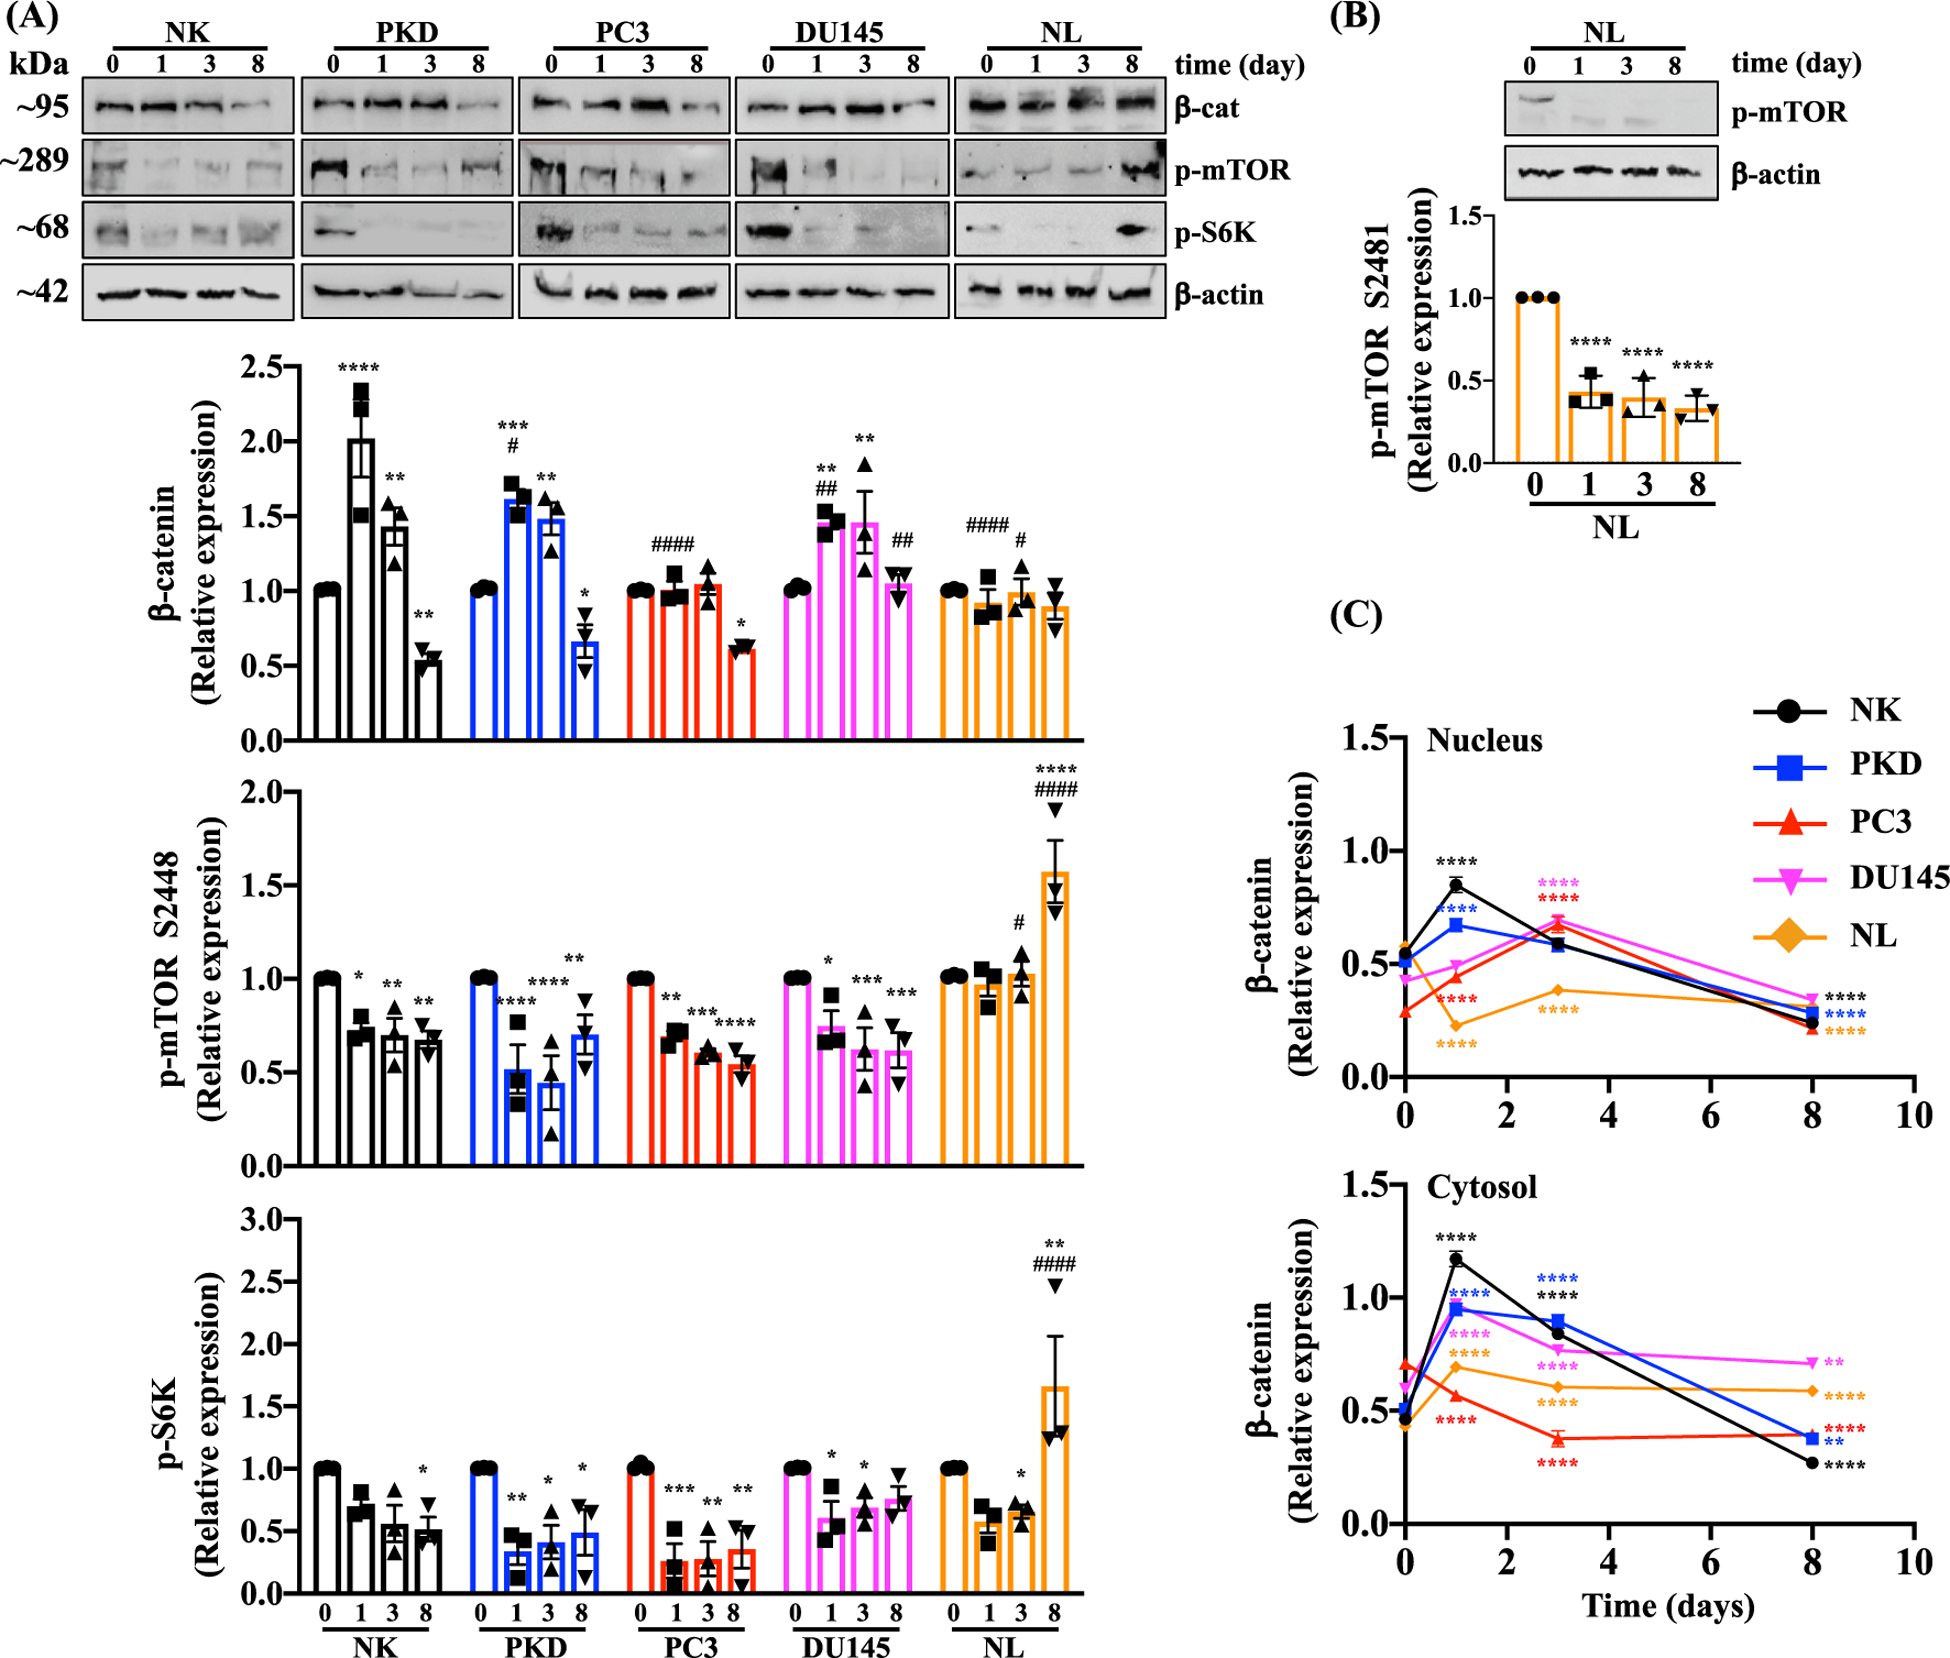
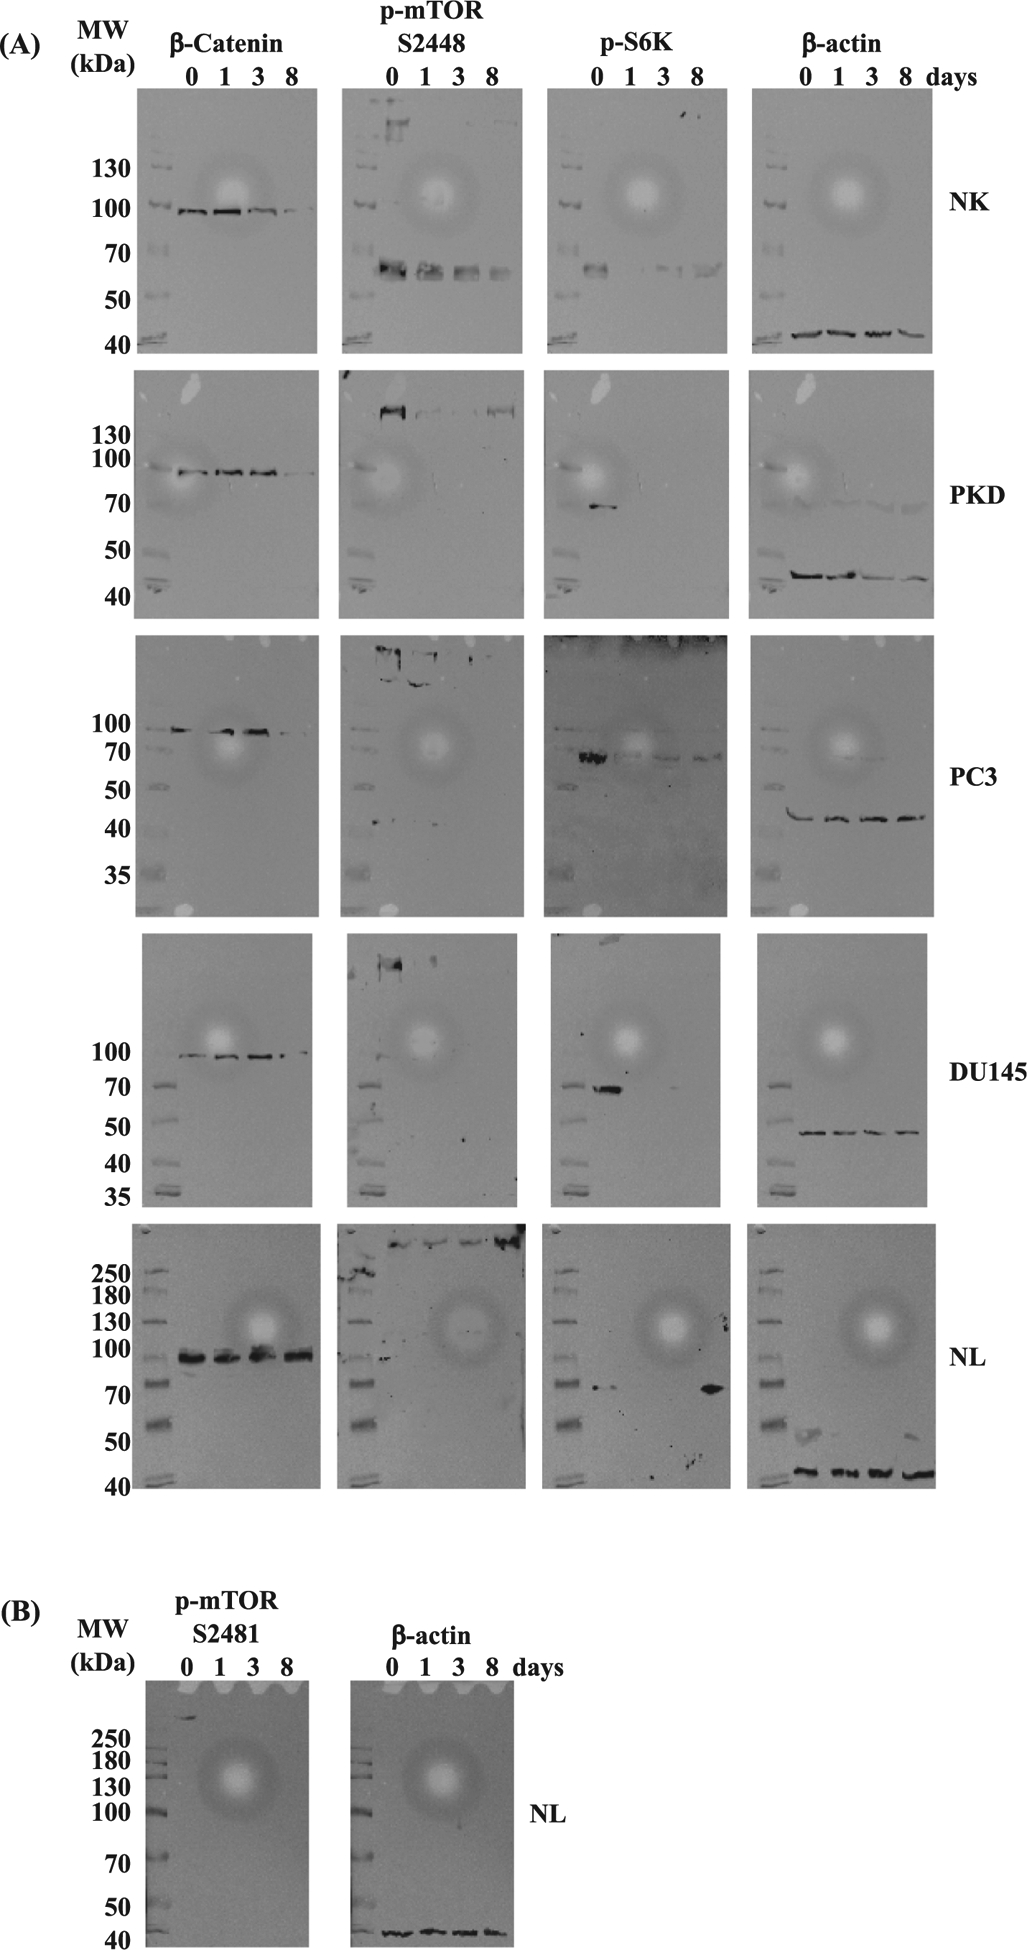
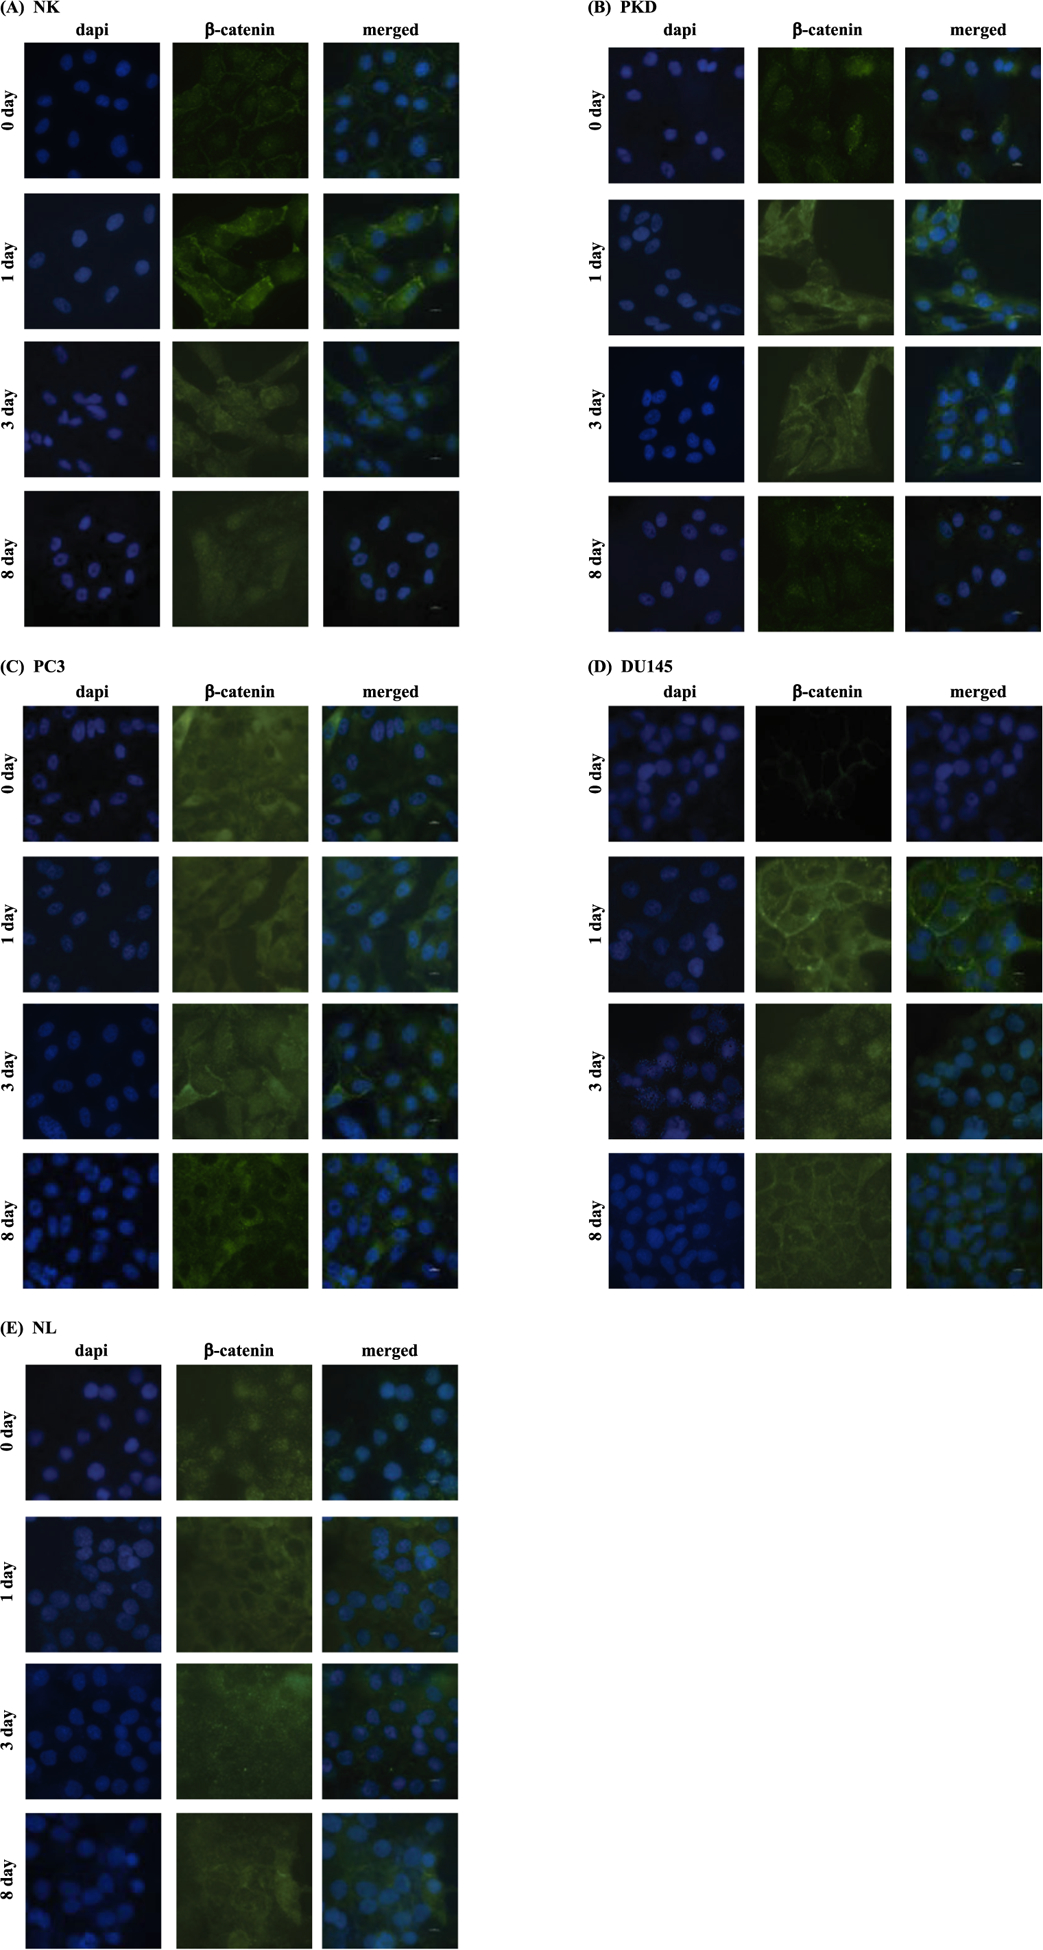
Primary cilia are sensory organelles that regulate cell cycle and signaling pathways. In addition to its association with cancer, dysfunction of primary cilia is responsible for the pathogenesis of polycystic kidney disease (PKD) and other ciliopathies. Because the association between cilia formation or length and cell cycle or division is poorly understood, we here evaluated their correlation in this study. Using Spectral Karyotyping (SKY) technique, we showed that PKD and the cancer/tumorigenic epithelial cells PC3, DU145, and NL20-TA were associated with abnormal ploidy. We also showed that PKD and the cancer epithelia were highly proliferative. Importantly, the cancer epithelial cells had a reduction in the presence and/or length of primary cilia relative to the normal kidney (NK) cells. We then used rapamycin to restore the expression and length of primary cilia in these cells. Our subsequent analyses indicated that both the presence and length of primary cilia were inversely correlated with cell proliferation. Collectively, our data suggest that restoring the presence and/or length of primary cilia may serve as a novel approach to inhibit cancer cell proliferation.

Keywords: Cancer; Karyotyping; Polycystic kidney disease; Proliferation; Wnt signalling.


Conflict of interest statement

Declaration of Competing Interest The authors declare that they have no known competing financial interests or personal relationships that could have appeared to influence the work reported in this paper.

Figures

Fig. 1.
Fig. 1.
Karyotyping analyses of human epithelial cells. Spectral karyotyping shows somatic chromosomes (1 to 22) with a pair of sex chromosomes (XY). Representative images show epithelium from (A) normal kidney (NK) with normal chromosome number (46, XY), (B) PKD (77,XX), (C) PC3 prostate cancer (104,XY),(D) DU145 (72,XY), and (E) NL (109,XX). (F) Summary of overall karyotype analysis of individual cells confirmed the abnormal ploidy associated with PKD and cancer cells. N = 10–12 for each cell type.
Fig. 2.
Fig. 2.
Representative images of metaphase spread. Shown here are images in brightfield (on the left) and pseudocolored (on the right) of NK, PKD, PC3, DU145, and NL.
Fig. 3.
Fig. 3.
Evaluation of primary cilia expression and length in epithelial cells. (A) Representative images of primary cilia in human epithelial cells. Primary cilia were identified by immunofluorescence using antibody against acetylated α -tubulin (green); actin filaments using texas red-conjugated phalloidin (red); and nuclei using DAPI (blue). (B) The percent of cells with cilia and the average cilia length of each cell type. (C) Histograms depict the distribution of cilia lengths in each cell type. Values are represented as mean ± SEM. ****, p < 0.0001 compared with the control (NK) cells. N = 4 independent experiments.
Fig. 4.
Fig. 4.
PKD and Cancer Epithelia were Highly Proliferative. (A) The growth rates of the five cell types over a period of five days were examined by counting the cell number in each of the five days. (B) Quantitation of cell cycle phases in selected cells using propidium iodide. The relative percentages of cells in G1 and G2/M under confluent condition or non-confluent condition are shown on this graph. Values are represented as mean ± SEM. *, p < 0.05; **, p < 0.01; ***, p < 0.001; and ****, p < 0.0001 compared with the control NK. N = 3 for cell growth; N = 8 for cell cycle analysis.
Fig. 5.
Fig. 5.
Quantitation of G1 and G2/M phases. Representative graphs show the percentages of cells with varying intensity of PI (propidium iodide) staining of NK, PKD, PC3, DU145, and NL under confluent and non-confluent conditions.
Fig. 6.
Fig. 6.
The effect of rapamycin treatment on ciliogenesis. (A) The representative images that show primary cilia expression after treatment with 0, 1 or 10 μM of rapamycin for 8 days in NK, PKD, PC3, DU145, and NL. Primary cilia were identified by immunofluorescence using antibody against acetylated α -tubulin (green); actin filaments using texas red-conjugated phalloidin (red); and nuclei using DAPI (blue). (B) The percentages of cells with cilia and the average cilia length after treatment with 0, 1, or 10 μM of rapamycin for 8 days in NK, PKD, PC3, DU145, and NL. (C) Histograms show the distribution of cilia length after rapamycin treatment (0, 1, or 10 μM). Values are represented as mean ± SEM. *, p < 0.05; **, p < 0.01; ***, p < 0.001; and ****, p < 0.0001compared to control baseline of corresponding group. #, p < 0.05; ##, p < 0.01; ###, p < 0.001; and ####, p < 0.0001compared to normal kidney (NK) epithelia. N = 3 independent experiments with a total of at least 150 cilia measurements. (NOTE: technically the ANOVA test results should be reported first, i.e., their p values. Only if their p values are significant, then the post-test analysis need to be performed. As of now, the ANOVA p values are not reported.)
Fig. 7.
Fig. 7.
Inhibition of cell proliferation by rapamycin using propodium iodide. Quantitation of cell cycle phases using propidium iodide. The relative percentages of cells in (A) G1 and (B) G2/M before and after treatment with 10 μM of rapamycin for 1, 3, and 8 days in NK, PKD, PC3, DU145, and NL. Values are represented as mean ± SEM. *, p < 0.05; **, p < 0.01; ***, p < 0.001; and ****, p < 0.0001compared to control baseline of corresponding group. #, p < 0.05; ##, p < 0.01; ###, p < 0.001; and ####, p < 0.0001compared to control NK. N = 3 independent experiments.
Fig. 8.
Fig. 8.
Analysis of BrdU incorporation. Representative graphs show the numbers of cells (count) with varying incorporation (intensity) of BrdU staining in NK, PKD, PC3, DU145, and NL before and after treatment with 10 μM rapamycin for 8 days.
Fig. 9.
Fig. 9.
Inhibition of cell proliferation by rapamycin using BrdU. The relative percentages of cells with BrdU before and after treatment with 10 μM rapamycin for 8 days in NK, PKD, PC3, DU145, and NL. Values are represented as mean ± SEM. *, p < 0.05; **, p < 0.01; ***, p < 0.001; and ****, p < 0.0001compared to control baseline of corresponding group. #, p < 0.05; ##, p < 0.01; ###, p < 0.001; and ####, p < 0.0001compared to control NK. N = 3 independent experiments.
Fig. 10.
Fig. 10.
One-Dimensional Correlation Analysis. (A) Pearson correlation was used to evaluate the association before and after rapamycin treatment on the changes in the percentage of cells in G2/M phase, percentage of cells with cilia, and cilia length. The p-value (p) represents the significance of the correlation coefficient. (B) The results of Pearson linear regression analysis are shown in scattered plots. The scattered plots show changes in each variable before and after rapamycin treatment. Pearson correlation coefficient (r) shows the regression line and the upper and lower 95% confidence limits.
Fig. 11.
Fig. 11.
Two-Dimension Correlation analysis data. (A) Pearson correlation was used to evaluate the correlations of the changes in cilia expression vs. cell proliferation, cilia length vs. cell proliferation, and cilia expression vs. cilia length. The p-value (p) represents the significance of the correlation coefficient. (B) The results of Pearson linear regression analysis are shown in scattered plots. The scattered plots show changes in two variables before and after rapamycin treatment. Pearson correlation coefficient (r) shows the regression line and the upper and lower 95% confidence limits.
Fig. 12.
Fig. 12.
Effects of Rapamycin on Signaling Molecules. (A) The protein expressions of β-catenin, p-mTOR (Ser2448), p-S6k, and β -actin were analyzed before and after treatment with 10 μM of rapamycin for 1, 3, and 8 days in NK, PKD, PC3, DU145, and NL. (B) The protein expressions of p-mTOR (Ser2481) was separately analyzed in NL. Relative expression levels are expressed as the density ratio relative to β-actin. (C) Quantifications of nuclear and cytosolic accumulation of β-catenin were measured before and after treatment with 10 μM of rapamycin for 1, 3, and 8 days in NK, PKD, PC3, DU145, and NL. Values are represented as mean ± SEM. *, p < 0.05; **, p < 0.01; ***, p < 0.001; and ****, p < 0.0001compared to control baseline of corresponding group. #, p < 0.05; ##, p < 0.01; ###, p < 0.001; and ####, p < 0.0001compared to control NK. N = 3 independent experiments.
Fig. 13.
Fig. 13.
Representative Western blot images. (A) Original, uncropped immunoblots of β-catenin, p-mTOR (Ser2448), p-S6k, and β -actin are shown before and after treatment with 10 μM of rapamycin for 1, 3, and 8 days in NK, PKD, PC3, DU145, and NL. (B) Original blots of p-mTOR (Ser2481) and β -actin are shown before and after treatment with 10 μM of rapamycin for 1, 3, and 8 days in NL. The molecular weight (MWs) of the proteins are shown on the left of each corresponding blot.
Fig. 14.
Fig. 14.
Representative immunofluorescent images of β-catenin. β-catenin translocation was assessed before and after treatment with 10 μM of rapamycin for 1, 3, and 8 days in NK, PKD, PC3, DU145, and NL.

Similar articles

Cited by

References

    1. Liu H, Kiseleva AA, Golemis EA, Ciliary signalling in cancer, Nat. Rev. Cancer 18(8) (2018) 511–524. - PMC - PubMed
    1. Inoko A, Matsuyama M, Goto H, Ohmuro-Matsuyama Y, Hayashi Y, Enomoto M,Ibi M, Urano T, Yonemura S, Kiyono T, Izawa I, Inagaki M, Trichoplein and Aurora A block aberrant primary cilia assembly in proliferating cells, J. Cell Biol 197 (3) (2012) 391–405. - PMC - PubMed
    1. Hassounah NB, Bunch TA, McDermott KM, Molecular pathways: the role of primary cilia in cancer progression and therapeutics with a focus on Hedgehog signaling, Clin. Cancer Res 18 (9) (2012) 2429–2435. - PMC - PubMed
    1. Schneider L, Cammer M, Lehman J, Nielsen SK, Guerra CF, Veland IR,Stock C, Hoffmann EK, Yoder BK, Schwab A, Satir P, Christensen ST, Directional cell migration and chemotaxis in wound healing response to PDGF-AA are coordinated by the primary cilium in fibroblasts, Cell Physiol. Biochem 25 (2–3) (2010) 279–292. - PMC - PubMed
    1. Fonte VG, Searls RL, Hilfer SR, The relationship of cilia with cell division and differentiation, J. Cell Biol 49 (1) (1971) 226–229. - PMC - PubMed

Publication types

MeSH terms