

Deficits in coordinated neuronal activity and network topology are striatal hallmarks in Huntington's disease
- PMID: 32466798
- PMCID: PMC7254676
- DOI: 10.1186/s12915-020-00794-4
Deficits in coordinated neuronal activity and network topology are striatal hallmarks in Huntington's disease
Abstract
Background: Network alterations underlying neurodegenerative diseases often precede symptoms and functional deficits. Thus, their early identification is central for improved prognosis. In Huntington's disease (HD), the cortico-striatal networks, involved in motor function processing, are the most compromised neural substrate. However, whether the network alterations are intrinsic of the striatum or the cortex is not fully understood.
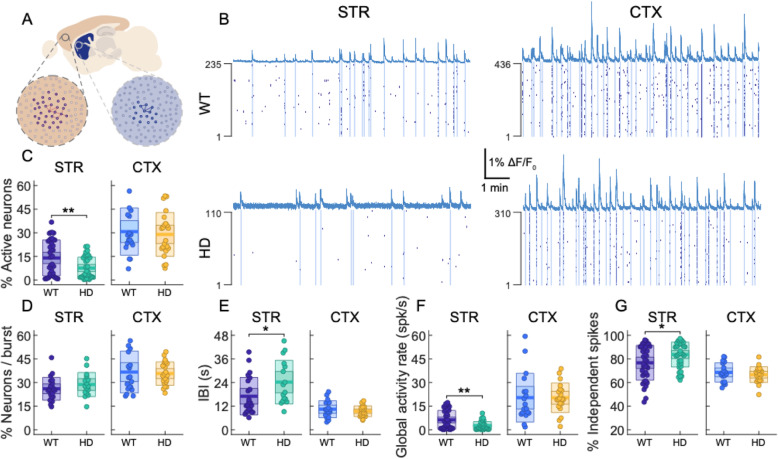
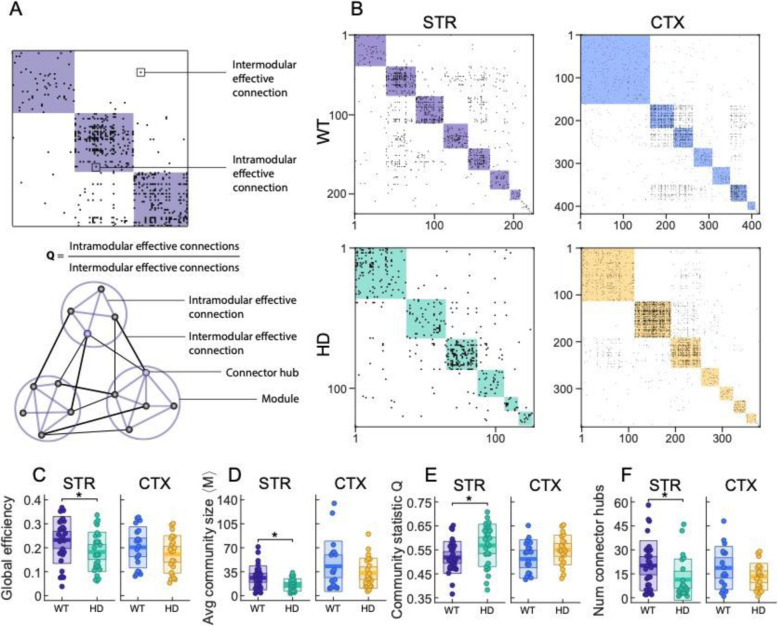
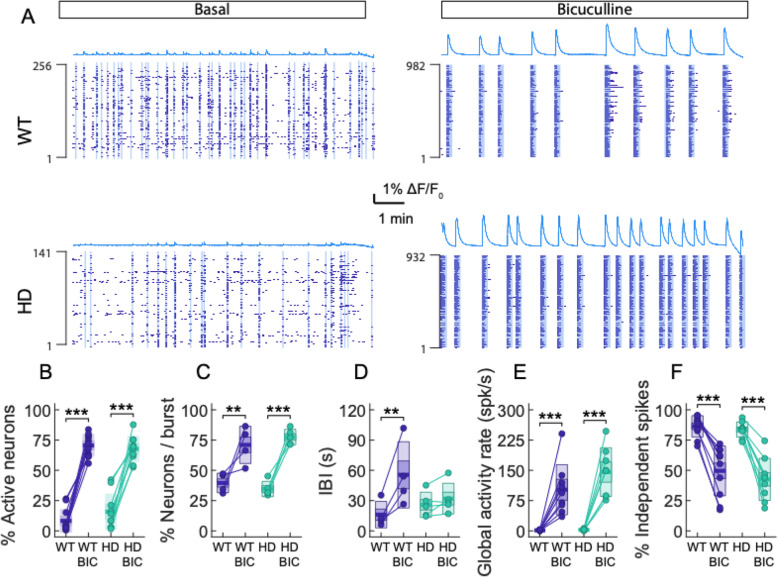
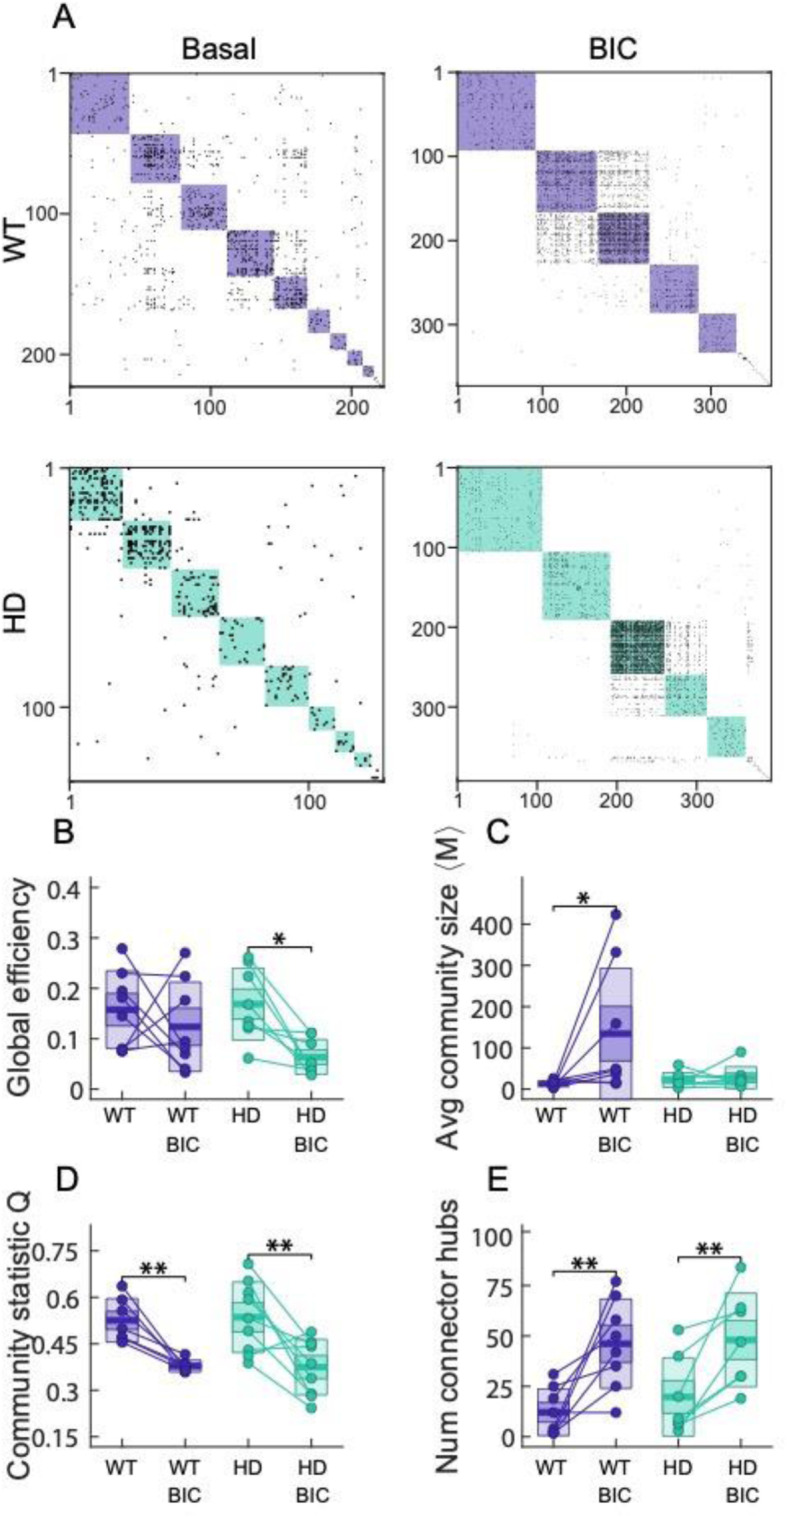
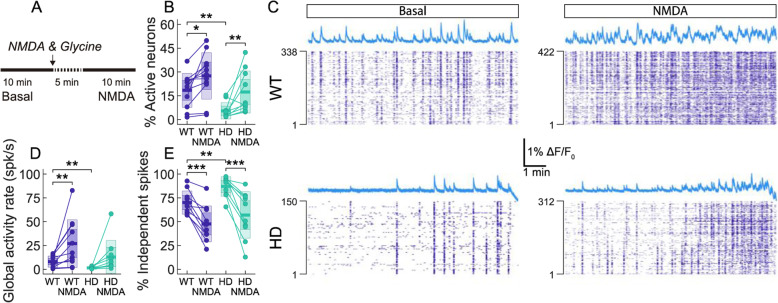
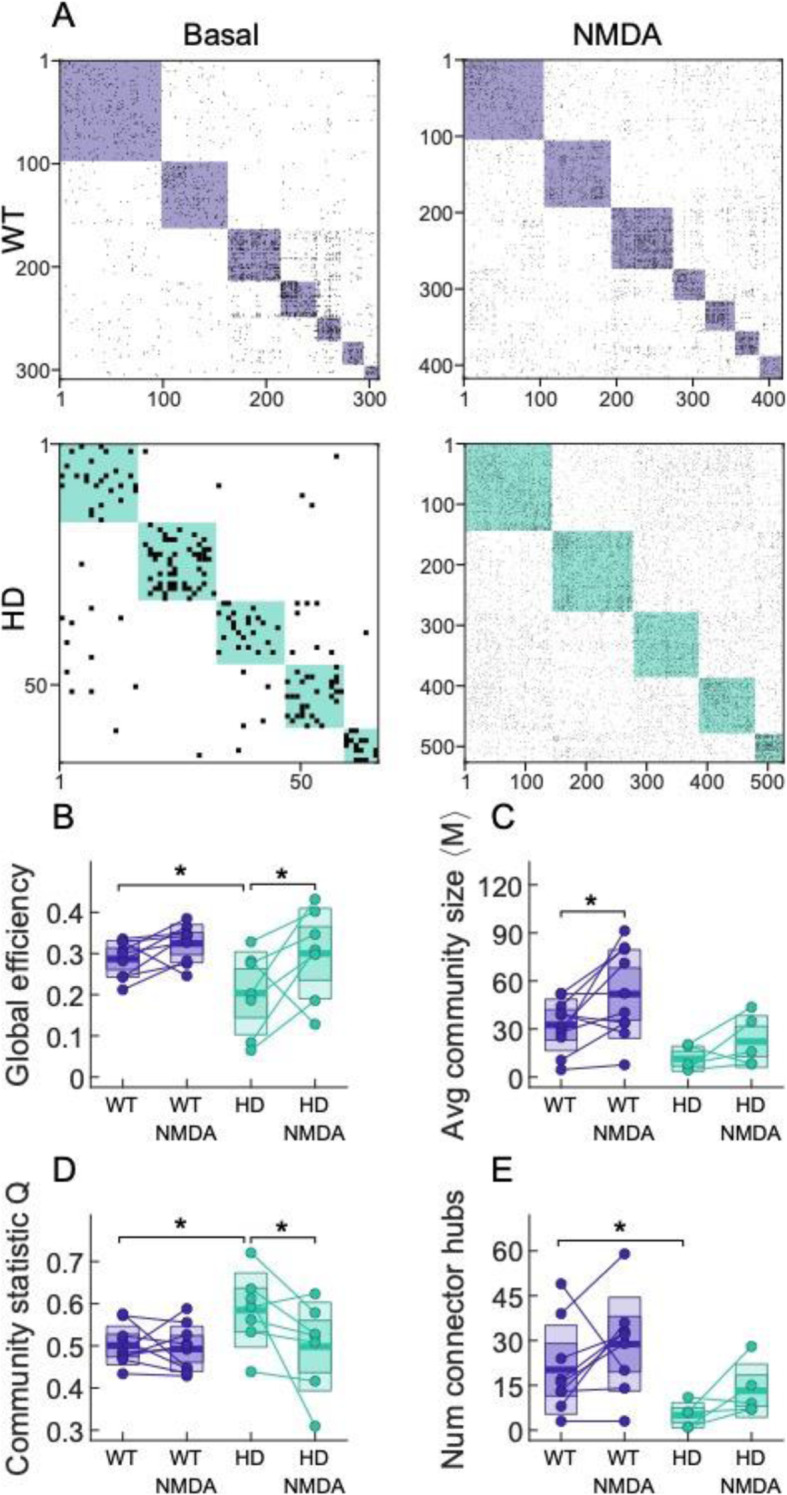
Results: In order to identify early HD neural deficits, we characterized neuronal ensemble calcium activity and network topology of HD striatal and cortical cultures. We used large-scale calcium imaging combined with activity-based network inference analysis. We extracted collective activity events and inferred the topology of the neuronal network in cortical and striatal primary cultures from wild-type and R6/1 mouse model of HD. Striatal, but not cortical, HD networks displayed lower activity and a lessened ability to integrate information. GABAA receptor blockade in healthy and HD striatal cultures generated similar coordinated ensemble activity and network topology, highlighting that the excitatory component of striatal system is spared in HD. Conversely, NMDA receptor activation increased individual neuronal activity while coordinated activity became highly variable and undefined. Interestingly, by boosting NMDA activity, we rectified striatal HD network alterations.
Conclusions: Overall, our integrative approach highlights striatal defective network integration capacity as a major contributor of basal ganglia dysfunction in HD and suggests that increased excitatory drive may serve as a potential intervention. In addition, our work provides a valuable tool to evaluate in vitro network recovery after treatment intervention in basal ganglia disorders.
Keywords: Calcium imaging; Huntington’s disease; Network; Neuronal activity; Striatum.
Conflict of interest statement
The authors declare no competing interests.
Figures
Similar articles
-
Relationship between subthalamic nucleus neuronal activity and electrocorticogram is altered in the R6/2 mouse model of Huntington's disease.J Physiol. 2015 Aug 15;593(16):3727-38. doi: 10.1113/JP270268. Epub 2015 Jun 25. J Physiol. 2015. PMID: 25952461 Free PMC article.
-
M2 cortex-dorsolateral striatum stimulation reverses motor symptoms and synaptic deficits in Huntington's disease.Elife. 2020 Oct 5;9:e57017. doi: 10.7554/eLife.57017. Elife. 2020. PMID: 33016873 Free PMC article.
-
Striatal Direct and Indirect Pathway Output Structures Are Differentially Altered in Mouse Models of Huntington's Disease.J Neurosci. 2018 May 16;38(20):4678-4694. doi: 10.1523/JNEUROSCI.0434-18.2018. Epub 2018 Apr 24. J Neurosci. 2018. PMID: 29691329 Free PMC article.
-
Disrupted striatal neuron inputs and outputs in Huntington's disease.CNS Neurosci Ther. 2018 Apr;24(4):250-280. doi: 10.1111/cns.12844. CNS Neurosci Ther. 2018. PMID: 29582587 Free PMC article. Review.
-
Cognitive Dysfunction in Huntington's Disease: Humans, Mouse Models and Molecular Mechanisms.J Huntingtons Dis. 2012;1(2):155-73. doi: 10.3233/JHD-120023. J Huntingtons Dis. 2012. PMID: 25063329 Review.
Cited by
-
Long-term calcium imaging reveals functional development in hiPSC-derived cultures comparable to human but not rat primary cultures.Stem Cell Reports. 2023 Jan 10;18(1):205-219. doi: 10.1016/j.stemcr.2022.11.014. Epub 2022 Dec 22. Stem Cell Reports. 2023. PMID: 36563684 Free PMC article.
-
Calcium imaging: A versatile tool to examine Huntington's disease mechanisms and progression.Front Neurosci. 2022 Nov 3;16:1040113. doi: 10.3389/fnins.2022.1040113. eCollection 2022. Front Neurosci. 2022. PMID: 36408400 Free PMC article. Review.
-
Neuron-derived extracellular vesicles contain synaptic proteins, promote spine formation, activate TrkB-mediated signalling and preserve neuronal complexity.J Extracell Vesicles. 2023 Sep;12(9):e12355. doi: 10.1002/jev2.12355. J Extracell Vesicles. 2023. PMID: 37743539 Free PMC article.
-
Unraveling the Spatiotemporal Distribution of VPS13A in the Mouse Brain.Int J Mol Sci. 2021 Dec 1;22(23):13018. doi: 10.3390/ijms222313018. Int J Mol Sci. 2021. PMID: 34884823 Free PMC article.
-
Criticality and universality in neuronal cultures during "up" and "down" states.Front Neural Circuits. 2024 Sep 10;18:1456558. doi: 10.3389/fncir.2024.1456558. eCollection 2024. Front Neural Circuits. 2024. PMID: 39323503 Free PMC article.
References
-
- Palop JJ, Chin J, Mucke L. A network dysfunction perspective on neurodegenerative diseases. Nature. 2006;443:768–773. - PubMed
-
- Fornito A, Zalesky A, Breakspear M. The connectomics of brain disorders. Nat Rev Neurosci. 2015;16:159–172. - PubMed
-
- Ross CA, Aylward EH, Wild EJ, Langbehn DR, Long JD, Warner JH, et al. Huntington disease: natural history, biomarkers and prospects for therapeutics. Nat Rev Neurol. 2014;10:204–216. - PubMed
Publication types
MeSH terms
Grants and funding
- 713140/Horizon 2020 Framework Programme/International
- 863214/Horizon 2020 Framework Programme/International
- SAF2017-88076-R/Ministerio de Ciencia, Innovación y Universidades/International
- FIS2016-78507-C2-2-P/Ministerio de Ciencia, Innovación y Universidades/International
- FIS2017-90782-REDT/Ministerio de Ciencia, Innovación y Universidades/International
