. 2020 Jul;583(7814):83-89.
doi: 10.1038/s41586-020-2371-0. Epub 2020 May 27.

Mapping and characterization of structural variation in 17,795 human genomes

Collaborators, Affiliations

Mapping and characterization of structural variation in 17,795 human genomes

Haley J Abel et al. Nature. 2020 Jul.

Abstract

A key goal of whole-genome sequencing for studies of human genetics is to interrogate all forms of variation, including single-nucleotide variants, small insertion or deletion (indel) variants and structural variants. However, tools and resources for the study of structural variants have lagged behind those for smaller variants. Here we used a scalable pipeline1 to map and characterize structural variants in 17,795 deeply sequenced human genomes. We publicly release site-frequency data to create the largest, to our knowledge, whole-genome-sequencing-based structural variant resource so far. On average, individuals carry 2.9 rare structural variants that alter coding regions; these variants affect the dosage or structure of 4.2 genes and account for 4.0-11.2% of rare high-impact coding alleles. Using a computational model, we estimate that structural variants account for 17.2% of rare alleles genome-wide, with predicted deleterious effects that are equivalent to loss-of-function coding alleles; approximately 90% of such structural variants are noncoding deletions (mean 19.1 per genome). We report 158,991 ultra-rare structural variants and show that 2% of individuals carry ultra-rare megabase-scale structural variants, nearly half of which are balanced or complex rearrangements. Finally, we infer the dosage sensitivity of genes and noncoding elements, and reveal trends that relate to element class and conservation. This work will help to guide the analysis and interpretation of structural variants in the era of whole-genome sequencing.


Conflict of interest statement

Competing Interests

The authors have no competing interests.

Figures
Extended Data Figure 1.
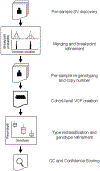
SV mapping pipeline. SV are detected within each sample using LUMPY. Breakpoint probability distributions are used to merge and refine the position of detected SV within a cohort, followed by parallelized re-genotyping, and copy number annotation. Samples are merged into a single cohort-level VCF file, variant types reclassified, and genotypes refined with svtools using the combined breakpoint genotype and read-depth information. Finally, sample-level QC and variant confidence scoring is conducted to produce the final callset.
Extended Data Figure 2.
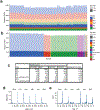
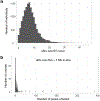
The B37 callset. (a) Variant counts (y-axis) for each sample (x-axis) in the callset, ordered by cohort, where large (>1 kb) variants are shown in dark shades and smaller variants in light shades. (b) Variant counts per sample, where samples are ordered by self-reported ancestry according to the color scheme at right, using the abbreviations described in Supplementary Table 1. Note that African-ancestry samples show more variant calls, as expected. (c) Table showing the number of variant calls by variant and frequency class, and Mendelian error rate by variant type. (d) Histogram of allele count for each variant class, showing alleles with counts ≤100. (e) Linkage disequilibrium of each variant class as represented by max R2 value to nearby SNVs, for N=1581 samples. Note that these distributions mirror those from our prior SV callset for GTEx, which was characterized extensively in the context of eQTLs.
Extended Data Figure 3.
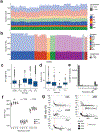
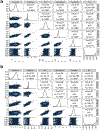
. Note that African-ancestry samples show more variant calls, as expected. Note also that there is some residual variability in variant counts due to differences in data from each sequencing center, but that this is mainly limited to small tandem duplications (see part a), primarily at STRs. (c) SV length distribution by variant class (d) Distribution of the number of singleton SVs detected in samples from different ancestry groups according to the abbreviations in Supplementary Table 1. Only groups with ≥1,000 samples in the B38 callset are shown, and each group was subsampled down to 1,000 individuals prior to allele frequency re-calculation. (e) Histogram showing the resolution of SV breakpoint calls, as defined by the length of the 95% confidence interval of the breakpoint-containing region defined by LUMPY, after cross-sample merging and refinement using svtools. Data are from N=360,614 breakpoints, 2 per variant. (f) Distribution of the number of SVs detected per sample in WGS data from each sequencing center (x-axis) for African and non-African samples, showing all variants (left), and those larger (middle) and smaller (right) than 1 kb in size. Per-center counts are as follows: Center A (1527 AFR, 2080 Non-AFR), Center B (408 AFR, 2745 Non-AFR), Center C (2953 AFR, 2226 Non-AFR), Center D (150 AFR, 2534 Non-AFR). (g) Plots of Mendelian error (ME) rate (y-axis) by mean sample quality (MSQ) for each variant class, where dot size is determined by point density (see right) and the threshold used to determine high and low confidence SVs is shown by the vertical lines. All boxplots indicate the medians and first and third quartiles; whiskers extend 1.5 times the interquartile distance.
Extended Data Figure 4.
Principal components analysis for the B37 callset. PCA were calculated using an LD-pruned subset of high-confidence DEL and MEI variants, with MAF>1%. Ancestry is based on self-report, using the color scheme at right, using the ancestry abbreviations described in Extended Data Table 1.
Extended Data Figure 5.
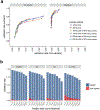
is based on the “100 bp slop or 90% reciprocal overlap” method, requiring ≥2 PacBio reads. (b) Validation rates by frequency class for variant carriers and non-carriers with increasing PacBio supporting read thresholds are shown using the same overlap method as in Supplementary Table 3. Variant counts per frequency class are as follows: singleton (N=133), rare (N=734), low frequency (N=1,361), and common (N=7,677).
Extended Data Figure 6.
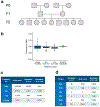
Mendelian inheritance analysis in a set of 3-generation CEPH pedigrees comprising 409 parent-offspring trios. (a) Example structure of a single CEPH pedigree indicating nomenclature of the parental (P0), first (F1) and second generation (F2). (b) Transmission rate of SVs from different allele frequency classes including SVs that are private to a single family (private), rare (<1%), low-frequency (“low”; 1-5%) and common (>5%). (c) Table showing the number and rate of Mendelian errors by allele frequency class. (d) Table showing the number and rate of Mendelian errors for SVs private to a single family, for each SV type.
Extended Data Figure 7.
Comparison of SV calls and genotypes to the 1000 Genomes (1KG) Phase3 callset. (a) number of known and novel SVs in the B37 (left) and B38 (right) callsets, shown by frequency class. (b) Table showing the genotypes reported in our B38 (rows) callset versus 1KG (columns) at SVs identified by both studies among the five samples included in both callsets. (c) Table showing genotype concordance by SV type including the fraction of concordant calls and Cohen’s Kappa coefficient. (d) Distribution of correlation (R2) between genotype (GT) information determined by breakpoint-spanning reads and copy number (CN) estimates determined by read-depth analysis for the SVs shown in parts (b) and (c), when genotype information between the B38 and 1KG callset are concordant (left) or discordant (middle, right). At sites with discordant genotypes, correlation with copy number information is typically higher for genotypes from the B38 callset (middle) than the 1KG callset (right).
Extended Data Figure 8.
Ultra-rare SVs in the B38 callset (N=14,623). (a) Histogram showing the number of ultra-rare SVs per individual, where ultra-rare is defined as “singleton” variants private to single individual or nuclear family. (b) Histogram showing the number of genes affected by ultra-rare SVs larger than 1 Mb in size.
Extended Data Figure 9.
Correlations between dosage sensitivity scores for CNV in the combined callset (N=17,795). (a) Results for deletion variants. “ExAC score” is the published ExAC DEL intolerance score. “CCDG score” is similarly calculated from our data, using CCDG deletions. “pLI” is the published loss-of-function intolerance score from ExAC. “HI.Z” is the negative of the inverse-normal transformed haploinsufficiency score from DECIPHER. “Ave.ccdg.exac” is the arithmetic mean of the CCDG and ExAC DEL intolerance scores. “Ave.ccdg.hi” is the arithmetic mean of the CCDG and HI-Z scores. Correlations shown are Spearman rank correlations (rho), p-values are from the 2-sided spearman rank correlation test, N represents the number of genes included in the test. (b) Results for duplication variants, using the same naming conventions as in part (a).
Figure 1.
Figure 1.
The public version of the B38 callset derived from 14,623 samples. (a) Self-reported ancestry. Abbreviations are as follows: AFR, African; AMR, admixed American; EAS, east Asian; FE, Finnish European; NFE, non-Finnish European; PI, Pacific Islander; SAS, South Asian. (b) Number of SVs per sample (x-axis, square-root scaled) by SV type (y-axis) and frequency class (panels labelled at top). SV classes are defined as: DEL, deletion; MEI, mobile element insertion; DUP, duplication; INV, inversion; BND, “break-end”, which is a generic term in the VCF specification for SV breakpoints that cannot be unequivocally classified. Minor allele frequency (MAF) bins are defined as: “ultra-rare” is private to an individual or family; “rare” is MAF<1%; “low-frequency” is 1%<MAF<5%; “common” is MAF>5%. (c) Number of high-confidence SVs by class and frequency bin. (d) CNV length distributions for each frequency class, defined as in part (b). (e) MAF distribution for SNV (N=85,687,916), indel (N=9,477,540), deletion (DEL, N=43,872) and duplication (DUP, N=10,805) variants for a subset of 4,298 samples for which GATK-based SNV/indel calls were also available. All boxplots in this figure indicate the median and the first and third quartiles.
Figure 2.
Figure 2.
Burden of rare gene-altering SV. (a) Per-sample mean number of gene alterations by type and frequency class, in 4,298 samples. (b) Per-sample mean number of rare (<1% MAF) high-confidence PTV by type and VEP consequence. (c) Per-sample mean number of rare (<1% MAF) SV-derived gene alterations by type. DEL and DUP are classified into ‘strong’ (affecting >20% of exons of principal transcript) and ‘weak’ (affecting <20% of exons of principal transcript) and subclassified as ‘internal’ (variant overlaps at least one coding exon, but neither the 3’ nor 5’ end of the principal transcript), 3prime (variants overlaps the 3’ end of the transcript), 5prime (variant overlap the 5’ end of the transcript), and complete (variant overlaps all coding exons in principal transcript), (d) (top) Fraction of rare (<1% MAF), gene-altering variants occurring in low pLI (pLI<0.9) vs. high pLI (pLI>=0.9) genes, by type, size class, and gene region, in the B38 callset (N=14,623). Error bars indicate 95% confidence intervals (Wilson score interval). The dotted line indicates the expected fraction, assuming a uniform distribution of SV in coding exons. (bottom) Singleton rates for gene-altering variants by type in the B38 callset (N=14,623), restricted to genes with pLI>0.1. Error bars indicate 95% Wilson score confidence intervals. See Supplementary Table 5 for the number of variants in each category.
Figure 3.
Figure 3.
Estimation of genome-wide burden of high-impact functional alleles. (a) Singleton rates for SNV, by VEP consequence and percentile of combined VEP/CADD impact score. (b) Singleton rates for indels. (c) Singleton rates by variant type and percentile of combined VEP/CADD impact score. Here, “other LoF” indicates VEP-annotated protein-truncating variants (PTVs) that are not classified as high-confidence by LOFTEE. DELs and DUPs that intersect any coding exon of the principal transcript are classified as “coding”; otherwise they are “noncoding”. The horizontal line shows the singleton rate for all high confidence SNV/indel LoFs. (d) Per-sample mean number of “strongly deleterious” alleles genome-wide, by type and frequency class. In panels (a)-(c), error bars indicate the 95% confidence interval (Wilson score method). See Supplementary Table 6 for counts of variants in each category.
Figure 4.
Figure 4.
Dosage-sensitivity of functional annotations. (a) Fraction of 1 kb genomic windows containing at least one CNV, as a function of distance to the nearest coding exon and the pLI of that gene. (b) Depletion of CNV in conserved genomic regions. Log-odds ratios for the occurrence of CNV in highly conserved (based of LINSIGHT or PHASTCONS percentile) vs. less-conserved regions. Odds ratios are Cochran-Mantel-Haenszel estimates, stratified by distance to and pLI of nearest coding exon. (c) Log-odds ratios (estimated as in (b)) for the occurrence of CNV in 1 kb windows intersecting various functional annotation tracks. (d) Log-odds ratios (estimated as in (b)) for the occurrence of CNV in 1 kb windows overlapping roadmap segmentations, stratified by the number of roadmap tissues in which the region is observed. All error bars indicate 95% confidence intervals estimated by block bootstrap.

Similar articles

Cited by

References

    1. Weischenfeldt J, Symmons O, Spitz F & Korbel JO Phenotypic impact of genomic structural variation: insights from and for human disease. Nat Rev Genet 14, 125–138, doi:10.1038/nrg3373 (2013). - DOI - PubMed
    1. Stranger BE et al. Relative impact of nucleotide and copy number variation on gene expression phenotypes. Science 315, 848–853, doi:315/5813/848 [pii] 10.1126/science.1136678 (2007). - DOI - PMC - PubMed
    1. Chiang C et al. The impact of structural variation on human gene expression. Nature genetics 49, 692–699, doi:10.1038/ng.3834 (2017). - DOI - PMC - PubMed
    1. Sudmant PH et al. An integrated map of structural variation in 2,504 human genomes. Nature 526, 75–81, doi:10.1038/nature15394 (2015). - DOI - PMC - PubMed
    1. Sebat J et al. Strong association of de novo copy number mutations with autism. Science 316, 445–449, doi:1138659 [pii] 10.1126/science.1138659 (2007). - DOI - PMC - PubMed

Publication types

Grants and funding