. 2020 May 24;9(5):1303.
doi: 10.3390/cells9051303.

Lung Tumor Cell-Derived Exosomes Promote M2 Macrophage Polarization

Affiliations

Lung Tumor Cell-Derived Exosomes Promote M2 Macrophage Polarization

Alexandra Pritchard et al. Cells. .

Abstract

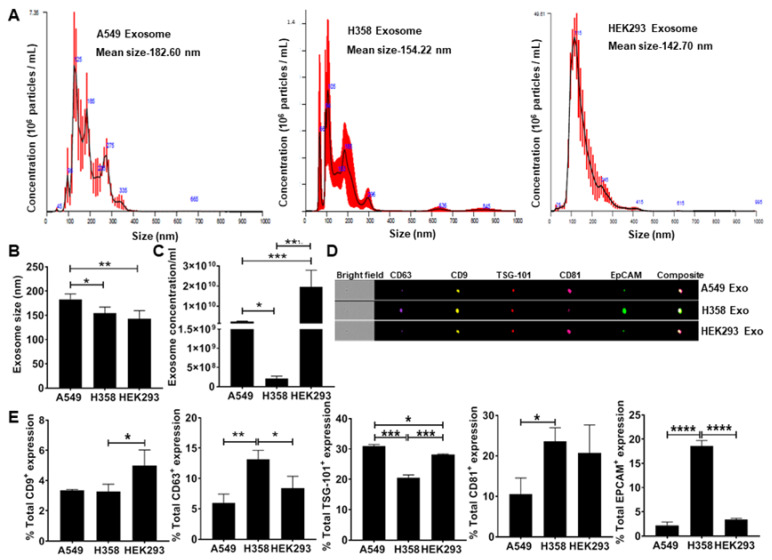
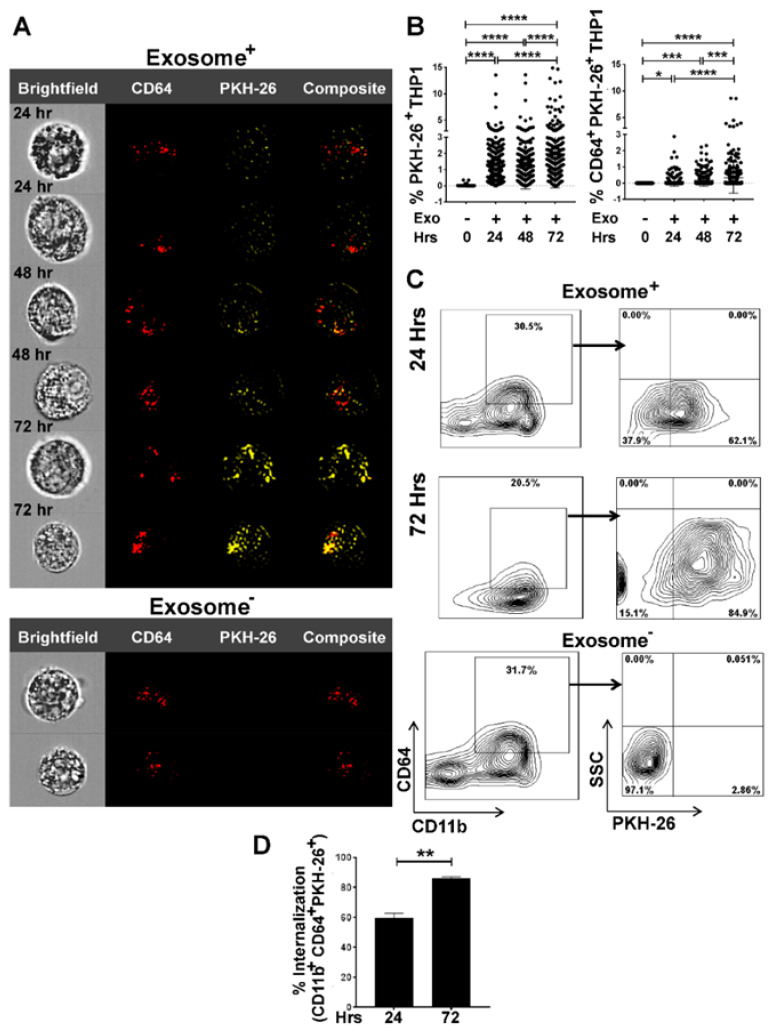
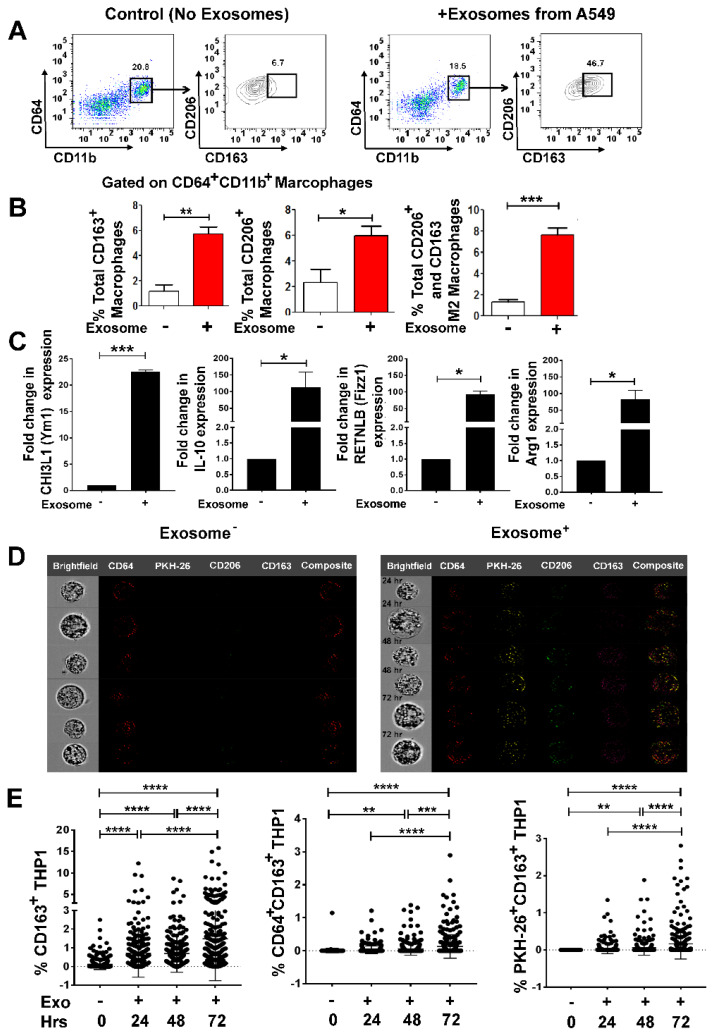
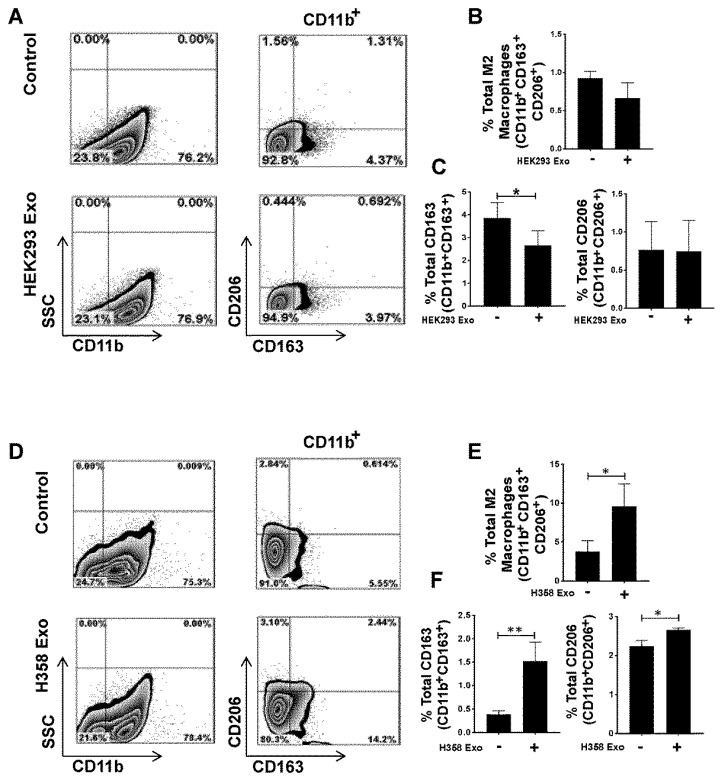
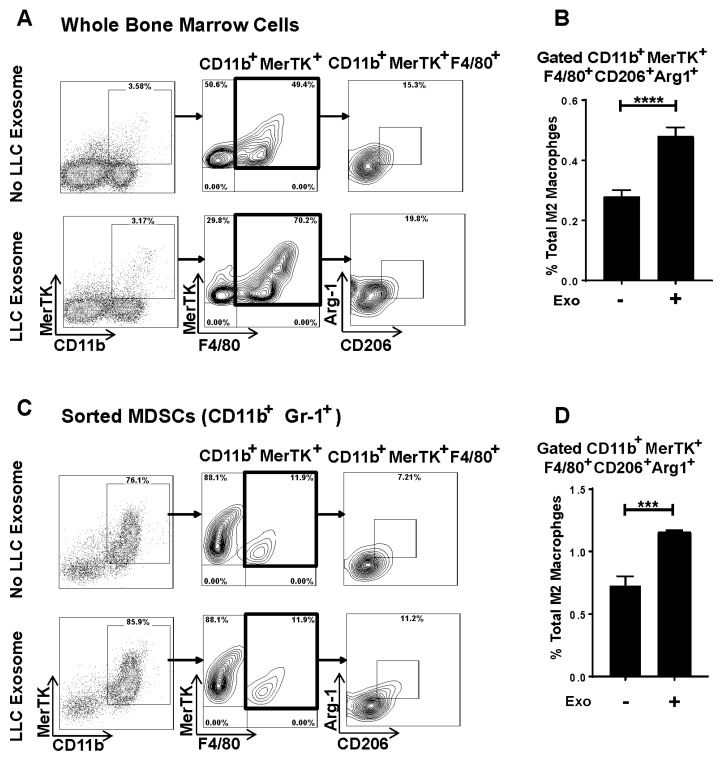
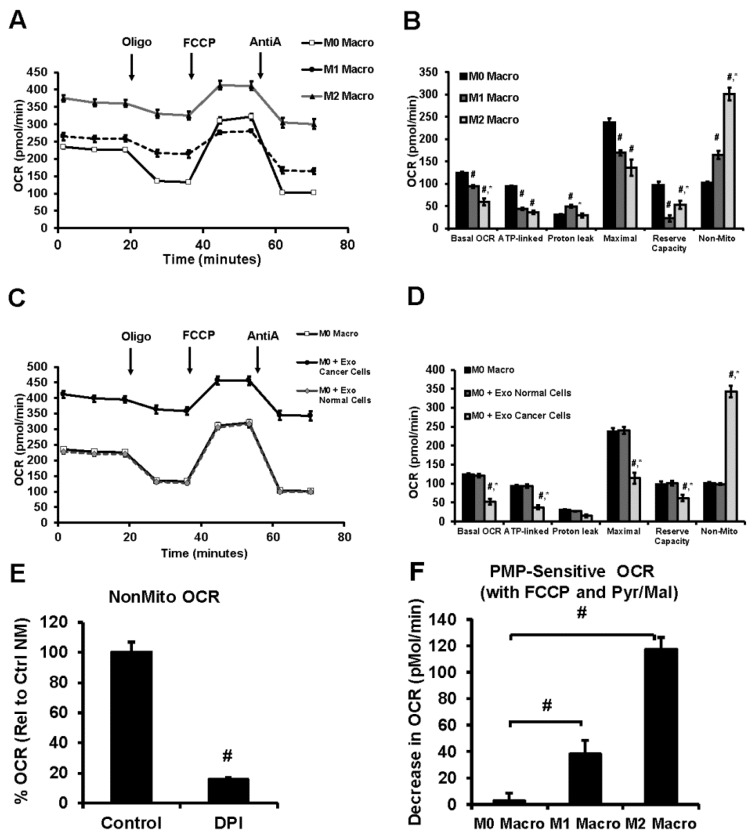
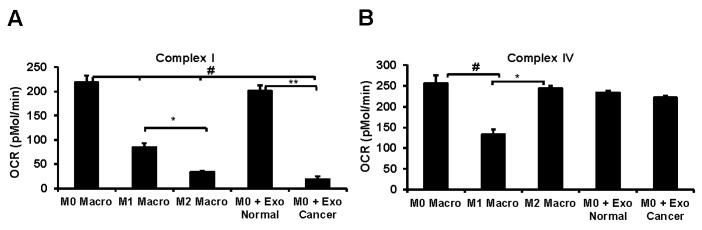
Cellular cross-talk within the tumor microenvironment (TME) by exosomes is known to promote tumor progression. Tumor promoting macrophages with an M2 phenotype are suppressors of anti-tumor immunity. However, the impact of tumor-derived exosomes in modulating macrophage polarization in the lung TME is largely unknown. Herein, we investigated if lung tumor-derived exosomes alter transcriptional and bioenergetic signatures of M0 macrophages and polarize them to an M2 phenotype. The concentration of exosomes produced by p53 null H358 lung tumor cells was significantly reduced compared to A549 (p53 wild-type) lung tumor cells, consistent with p53-mediated regulation of exosome production. In co-culture studies, M0 macrophages internalized tumor-derived exosomes, and differentiated into M2 phenotype. Importantly, we demonstrate that tumor-derived exosomes enhance the oxygen consumption rate of macrophages, altering their bioenergetic state consistent with that of M2 macrophages. In vitro co-cultures of M0 macrophages with H358 exosomes demonstrated that exosome-induced M2 polarization may be p53 independent. Murine bone marrow cells and bone marrow-derived myeloid-derived suppressor cells (MDSCs) co-cultured with lewis lung carcinoma (LLC)-derived exosomes differentiated to M2 macrophages. Collectively, these studies provide evidence for a novel role for lung tumor-exosomes in M2 macrophage polarization, which then offers new therapeutic targets for immunotherapy of lung cancer.

Keywords: M2 macrophages; exosomes; lung cancer; macrophage polarization; myeloid-derived suppressor cells; tumor associated macrophages.


Conflict of interest statement

The authors declare no conflict of interest.

Figures

Figure 1
Figure 1
Quantitation and characterization of tumor-cell derived exosomes. NanoSight and ImageStream analyses of A549-derived exosomes determined size, concentration, and characterization. Human lung cancer cells A549, H358, and non-tumor cells HEK293 were cultured in exosome depleted media for 24 h. Exosomes were isolated from cultured supernatant by using differential centrifugation (A) Mean size and concentration of A549 cell-derived exosome determined by NanoSight analysis, mean size was recorded as 182.6 nm, 154.22 nm, and 142.7 nm for A549, H358 and HEK293 cells respectively. (B) NanoSight data analysis showing the small size of H358 and HEK293 exosomes compared to A549 cell-derived exosomes. (C) NanoSight data analysis showing significantly reduced concentration of exosomes produced from 160 mL of culture media collected of p53 null human lung cancer cells H358 compared to A549 and HEK293 cell exosomes. (D) Representative Figure of ImageStream analysis to characterize A549 derived exosomes by expression signals of CD63, CD9, TSG-101, CD81, and EpCAM. (E) Percentage of total expression of conventional exosomes markers expressed over A549, H358 and HEK293 cell-exosomes respectively * p < 0.05, ** p < 0.01, *** p < 0.001, **** p < 0.0001.
Figure 2
Figure 2
ImageStream and flow cytometry analyses quantify time-dependent internalization of tumor cell-derived exosomes by THP-1 cells. THP-1 cells were seeded and differentiated into M0 macrophages upon overnight stimulation with PMA (20–100 ng/mL). M0 macrophages were then co-cultured with PKH-26 stained A549-derived exosomes in 10:1 ratio (10 exosomes/cell) for 24 to 72 h. Image Stream analysis showing Bright field, CD64+, PKH-26+, and composite images. (A) Time-dependent internalization of exosomes by CD64+ populations assessed by internalization of PKH-26 stained A549-derived exosomes. CD64+ population, without internalization indicates M0 phenotype. (B) MATLAB analysis of percentage of PKH-26+ and CD64+PKH-26+ signals to show time-dependent internalization of exosomes. Fluorescent signals were collected from 300 cells for each time point. (C) Representative flow cytometry of exosome internalization analysis at 24 h and 72 h. Group comparisons of 24 h exosome-, 24 h exosome+, and 72h exosome+ were made. After co-culture, cells were prepared for flow cytometry and stained with CD64, CD11b, and PKH-26. The experiment was repeated twice, with three replicates per sample in each experiment. Exosome- sample was used as control (D) Percentage of internalization by THP-1 macrophages as CD11b+CD64+PKH-26+ showing a significant increase of uptake in 72 h compared to 24 h * p < 0.05, ** p < 0.01, *** p < 0.001, **** p < 0.0001.
Figure 3
Figure 3
A549 cell-derived exosomes differentiate non-committed M0 macrophages to M2 phenotype. A549 human lung cancer cells were cultured in exosome depleted media for 24 h. Exosomes were isolated from cultured supernatant using differential centrifugation. Exosomes were stained with PKH-26 for overnight. THP-1 cells were seeded and transformed into M0 macrophages upon overnight stimulation with PMA (20–100 ng/mL). M0 macrophages were then co-cultured with PKH-26 stained, A549 derived exosomes in 10:1 ratio (10 exosomes/cell) for 24 to 72 h. (A) Representative flow cytometry plot showing in-vitro induction of M2 phenotype (CD11b+CD64+CD163+CD206+) with A549-derived exosomes. (B) Left to right panel-Total percentage of CD163+ macrophages, showing significant increase in CD163+ macrophages that have internalized PKH+ exosomes. Total percentage of CD206+ macrophages, showing significant induction in CD206+ macrophages that have internalized PKH+ exosomes. Total percentage of M2 macrophages as CD11b+CD64+CD163+CD206+ showing significantly induced M2 phenotypes with exosome-positive sample. (C) THP-1 cells were seeded and transformed into M0 macrophages upon overnight stimulation with PMA (20 ng/mL). M0 macrophages were then co-cultured with A549 derived exosomes in 10:1 ratio (10 exosomes/cell) for 24 h M2 gene signature, CHI3L1 (Ym1), IL-10, RETNLB (Fizz1), and Arg1 were upregulated on 24 h of A549-derived exosomes treatment, assessed by qRT-PCR in the cells. (D) ImageStream analyses showing CD64+, PKH-26+, CD206+ CD163+ macrophages before and after internalization of PKH+ exosomes. Left panel shows composite images from several M0 macrophages without exosome internalization. The right panel shows composite images of M0 macrophages with exosome internalization that have polarized to become M2 (CD206+ CD163+) (E) Time-dependent increase of M2 polarization induced by A549-derived exosomes showing by percentage of CD163+, CD64+CD163+ and PKH-26+CD163+ analyzed by using MATLAB analysis with the signals collected from 300 cells in each time points. * p < 0.05, ** p < 0.01, *** p < 0.001, **** p < 0.0001.
Figure 4
Figure 4
Non-tumor cell-derived exosomes are unable to promote M2 polarization but tumor cell-derived exosome-mediated M2 polarization is p53 independent. THP-1 cells were seeded and differentiated into M0 macrophages upon overnight stimulation with PMA (20–100 ng/mL). M0 macrophages were then co-cultured with non-tumor cell HEK293 and p53 null H358-derived exosomes in 10:1 (10 exosomes/cell) ratio for 72 h. (A) Representative flow cytometry plot showing lack of in vitro induction of M2 phenotype (CD11b+CD163+CD206+) with HEK293-derived exosomes. (B) Total percentage of M2 (CD11b+CD163+CD206+) macrophages, showing no significant difference with exosome-positive samples. (C) Total percentage of CD163+ and CD206+ macrophages, with or without HEK293 exosome-positive samples. (D) Representative flow cytometry plot showing in vitro induction of M2 phenotypes (CD11b+CD163+CD206+) with p53 null H358 cell-derived exosomes. (E) Total percentage of M2 (CD11b+CD163+CD206+) macrophages, showing a significant difference with H358 cells with exosomes. (F) Total percentage of CD163+ and CD206+ macrophages, with or without H358 exosome-positive samples. * p < 0.05, ** p < 0.01, *** p < 0.001, **** p < 0.0001.
Figure 5
Figure 5
Syngeneic lung cancer cell lewis lung carcinoma (LLC)-derived exosomes induce M2 polarization and also differentiate MDSCs to M2 phenotype. Bone marrow (BM) cells from wild type (WT) mice were seeded then co-cultured with LLC derived exosomes in 10:1 ratio (10 exosomes/cell) for 72 h. Cells were stained with antibodies (CD11b, MERTK, F4/80, Arginase-1 and CD206), and flow cytometry was performed to identify M2 phenotype. (A) Representative flow cytometry plot showing in-vitro induction of M2 phenotype (CD11b+MERTK+F4/80+CD206+Arginase-1+) upon co-culture with LLC cell-derived exosomes. (B) Total percentage of M2 macrophages (CD11b+MERTK+F4/80+CD206+Arginase-1+) showing significantly induced M2 phenotype with LLC exosome+ sample. (C) MDSCs (CD11b+Gr-1+) were immunosorted from BM cells of wild type (WT) mice then co-cultured with LLC-derived exosomes in 10:1 ratio (10 exosomes/cell) for 72 h. Cells were stained with antibodies (CD11b, MERTK, F4/80, Arginase-1 and CD206), and flow cytometry was performed to identify M2. Representative flow cytometry plot showing in-vitro polarization of MDSCs to M2 phenotype (CD11b+MERTK+F4/80+CD206+Arginase-1+) upon LLC cell-derived exosomes treatment. (D) Total percent of M2 macrophages (CD11b+MERTK+F4/80+CD206+Arginase-1+) showing significantly induced M2 phenotype following internalization of exosomes (*** p < 0.001).
Figure 6
Figure 6
Alterations in cellular bioenergetics of macrophages co-cultured with Tumor-derived exosomes by extracellular flux analysis. (A) Cellular bioenergetic profiles and (B) the cellular bioenergetic parameters (Basal OCR, ATP-linked OCR, Proton Leak, Maximal OCR, Reserve Capacity and Non-Mitochondrial OCR) of M0, M1 and M2 macrophages as determined by sequential injection of oligomycin (Oligo), FCCP, antimycin A (AntiA). Mean values from 6–8 replicates with ± sem. # p < 0.05 relative to M0 macrophages and * p < 0.05 relative to M1 macrophages. (C) Comparison of the cellular bioenergetic profiles of untreated M0 macrophages and those co-cultured with normal cell (HEK293) or tumor cell (A549)–derived exosomes, and (D) quantitation of the bioenergetic parameters of Figure 6C. Mean values from 6–8 replicates with ± sem. # p < 0.05 relative to M0 macrophages and * p < 0.05 relative to M0-co-culture with normal cells-derived exosomes. (E) Inhibition of nonmitochondrial OCR in nonpermeabilized macrophages using DPI. Mean values from 4–8 replicates with ± sem. # p < 0.005 compared to M0 macrophages; * p < 0.01 compared to M1 macrophages. (F) PMP-sensitive mitochondrial OCR in macrophages. Mean values from 3–8 replicates with ± sem. # p < 0.05 relative to M0 macrophages and * p < 0.05 relative to M0-co-culture with normal cells-derived exosomes.
Figure 7
Figure 7
Mitochondrial respiratory chain complex activities of macrophages co-cultured with normal or tumor cell-derived exosomes. (A) Mitochondrial complex I activity determined in the presence of pyruvate/malate substrate after permeabilizing the plasma membrane using plasma membrane permeabilizer (PMP) in macrophages that are either polarized or co-cultured with exosomes. # p < 0.01 relative to M0 macrophages, * p <0.05 relative to M1 macrophages and ** p <0.001 relative to M0 macrophages treated with normal exosomes. (B) Mitochondrial complex IV activity determined using Ascorbate/TMPD substrate in the presence of rotenone. # p <0.05 relative to M0 macrophages and * p <0.01 relative to M1 macrophages.

Similar articles

Cited by

References

    1. Siegel R.L., Miller K.D., Jemal A. Cancer statistics, 2018. Cancer J. Clin. 2018;68:7–30. doi: 10.3322/caac.21442. - DOI - PubMed
    1. Cancer Facts and Figures. [(accessed on 1 April 2020)];2017 Available online: https://www.cancer.org/research/cancer-facts-statistics/all-cancer-facts....
    1. World Health Organization . The Global Burden of Disease: 2004 Update. World Health Organization; Geneva, Switzerland: 2004.
    1. Woo E.Y., Chu C.S., Goletz T.J., Schlienger K., Yeh H., Coukos G., Rubin S.C., Kaiser L.R., June C.H. Regulatory CD4(+)CD25(+) T cells in tumors from patients with early-stage non-small cell lung cancer and late-stage ovarian cancer. Cancer Res. 2001;61:4766–4772. - PubMed
    1. Ugel S., De Sanctis F., Mandruzzato S., Bronte V. Tumor-induced myeloid deviation: When myeloid-derived suppressor cells meet tumor-associated macrophages. J. Clin. Investig. 2015;125:3365–3376. doi: 10.1172/JCI80006. - DOI - PMC - PubMed

Publication types

MeSH terms

Substances