. 2020 Jul 1;40(27):5161-5176.
doi: 10.1523/JNEUROSCI.2501-19.2020. Epub 2020 May 22.

Effect of Aβ Oligomers on Neuronal APP Triggers a Vicious Cycle Leading to the Propagation of Synaptic Plasticity Alterations to Healthy Neurons

Affiliations

Effect of Aβ Oligomers on Neuronal APP Triggers a Vicious Cycle Leading to the Propagation of Synaptic Plasticity Alterations to Healthy Neurons

Marta Rolland et al. J Neurosci. .

Abstract

Alterations of excitatory synaptic function are the strongest correlate to the pathologic disturbance of cognitive ability observed in the early stages of Alzheimer's disease (AD). This pathologic feature is driven by amyloid-β oligomers (Aβos) and propagates from neuron to neuron. Here, we investigated the mechanism by which Aβos affect the function of synapses and how these alterations propagate to surrounding healthy neurons. We used complementary techniques ranging from electrophysiological recordings and molecular biology to confocal microscopy in primary cortical cultures, and from acute hippocampal and cortical slices from male wild-type and amyloid precursor protein (APP) knock-out (KO) mice to assess the effects of Aβos on glutamatergic transmission, synaptic plasticity, and dendritic spine structure. We showed that extracellular application of Aβos reduced glutamatergic synaptic transmission and long-term potentiation. These alterations were not observed in APP KO neurons, suggesting that APP expression is required. We demonstrated that Aβos/APP interaction increases the amyloidogenic processing of APP leading to intracellular accumulation of newly produced Aβos. Intracellular Aβos participate in synaptic dysfunctions as shown by pharmacological inhibition of APP processing or by intraneuronal infusion of an antibody raised against Aβos. Furthermore, we provide evidence that following APP processing, extracellular release of Aβos mediates the propagation of the synaptic pathology characterized by a decreased spine density of neighboring healthy neurons in an APP-dependent manner. Together, our data unveil a complementary role for Aβos in AD, while intracellular Aβos alter synaptic function, extracellular Aβos promote a vicious cycle that propagates synaptic pathology from diseased to healthy neurons.SIGNIFICANCE STATEMENT Here we provide the proof that a vicious cycle between extracellular and intracellular pools of Aβ oligomers (Aβos) is required for the spreading of Alzheimer's disease (AD) pathology. We showed that extracellular Aβos propagate excitatory synaptic alterations by promoting amyloid precursor protein (APP) processing. Our results also suggest that subsequent to APP cleavage two pools of Aβos are produced. One pool accumulates inside the cytosol, inducing the loss of synaptic plasticity potential. The other pool is released into the extracellular space and contributes to the propagation of the pathology from diseased to healthy neurons. Pharmacological strategies targeting the proteolytic cleavage of APP disrupt the relationship between extracellular and intracellular Aβ, providing a therapeutic approach for the disease.

Keywords: APP KO mice; APP processing; Alzheimer's disease; NMDA-dependent synaptic transmission; synaptic plasticity; β- and γ-secretase inhibition.


Figures

Figure 1.
Figure 1.
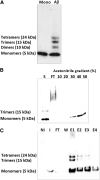
Analysis of experimental Aβ oligomers solution. A, Western blot analysis of experimental solutions of Aβ that display a composition of monomers and various oligomeric forms of Aβ (dimers to tetramers). B, SDS-PAGE analysis of Aβ monomers after purification on the C18 column. All fractions were electrophoresed on 15% tris-glycine gel. Aβ monomers are mainly eluted at 30% acetonitrile. S, Sample loaded; FT, flow through, peptides eluted at 30%, 40%, and 50% acetonitrile. C, SDS-PAGE analysis of murine Aβ after purification on affinity chromatography on a Nickel column. All fractions were electrophoresed on a 15% tris-glycine gel. Aβ monomers are eluted in PBS containing 250 mm imidazole. Solutions of murine Aβ display a composition of monomers, trimers, and tetramers. NI, Noninduced bacterial extract; I, induced bacterial extract FT, flow through; W, washes, peptides eluted in the four first fractions.
Figure 2.
Figure 2.
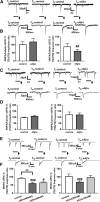
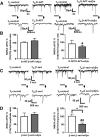
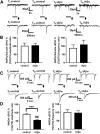
eAβos perturb spontaneous synaptic activity in cultures of mouse cortical neurons. A, Representative traces of AMPA/kainate sEPSCs at T0 and T20 in control condition or with eAβos (300 nm). B, Bar graphs (mean ± SEM) showing the T20/T0 ratio of AMPA/kainate sEPSC amplitudes and frequencies in control condition (white bars; n = 10 neurons, Wilcoxon W = −17(19, −36), p = 0.4316, for sEPSC amplitudes; and Wilcoxon W = −2(13, −15) p = 0.9375 for sEPSC frequencies); with eAβos (gray bars; n = 10 neurons, Wilcoxon W = −15(20, −35), p = 0.4922, for sEPSC amplitudes; and Wilcoxon W = −49(3, −52), p = 0.0098, for sEPSC frequencies). Control versus eAβos (Mann–Whitney U = 44(99, 111), p = 0.6842, for sEPSC amplitudes; and Mann–Whitney U = 38(117, 93), p = 0.3923, for sEPSC frequencies). C, Representative traces of AMPA/kainate mEPSCs at T0 and T20 in control condition or with eAβos (300 nm). D, Bar graphs (mean ± SEM) showing the T20/T0 ratio of AMPA/kainate mEPSCs amplitude and frequency in control condition (white bars; n = 7 neurons, Wilcoxon W = −14(7, −21), p = 0.2969, for mEPSC amplitudes; and Wilcoxon W = 4(5, −1), p = 0.5000, for mEPSC frequencies) or with eAβos (gray bars; n = 6 neurons, Wilcoxon W = 15(30, −15), p = 0.42, for mEPSC amplitudes; and Wilcoxon W = 10(19, −9), p = 0.46, for mEPSC frequencies). Control versus eAβos (Mann–Whitney U = 19 (47, 106), p = 0.13, for mEPSC amplitudes; and Mann–Whitney U = 34(64, 89), p = 0.96, for mEPSC frequencies). E, Representative traces of NMDA sEPSCs at T0 and T20 in control condition or with eAβos (300 nm). F, Bar graphs (mean ± SEM) showing the T20/T0 ratio of NMDA sEPSC amplitudes and frequencies in control condition (white bars; n = 13 neurons, Wilcoxon W = −55(18, −73), p= 0.0574, for sEPSC amplitudes; and Wilcoxon W = −21 (12, −33), p = 0.2383 for sEPSC frequencies); with eAβos (300 nm; gray bars; n = 17 neurons, Wilcoxon W = −137 (8, −145), p = 0.0004, for sEPSC amplitudes; and Wilcoxon W = −97(4, −101), p = 0.0009, for sEPSC frequencies) or with eAβos (100 nm; light gray bars; n = 7 neurons, Wilcoxon W = −28(0, −28), p = 0.0156, for sEPSC amplitudes; and Wilcoxon W = −1 (1, −2), p > 0.9999, for sEPSC frequencies). One-way ANOVA and Tukey's post hoc test for multiple comparisons (F(2,34) = 6.937; p = 0.0030; control vs eAβos (300 nm), p = 0.0028) for NMDA sEPSC amplitudes and Kruskal–Wallis followed by Dunn's multiple-comparisons test (6.473; p = 0.0393) for NMDA sEPSC frequencies. **p < 0.01; #p < 0.05, ##p < 0.01, ###p < 0.001 relative to the T0 recording normalized to 100%.
Figure 3.
Figure 3.
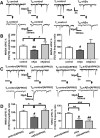
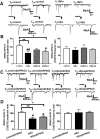
eAβos reduce NMDA sEPSC amplitude in cortical slice neurons from WT but not from APP KO mice. A, Representative traces of NMDA sEPSCs recorded in WT neurons from Swiss mice at T0 and T20 in control condition; with eAβos. B, Bar graphs (mean ± SEM) showing the T20/T0 ratio of NMDA sEPSC amplitude and frequency recorded in WT neurons from Swiss mice in control condition (white bars; n = 11 neurons, N = 9 mice, Wilcoxon W = 22(44, −22), p = 0.3652, for sEPSC amplitudes; and Wilcoxon W = −16(25, −41), p = 0.5195, for sEPSC frequencies); with eAβos (gray bars; n = 16 neurons, N = 8 mice, Wilcoxon W = −114(11, −125), p = 0.0017, for sEPSC amplitudes; and Wilcoxon W = −84(26, −110), p = 0.0290 for sEPSC frequencies); with eAβ monomers [eAβ(mo), 300 nm; light gray bars; n = 8 neurons, N = 4 mice, Wilcoxon W = 6(21, −15), p = 0.7422, for sEPSC amplitudes; and Wilcoxon W = 8(22, −14), p = 0.6406, for sEPSC frequencies). One-way ANOVA and Tukey's post hoc test for multiple comparisons (F(2,32) = 5.578, p = 0.0084; control vs eAβos; p = 0.0423, eAβos vs eAβ(mo), p = 0.0143] for NMDA sEPSC amplitudes and Kruskal–Wallis followed by Dunn's multiple-comparisons test (5.076, p = 0.0790, for NMDA sEPSC frequencies. C, Representative traces of NMDA sEPSCs recorded in APP KO neurons at T0 and T20 in control condition, with eAβos. D, Bar graphs (mean ± SEM) showing the T20/T0 ratio of NMDA sEPSC amplitude and frequency recorded in APP KO neurons in control condition (white bars; n = 6 neurons, N = 6 mice, Wilcoxon W = 1(11, −10), p > 0.9999, for sEPSC amplitudes; and Wilcoxon W = −3(9, −12), p = 0.8438, for sEPSC frequencies); in WT neurons from C57BL/6J mice with eAβos (gray bars; n = 6 neurons, N = 3 mice, Wilcoxon W = −21(0, −21), p = 0.0313, for sEPSC amplitudes; and Wilcoxon W = −21(0, −21), p = 0.0313, for sEPSC frequencies); in APP KO neurons with eAβos (light gray bars; n = 8 neurons, N = 5 mice, Wilcoxon W = 18(27, −9), p = 0.2500, for sEPSC amplitudes; and Wilcoxon W = −36(0, −36), p = 0.0078, for sEPSC frequencies). One-way ANOVA and Tukey's post hoc test for multiple comparisons [F(2,17) = 6.792; p = 0.0068; control(APP KO) vs eAβos p = 0.0298; eAβos vs eAβos (APP KO), p = 0.0072] for NMDA sEPSC amplitudes, and one-way ANOVA followed by Tukey's post hoc test for multiple comparisons [F(2,18) = 11.64; p = 0.0006; control(APP KO) vs eAβos, p = 0.0041; control(APP KO) vs eAβos (APP KO), p = 0.0008] for NMDA sEPSC frequencies. *p < 0.05, **p < 0.01, ***p < 0.001; #p < 0.05, ##p < 0.01 relative to the T0 recording normalized to 100%.
Figure 4.
Figure 4.
Overexpression of APPwt. APPswe in cortical cell cultures decreases the spine density of neighboring healthy wild-type neuron, in an APP-dependent manner. A, Representative confocal images of cultured cortical neurons where the neuron on the left is overexpressing either LA-GFP only (LA-GFP), APPwt-mCh (APPwt), APPswe-mCh (APPswe), or APP KO neurons that overexpress APPswe-mCh (APP KO+swe), and the neuron on the right is only overexpressing LA-GFP (healthy neuron). Scale bar, 10 µm. B, Bar graphs (mean ± SEM) show the spine density of healthy neurons depending on the distance from (LA-GFP, APPwt, APPswe, or APP KO+swe) neurons (n = at least 3 neurons/condition from three different cultures). Two-way ANOVA and Tukey's post hoc test for multiple comparisons. Spine density of healthy neurons according to the distance from the APP-overexpressing neuron (F(6,168) = 5.309; p < 0.0001; treatment: F(5,168) = 51.6, p < 0.0001, interaction: F(30,168) = 3.484, p < 0.0001). From 0 to 10 μm: LA-GFP versus APPwt, p < 0.0001; LA-GFP vs APPswe, p < 0.0001; APPswe vs APP KO+swe, p < 0.0001. From 20 to 30 μm: LA-GFP vs APPwt, p = 0.0487; LA-GFP vs APPswe, p < 0.0001. From 30 to 40 μm: LA-GFP vs APPswe, p < 0.0001. *p < 0.05, ***p < 0.001 when compared with control condition (both neurons only overexpress LA-GFP) at equivalent distance. ###p < 0.001 when healthy neurons in APP KO plus the swe condition are compared with healthy neurons in the APPswe condition.
Figure 5.
Figure 5.
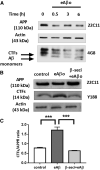
eAβos induce APP processing through amyloidogenic pathway. A, Representative Western blot of endogenous APP and its proteolytic fragments in a whole lysate extract of cortical neurons (14 DIVs) exposed to eAβos for 30 min. B, Top, Representative Western blot of endogenous APP and CTFs in a whole-lysate extract of cortical neurons (14 DIVs) exposed to eAβos with or without β-secretase inhibitor (β-seci; 1 μm) for 30 min. C, Quantification of APP full-length (APPfl) and APP proteolytic CTFs in control (n = 7 independent experiments), in the presence of eAβos (n = 7 independent experiments), in the presence of eAβos plus β-secretase inhibitor (n = 4 independent experiments). Results (mean ± SEM) are expressed as the ratio of APP CTFs over full-length APP. One-way ANOVA and Tukey's post hoc test for multiple comparisons (F(2,15) = 27.83, p < 0.0001; control vs eAβos, p < 0.0001; eAβos vs β-seci+eAβos p < 0.0001. ***p < 0.001.
Figure 6.
Figure 6.
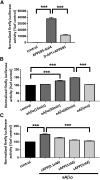
eAβos promote APP processing through γ-secretase activity. A, Quantification of Firefly Luciferase activity when N2a cells were cotransfected with pFR-Luc Firefly Luciferase reporter gene plasmid and phRL-TK Renilla Luciferase plasmid (control; n = 4 independent experiments); cotransfected with pFR-Luc Firefly Luciferase reporter gene plasmid, phRL-TK Renilla luciferase plasmid, and with a plasmid coding for APP695-Gal4 (n = 4independent experiments); cotransfected with pFR-Luc Firefly Luciferase reporter gene plasmid, phRL-TK Renilla Luciferase plasmid, and with a plasmid coding for APP695-Gal4 in the presence of DAPT (5 μm; n = 4 independent experiments). Results are expressed as a percentage of control (N2a not cotransfected with APP695-Gal4). One-way ANOVA and Tukey's post hoc test for multiple comparisons (F(2,9) = 174.3, p < 0.0001; control vs APP695-Gal4, p < 0.0001; APP695-Gal4 vs DAPT+APP695, p < 0.0001). B, Quantification of Firefly Luciferase activity when N2a cotransfected with pFR-Luc Firefly Luciferase reporter gene plasmid, phRL-TK Renilla Luciferase plasmid, and a plasmid coding for APP695-Gal4 were treated with eAβos for 15, 30, and 60 min (n = 4 independent experiments) and with eAβ(mo) for 60 min (n = 3 independent experiments). Results are expressed as a percentage of control (N2a not exposed to eAβos). One-way ANOVA and Tukey's post hoc test for multiple comparisons [F(4,14) = 139.9, p < 0.0001; control vs eAβos (30 min), p < 0.0001; control vs eAβos (60 min), p < 0.0001; eAβos (60 min) vs eAβ(mo), p < 0.0001]. C, Quantification of Firefly Luciferase activity when N2a cells cotransfected with pFR-Luc firefly luciferase reporter gene plasmid, phRL-TK Renilla luciferase plasmid, and a plasmid coding for APP695-Gal4 were pretreated with various concentration of secreted soluble APP fragment (sAPP) and then exposed with eAβos for 60 min (n = 3 independent experiments). Results are expressed as a percentage of control (N2a not exposed to eAβos). One-way ANOVA and Tukey's post hoc test for multiple comparisons [F(4,10) = 138.9, p < 0.0001; control vs eAβos, p < 0.0001; eAβos vs sAPP(5 nm), p < 0.0001]. ***p < 0.001.
Figure 7.
Figure 7.
Alteration of NMDA sEPSCs amplitude in cortical slice neurons by eAβos depends on APP cleavage by γ-secretase and β-secretase. A, Representative traces of NMDA sEPSCs at T0 and T20 with DAPT (5 μm); with DAPT (5 μm) plus eAβos. B, Bar graphs (mean ± SEM) showing the T20/T0 ratio of NMDA sEPSCs amplitude and frequency with DAPT (white bars; n = 7 neurons, N = 4 mice, Wilcoxon W = 4(16, −12), p = 0.8125, for sEPSCs amplitude; and Wilcoxon W = −4(12, −16), p = 0.8125, for sEPSCs frequency); with DAPT plus eAβos (gray bars; n = 10 neurons, N = 5 mice, Wilcoxon W = 1(11, −10), p > 0.9999, for sEPSCs amplitude; and Wilcoxon W = −43(6, −49), p = 0.0273, for sEPSCs frequency). DAPT versus DAPT plus eAβos (Mann–Whitney U = 33(61, 92), p = 0.8868, for sEPSCs amplitude; and Mann–Whitney U = 30.5(67.5, 85.5), p = 0.6874, for sEPSCs frequency). C, Representative traces of NMDA sEPSCs at T0 and T20 with β-secretase inhibitor (1 μm); with β-secretase inhibitor (1 μm) plus eAβos. D, Bar graphs (mean ± SEM) showing the T20/T0 ratio of NMDA sEPSC amplitude and frequency with β-secretase inhibitor (white bars; n = 6 neurons, N = 4 mice, Wilcoxon W = 1(11, −10), p > 0.9999, for sEPSCs amplitude; and Wilcoxon W = 1(11, −10), p > 0.9999, for sEPSCs frequency); with β-secretase inhibitor plus eAβos (gray bars; n = 8 neurons, N = 3 mice, Wilcoxon W = 12 (24, −12), p = 0.4609, for sEPSCs amplitude; and Wilcoxon W = −36(0, −36), p = 0.0078, for sEPSCs frequency). β-Secretase inhibitor versus β-secretase inhibitor plus eAβos (Mann–Whitney U = 17(38, 67), p = 0.4136, for sEPSC amplitude; and Mann–Whitney U = 5(64, 41), p = 0.0127, for sEPSC frequency). *p < 0.05; #p < 0.05, ##p < 0.01 relative to the T0 recording normalized to 100%.
Figure 8.
Figure 8.
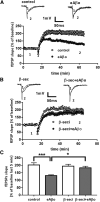
β-Secretase inhibition prevents the long-term plasticity inhibition induced by eAβos. A, Data are the mean (±SEM), and they are expressed as percentages of fEPSP slope baseline in the control condition (white circle; n = 11 slices, N = 6 mice); with eAβos (gray circle; n = 12 slices, N = 8 mice). Representative traces from one experiment are shown. They were extracted at the times indicated (1, 2) on the graph. B, Data are the mean (±SEM), and they are expressed as percentages of fEPSP slope baseline with β-secretase inhibitor (1 μm; white triangle; n = 9 slices, N = 5 mice); with β-secretase inhibitor plus eAβos (1 μm; gray triangle; n = 8 slices, N = 4 mice). Representative traces from one experiment are shown. They were extracted at the times indicated (1, 2) on the graph. C, Summary bar graph depicting the effect of various experimental conditions on LTP. On the graph, data are the mean (±SEM), and they are expressed as percentages of fEPSP slope baseline measured during the 5 last min of recordings in control condition (white bar); with eAβos (gray bar); with β-secretase inhibitor (white bar); and with β-secretase inhibitor plus eAβos (gray bar). One-way ANOVA and Tukey's post hoc test for multiple comparisons: F(3,36) = 8.288, p = 0.0003; control vs eAβos, p = 0.0003; eAβos vs β-seci+eAβos, p = 0.0218. *p < 0.05, ***p < 0.001.
Figure 9.
Figure 9.
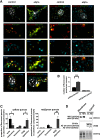
eAβos-induced processing of APP leads to the accumulation of cytosolic Aβ oligomers. A, Airyscan images of cortical neurons transfected with mcherry-APPsw-EYFP, treated or not with eAβos for 30 min and immunostained with EEA1, LAMP2, and 58K Golgi protein antibodies (blue).White rectangle areas indicate higher magnification used for fluorescent puncta quantification. Red arrows and red stars indicate respectively colocalized yellow puncta or red puncta with EEA1 or LAMP2 vesicles, yellow arrows, and yellow stars indicate, respectively, noncolocalized yellow puncta or red puncta with EEA1 or LAMP2 vesicles. Wide-field scale bar, 5 µm. Magnification scale bar, 1 µm. B, Number of yellow puncta or red/green puncta in cortical neurons treated (gray bars) or not (black bars) with eAβos. For yellow puncta, one-way ANOVA and Tukey's post hoc test for multiple comparisons (F(3,44) = 83.58, p < 0.0001; control vs eAβos, p < 0.001. C, Proportion of yellow or red/green puncta in the different subcellular compartments in cortical neurons treated (gray bars) or not (black bars) with eAβos. For yellow puncta, one-way ANOVA and Tukey's post hoc test for multiple comparisons (F(5,35) = 7.35, p < 0.0001; for early endosomes: control vs eAβos, p = 0.0481; for Golgi apparatus: control vs eAβos, p = 0.0495). For red/green puncta, one-way ANOVA and Tukey's post hoc test for multiple comparisons (F(5,29) = 7.089, p = 0.0002; for Golgi apparatus: control vs eAβos, p = 0.0017. *p < 0.05, **p < 0.01, ***p < 0.001. Data are presented as the mean ± SEM. D, Western blot analysis of APP full-length and APP fragments in membrane or cytosol fractions obtained from cortical neurons exposed or not with eAβos for 30 min.
Figure 10.
Figure 10.
iAβos perturb spontaneous synaptic activity in cultures of mouse cortical neurons. A, Representative traces of AMPA/NMDA sEPSCs at T0 and T20 in control condition or with iAβos (300 nm). B, Bar graphs (mean ± SEM) showing the T20/T0 ratio of AMPA/kainate sEPSC amplitude and frequency in control condition (white bars; n = 10 neurons, Wilcoxon W = −17(19, −36), p = 0.43, for sEPSC amplitudes; and Wilcoxon W = −2(13, −15), p = 0.93, for sEPSC frequencies) or with iAβos (black bars; n = 11 neurons, Wilcoxon W = 2(34, −32), p = 0.9658, for sEPSC amplitudes; and Wilcoxon W = −18(24, −42), p = 0.46, for sEPSC frequencies). Control versus iAβos for AMPA sEPSCs (Mann–Whitney U = 47(102, 129), p = 0.6047, for sEPSC amplitudes; and Mann–Whitney U = 50 (105, 126), p = 0.7561, for sEPSC frequencies). C, Representative traces of NMDA sEPSCs at T0 and T20 in control condition; with iAβos (300 nm). D, Bar graphs (mean ± SEM) showing the T20/T0 ratio of NMDA sEPSC amplitudes and frequencies in control condition (white bars; n = 13 neurons, Wilcoxon W = −55(18, −73), p = 0.0574, for sEPSC amplitudes; and Wilcoxon W = −21(12, −33), p = 0.2383, for sEPSC frequencies); with iAβos (black bars, n = 9 neurons, WilcoxonW = −45(0, −45), p = 0.0039, for sEPSC amplitudes; and Wilcoxon W = −5(11.5, −16.5), p = 0.7188, for sEPSC frequencies). Control versus iAβos for NMDA sEPSCs (Mann–Whitney U = 6(202, 51), p = 0.0001, for sEPSC amplitudes; and Mann–Whitney U = 54.5(145.5, 107.5), p = 0.8041, for sEPSC frequencies). ***p < 0.001; ##p < 0.01, relative to the T0 recording normalized to 100%.
Figure 11.
Figure 11.
iAβos reduces NMDA currents amplitude in cortical slice neurons from both WT and APP KO mice. A, Representative traces of NMDA sEPSCs recorded in WT neurons from Swiss mice at T0 and T20 in control condition; with iAβos. B, Bar graphs (mean ± SEM) showing the T20/T0 ratio of NMDA sEPSC amplitude and frequency recorded in WT neurons from Swiss mice in control condition (white bars; n = 11 neurons, N = 9 mice, Wilcoxon W = 22(44, −22), p = 0.3652, for sEPSC amplitudes; and Wilcoxon W = −16(25, −41), p = 0.5195, for sEPSC frequencies); with iAβos (black bars; n = 8, N = 6 mice, Wilcoxon W = −36(0, −36), p = 0.0078, for sEPSC amplitudes; and Wilcoxon W = −14(11, −25), p = 0.3828, for sEPSC frequencies); with iAβmo (gray bars; n = 8, N = 4 mice, Wilcoxon W = −31(12, −43), p = 0.1309, for sEPSC amplitudes; and Wilcoxon W = −9(23, −32), p = 0.6953, for sEPSC frequencies); and with murine iAβ (iAβ(mu)), 300 nm; gray bar; n = 9 neurons, N = 4 mice, Wilcoxon W = −39(42, −3), p = 0.0195, for sEPSC amplitudes; and Wilcoxon W = 26(31, −5), p = 0.0781, for sEPSC frequencies). One-way ANOVA and Tukey's post hoc test for multiple comparisons (F(3,34) = 4.555, p = 0.0087; control vs iAβos, p = 0.0090; control vs (iAβ(mu)), p = 0.0412, for NMDA sEPSCs amplitudes) and one-way ANOVA followed by Tukey's post hoc test for multiple comparisons (F(3,34) = 0.1971, p = 0.8977 for NMDA sEPSC frequencies). C, Representative traces of NMDA sEPSCs recorded in APP KO neurons at T0 and T20 in control condition, with iAβos. D, Bar graphs (mean ± SEM) showing the T20/T0 ratio of NMDA sEPSC amplitudes and frequencies recorded in APP KO neurons in control condition (white bars; n = 6 neurons, N = 6 mice, Wilcoxon W = 1(11, −10), p > 0.9999, for sEPSC amplitudes; and Wilcoxon W = −3(9, −12), p = 0.8438, for sEPSC frequencies); in WT neurons from C57BL/6J mice with iAβos (black bars; n = 7 neurons, N = 3 mice Wilcoxon W = −28(0, −28), p = 0.0156, for sEPSC amplitudes; and Wilcoxon W = 3(12, −9), p = 0.8438, for sEPSC frequencies), and APP KO neurons with iAβos (gray bars; n = 8 neurons, N = 3 mice, Wilcoxon W = −32(2, −34), p = 0.0234, for sEPSC amplitudes; and Wilcoxon W = 10(23, −13), p = 0.5469, for sEPSCs frequencies). One-way ANOVA and Tukey's post hoc test for multiple comparisons [F(2,18) = 6.754, p = 0.0065; control(APP KO) vs iAβos, p = 0.0058; control(APP KO) vs iAβos (APP KO), p = 0,0382, for NMDA sEPSC amplitudes; and one-way ANOVA followed by Tukey's post hoc test for multiple comparisons (F(2,18) = 0.07,348, p = 0.9294, for NMDA sEPSC frequencies). *p < 0.05, **p < 0.01; #p < 0.05, ##p < 0.01 relative to the T0 recording normalized to 100%.
Figure 12.
Figure 12.
Inhibition of NMDA-dependent synaptic transmission by eAβos is prevented by an antibody directed against Aβ infused into neurons. A, Representative traces of NMDA sEPSCs at T0 and T20 with i4G8 antibody (1:100, 10 μg/ml); with i4G8 antibody (1:100, 10 μg/ml) plus eAβos. B, Bar graphs (mean ± SEM) showing the T20/T0 ratio of sEPSC amplitude and frequency with i4G8 antibody (white bars; n = 6 neurons, N = 3 mice, Wilcoxon W = −5(8, −13), p = 0.68, for sEPSC amplitudes; and Wilcoxon W = −7(4, −11), p = 0.43, for sEPSC frequencies); i4G8 antibody plus eAβos (black bars; n = 8 neurons, N = 6 mice, Wilcoxon W = −20(8, −28), p = 0.19, for sEPSC amplitudes; and Wilcoxon W = −32(2, −34), p = 0.02, for sEPSC frequencies). i4G8 versus i4G8 plus eAβos (Mann–Whitney U = 21(42, 63), p = 0.75, for sEPSC amplitudes; and Mann–Whitney U = 8(61,44), p = 0.04, for sEPSC frequencies). *p < 0.05; #p < 0.05 relative to the T0 recording normalized to 100%.

Similar articles

Cited by

References

    1. Bayer TA, Wirths O (2010) Intracellular accumulation of amyloid-beta—a predictor for synaptic dysfunction and neuron loss in Alzheimer's disease. Front Aging Neurosci 2:8. - PMC - PubMed
    1. Brown JT, Chin J, Leiser SC, Pangalos MN, Randall AD (2011) Altered intrinsic neuronal excitability and reduced Na+ currents in a mouse model of Alzheimer's disease. Neurobiol Aging 32:2109.e1–14. 10.1016/j.neurobiolaging.2011.05.025 - DOI - PubMed
    1. Capetillo-Zarate E, Gracia L, Yu F, Banfelder JR, Lin MT, Tampellini D, Gouras GK (2011) High-resolution 3D reconstruction reveals intra-synaptic amyloid fibrils. Am J Pathol 179:2551–2558. 10.1016/j.ajpath.2011.07.045 - DOI - PMC - PubMed
    1. Chen BS, Roche KW (2007) Regulation of NMDA Receptors by Phosphorylation. Neuropharmacology 53:362–368. 10.1016/j.neuropharm.2007.05.018 - DOI - PMC - PubMed
    1. Cipriani G, Dolciotti C, Picchi L, Bonuccelli U (2011) Alzheimer and his disease: a brief history. Neurol Sci 32:275–279. 10.1007/s10072-010-0454-7 - DOI - PubMed

Publication types

MeSH terms