

The Importance of Muscle Versus Fat Mass in Sarcopenic Obesity: A Re-evaluation Using D3-Creatine Muscle Mass Versus DXA Lean Mass Measurements
- PMID: 32436565
- PMCID: PMC7302180
- DOI: 10.1093/gerona/glaa064
The Importance of Muscle Versus Fat Mass in Sarcopenic Obesity: A Re-evaluation Using D3-Creatine Muscle Mass Versus DXA Lean Mass Measurements
Abstract
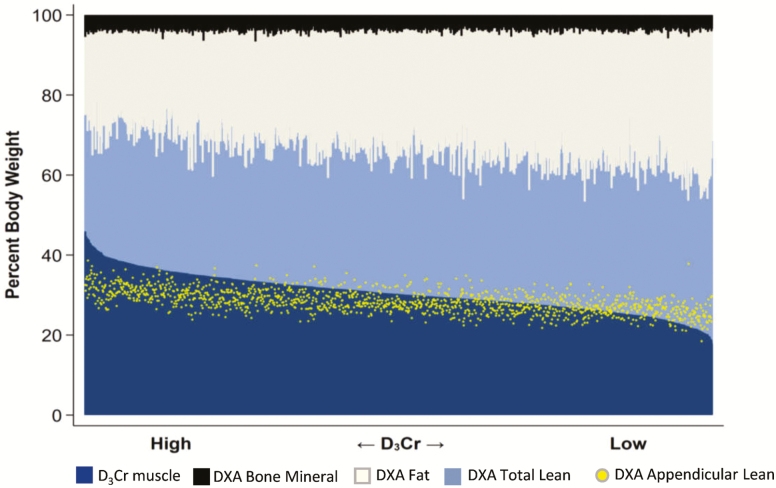
Background: The combination of sarcopenia and obesity has been associated with physical impairment in older people. However, previous research has relied on assessments of lean mass as a surrogate for muscle mass. We postulate that inaccurate measures of muscle mass may have obscured the role of obesity in sarcopenia and related outcomes. Our aim was to clarify the interactions of muscle and fat with physical performance and adverse outcomes using an accurate measure of muscle mass.
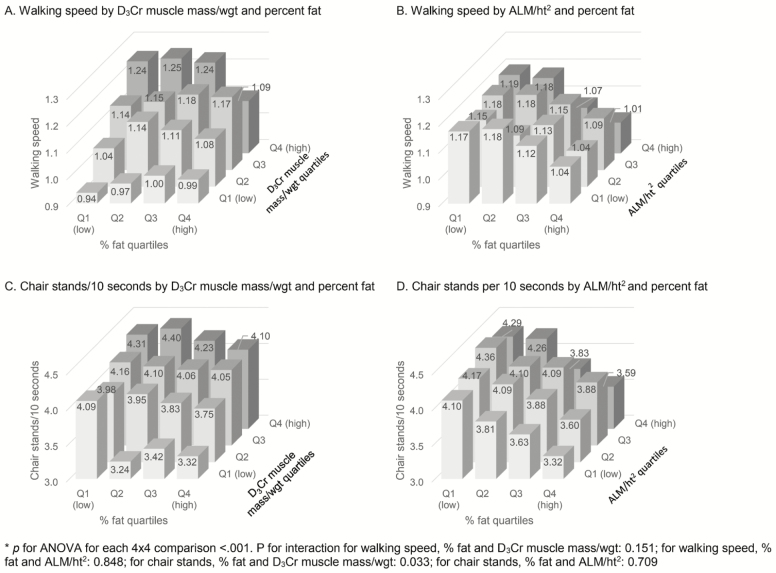
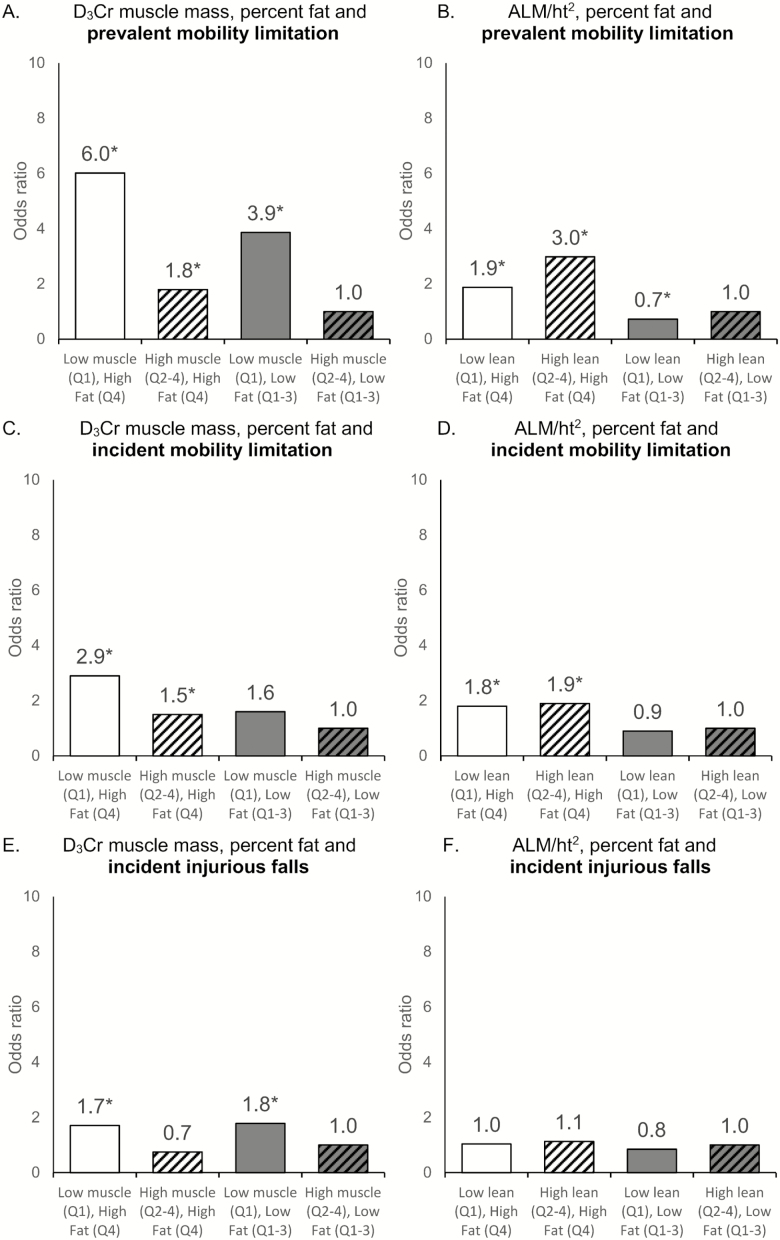
Methods: In a longitudinal study of >1,300 older men (mean age 84 years), we compared a direct measurement of muscle mass (D3 creatine dilution; D3Cr) with an approximation of muscle mass (appendicular lean mass [ALM] by dual-energy x-ray absorptiometry [DXA]) and their associations with measures of physical performance (gait speed, chair stand time) and adverse outcomes (incident injurious falls and mobility problems). We measured percent fat mass by DXA.
Results: Low D3Cr muscle mass was strongly associated with decreased performance and increased risk of adverse outcomes. Increased fat mass had little association after accounting for D3Cr muscle mass. In contrast, DXA ALM was minimally associated with performance or adverse outcomes, and fatness remained associated with both outcomes after accounting for DXA ALM.
Conclusions: When an accurate assessment of muscle mass (rather than lean mass) is used, reduced muscle mass is highly associated with important outcomes and the negative effects of adiposity are minimal, suggesting that obesity has little relevance for the understanding of important adverse health outcomes of sarcopenia in older men.
Keywords: Aging; Disability; Sarcopenia.
© The Author(s) 2020. Published by Oxford University Press on behalf of The Gerontological Society of America. All rights reserved. For permissions, please e-mail: journals.permissions@oup.com.
Figures
Similar articles
-
Strong Relation Between Muscle Mass Determined by D3-creatine Dilution, Physical Performance, and Incidence of Falls and Mobility Limitations in a Prospective Cohort of Older Men.J Gerontol A Biol Sci Med Sci. 2019 May 16;74(6):844-852. doi: 10.1093/gerona/gly129. J Gerontol A Biol Sci Med Sci. 2019. PMID: 29897420 Free PMC article.
-
Walking Speed and Muscle Mass Estimated by the D3-Creatine Dilution Method Are Important Components of Sarcopenia Associated With Incident Mobility Disability in Older Men: A Classification and Regression Tree Analysis.J Am Med Dir Assoc. 2020 Dec;21(12):1997-2002.e1. doi: 10.1016/j.jamda.2020.03.017. Epub 2020 May 4. J Am Med Dir Assoc. 2020. PMID: 32381425 Free PMC article.
-
Comparing D3-Creatine Dilution and Dual-Energy X-ray Absorptiometry Muscle Mass Responses to Strength Training in Low-Functioning Older Adults.J Gerontol A Biol Sci Med Sci. 2023 Aug 27;78(9):1591-1596. doi: 10.1093/gerona/glad047. J Gerontol A Biol Sci Med Sci. 2023. PMID: 36752568 Free PMC article. Clinical Trial.
-
D3 -Creatine dilution and the importance of accuracy in the assessment of skeletal muscle mass.J Cachexia Sarcopenia Muscle. 2019 Feb;10(1):14-21. doi: 10.1002/jcsm.12390. Epub 2019 Mar 21. J Cachexia Sarcopenia Muscle. 2019. PMID: 30900400 Free PMC article. Review.
-
Assessment of Lean Mass and Physical Performance in Sarcopenia.J Clin Densitom. 2015 Oct-Dec;18(4):467-71. doi: 10.1016/j.jocd.2015.05.063. Epub 2015 Jun 10. J Clin Densitom. 2015. PMID: 26071168 Review.
Cited by
-
Obesity in adult acute myeloid leukemia is not associated with inferior response or survival even when dose capping anthracyclines: An ECOG-ACRIN analysis.Cancer. 2023 Aug 15;129(16):2479-2490. doi: 10.1002/cncr.34807. Epub 2023 Apr 25. Cancer. 2023. PMID: 37185873 Free PMC article.
-
Impact of Protein Intake in Older Adults with Sarcopenia and Obesity: A Gut Microbiota Perspective.Nutrients. 2020 Jul 30;12(8):2285. doi: 10.3390/nu12082285. Nutrients. 2020. PMID: 32751533 Free PMC article. Review.
-
Thigh and Calf Myosteatosis are Strongly Associated with Muscle and Physical Function in African Caribbean Men.J Gerontol A Biol Sci Med Sci. 2023 Mar 1;78(3):527-534. doi: 10.1093/gerona/glac124. J Gerontol A Biol Sci Med Sci. 2023. PMID: 35661875 Free PMC article.
-
CT Muscle Density, D3Cr Muscle Mass, and Body Fat Associations With Physical Performance, Mobility Outcomes, and Mortality Risk in Older Men.J Gerontol A Biol Sci Med Sci. 2022 Apr 1;77(4):790-799. doi: 10.1093/gerona/glab266. J Gerontol A Biol Sci Med Sci. 2022. PMID: 34529767 Free PMC article.
-
Factor analysis to determine relative contributions of strength, physical performance, body composition and muscle mass to disability and mobility disability outcomes in older men.Exp Gerontol. 2022 May;161:111714. doi: 10.1016/j.exger.2022.111714. Epub 2022 Jan 29. Exp Gerontol. 2022. PMID: 35104566 Free PMC article.
References
Publication types
MeSH terms
Substances
Grants and funding
LinkOut - more resources
Full Text Sources
Medical
