. 2021 Jul;17(7):1592-1613.
doi: 10.1080/15548627.2020.1757955. Epub 2020 May 20.

Discovery of a potent SCAP degrader that ameliorates HFD-induced obesity, hyperlipidemia and insulin resistance via an autophagy-independent lysosomal pathway

Affiliations

Discovery of a potent SCAP degrader that ameliorates HFD-induced obesity, hyperlipidemia and insulin resistance via an autophagy-independent lysosomal pathway

Zu-Guo Zheng et al. Autophagy. 2021 Jul.

Abstract

SCAP (SREBF chaperone) regulates SREBFs (sterol regulatory element binding transcription factors) processing and stability, and, thus, becomes an emerging drug target to treat dyslipidemia and fatty liver disease. However, the current known SCAP inhibitors, such as oxysterols, induce endoplasmic reticulum (ER) stress and NR1H3/LXRα (nuclear receptor subfamily 1 group H member 3)-SREBF1/SREBP-1 c-mediated hepatic steatosis, which severely limited the clinical application of this inhibitor. In this study, we identified a small molecule, lycorine, which binds to SCAP, which suppressed the SREBF pathway without inducing ER stress or activating NR1H3. Mechanistically, lycorine promotes SCAP lysosomal degradation in a macroautophagy/autophagy-independent pathway, a mechanism completely distinct from current SCAP inhibitors. Furthermore, we determined that SQSTM1 captured SCAP after its exit from the ER. The interaction of SCAP and SQSTM1 requires the WD40 domain of SCAP and the TB domain of SQSTM1. Interestingly, lycorine triggers the lysosome translocation of SCAP independent of autophagy. We termed this novel protein degradation pathway as the SQSTM1-mediated autophagy-independent lysosomal degradation (SMAILD) pathway. In vivo, lycorine ameliorates high-fat diet-induced hyperlipidemia, hepatic steatosis, and insulin resistance in mice. Our study demonstrated that the inhibition of SCAP through the SMAILD pathway could be employed as a useful therapeutic strategy for treating metabolic diseases.Abbreviation: 25-OHD: 25-hydroxyvitamin D; 3-MA: 3-methyladenine; ABCG5: ATP binding cassette subfamily G member 5; ABCG8: ATP binding cassette subfamily G member 8; ACACA: acetyl-CoA carboxylase alpha; AEBSF: 4-(2-aminoethyl) benzenesulfonyl fluoride hydrochloride; AHI: anhydroicaritin; AKT/protein kinase B: AKT serine/threonine kinase; APOE: apolipoprotein E; ATF6: activating transcription factor 6; ATG: autophagy-related; BAT: brown adipose tissue; CD274/PD-L1: CD274 molecule; CETSA: cellular thermal shift assay; CMA: chaperone-mediated autophagy; COPII: cytoplasmic coat protein complex-II; CQ: chloroquine; DDIT3/CHOP: DNA damage inducible transcript 3; DNL: de novo lipogenesis; EE: energy expenditure; EGFR: epithelial growth factor receptor; eMI: endosomal microautophagy; ERN1/IRE1α: endoplasmic reticulum to nucleus signaling 1; FADS2: fatty acid desaturase 2; FASN: fatty acid synthase; GOT1/AST: glutamic-oxaloacetic transaminase 1; GPT/ALT: glutamic-pyruvate transaminase; HMGCR: 3-hydroxy-3-methylglutaryl-CoA reductase; HMGCS1: 3-hydroxy-3-methylglutaryl-CoA synthase 1; HSP90B1/GRP94: heat shock protein 90 beta family member 1; HSPA5/GRP78: heat hock protein family A (Hsp70) member 5; HSPA8/HSC70: heat shock protein family A (Hsp70) member 8; INSIG1: insulin induced gene 1; LAMP2A: lysosomal associated membrane protein 2A; LDLR: low density lipoprotein receptor; LyTACs: lysosome targeting chimeras; MAP1LC3B/LC3B: microtubule associated protein 1 light chain 3 beta; MBTPS1: membrane bound transcription factor peptidase, site 1; MEF: mouse embryonic fibroblast; MST: microscale thermophoresis; MTOR: mechanistic target of rapamycin kinase; MVK: mevalonate kinase; PROTAC: proteolysis targeting chimera; RQ: respiratory quotient; SCAP: SREBF chaperone; SCD1: stearoyl-coenzemy A desaturase 1; SMAILD: sequestosome 1 mediated autophagy-independent lysosomal degradation; SQSTM1: sequestosome 1; SREBF: sterol regulatory element binding transcription factor; TNFRSF10B/DR5: TNF receptor superfamily member 10b; TRAF6: TNF receptor associated factor 6; UPR: unfolded protein response; WAT: white adipose tissue; XBP1: X-box binding protein 1.

Keywords: Autophagy; ER stress; SCAP; SQSTM1; SREBFs; lycorine.


Conflict of interest statement

No potential conflict of interest was reported by the authors.

Figures
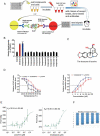
Figure 1.
Figure 1.
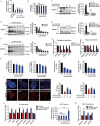
Screen and identification of lycorine as an inhibitor of SCAP. (A) A scheme for in vitro screening of small molecules that bind SCAP. (B) Screening results of compounds targeting SCAP. Each compound (10 μM) was used for screening, as described in Figure 1A (n = 4). (C) The chemical structure of lycorine. (D) Dose- and temperature-dependent CETSA were performed to verify the interaction of lycorine with SCAP (n = 3). (E) The interaction between SCAP and lycorine or cholesterol was detected by MST. Lycorine is dissolved in DMSO and cholesterol is dissolved in ethanol (n = 3). (F) The binding energy of small molecules with SCAP. Error bars are represented as mean ± SEM. Statistical analysis was done with one-way ANOVA (Dunnett’s posttest). *p < 0.05, **p < 0.01, ***p < 0.001 vs control
Figure 2.
Figure 2.
Lycorine inhibits the SREBF activity and decreases the cellular lipids without inducing ER stress and NR1H3 transactivation. (A) Lycorine downregulates SREBF activity. HL-7702/SRE-Luc cells were depleted of incubating in medium D for 16 h. The cells then were treated with different compounds as indicated. After incubation of another 16 h, cells were lysed with reporter lysis buffer and luciferase activity was measured (n = 4). (B) HL-7702 cells were treated with increasing concentrations of lycorine for 24 h, and cell viability was detected by MTT (n = 6). (C-F) HL-7702 cells were treated with cholesterol (20 μM) or lycorine (10, 20 μM) for 12 h (C and E), or lycorine (20 μM) for increasing time (D and F), whole-cell extracts underwent western blotting (WB) with indicated antibodies (left). Statistical analysis of expression of each protein was adjusted to ACTB (right) (n = 3). pSREBF1 or pSREBF2 represents precursor SREBF1 or precursor SREBF2; mSREBF1 or mSREBF2 represents mature SREBF1 or mature SREBF2. (G) HL-7702 cells were treated with 10 or 20 µM lycorine for 12 h, RNAs were extracted from these cells. The expression of various genes was analyzed by qRT-PCR (n = 3). (H) The cellular TG and TC contents were measured in HL-7702 hepatocytes treated with lycorine (5, 10 and 20 µM) for 16 h (n = 3). (I) HL-7702 cells were treated with indicated concentrations of lycorine for 16 h. 1–14 C-labeled acetic acid sodium salt was directly added into the medium and incubated for an additional 2 h. The fatty acid and total cholesterol were extracted and resolved by thin-layer chromatography. Radioactive products were visualized by phosphoimager and densitometric quantification is shown accordingly (n = 3). (J) The treated HL-7702 cells were fixed and stained with Filipin or Nile-Red. Quantification of the cellular cholesterol or neutral lipids was analyzed by image-pro plus (n = 3). (K) HL-7702 cells were treated with lycorine or sterol for 16 h, then RNAs were extracted. The expression of ER stress-related genes was analyzed by qRT-PCR (n = 3). (L) HL-7702 cells transfected with NR1H3 reporter and beta-gal plasmid were incubated with lycorine or sterol for 16 h, luciferase activity was then measured and normalized by the value of beta-gal (n = 6). (M) HL-7702 cells were treated with lycorine or sterol for 16 h, RNAs were extracted. The expression of NR1H3 target genes were analyzed by qRT-PCR (n = 3). Error bars are represented as mean ± SEM. Statistical analysis was done with one-way ANOVA (Dunnett’s posttest). *p < 0.05, **p < 0.01, ***p < 0.001 vs control
Figure 3.
Figure 3.
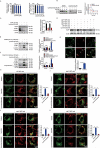
Lycorine decreases SCAP protein. (A) HL-7702 cells were treated with indicated compounds for 8 h, whole-cell extracts underwent WB with indicated antibodies. Statistical analysis of the expression of each protein was adjusted to ACTB (n = 3). (B) HL-7702 cells were pretreated with 10 μM sterol for 1 h, afterward, the cells were supplemented with 20 µM lycorine for 8 h, SCAP was detected by WB. Expression of each protein was adjusted to ACTB. Statistical analysis is on the right side (n = 3). (C-D) HL-7702 cells were treated with lycorine of indicated concentrations for 16 h (C), or lycorine (10 μM) with increasing time (D), whole-cell extracts underwent WB with indicated antibodies. Expression of each protein was adjusted to ACTB. Statistical analysis is on the right side (n = 3). (E) HL-7702 cells were transfected with MYC-SCAP plasmid for 24 h. The cells were incubated in medium D for 16 h and switched to medium D containing lycorine for 8 h. Then, the whole-cell extracts underwent WB with indicated antibodies (n = 3). (F) The wildtype or SCAP KO HL-7702 cells were incubated in medium D for 16 h and switched to medium D containing lycorine for 8 h, the whole-cell extracts underwent WB with indicated antibodies (n = 3). (G and H) SCAP KO HL-7702 cells (G) or SCAP KO HL-7702 cells transfected with MYC-SCAP (H) were treated with lycorine or sterol for 16 h, RNAs were extracted. The expression of ER stress-related genes was analyzed by qRT-PCR (n = 3). Error bars are represented as mean ± SEM. Statistical analysis was done with one-way ANOVA (Dunnett’s posttest). *p < 0.05, **p < 0.01, ***p < 0.001
Figure 4.
Figure 4.
Lycorine accelerates SCAP degradation in an autophagy-independent manner. (A) HL-7702 cells were treated with lycorine for indicated dose and time. The SCAP mRNA level was analyzed by qRT-PCR (n = 3). (B) HL-7702 cells were incubated with 50 µM cycloheximide for 1 h, afterward, the cells were supplemented with 50 µM cycloheximide plus vehicle (DMSO), or 10 µM lycorine for indicated time. SCAP was detected by WB (n = 3). (C, E and F) HL-7702 cells were pretreated with 10 mM 3-MA (C), bafilomycin A1 (E) or an inhibitor mixture (10 mM NH4Cl and 100 µM leupeptin) (F) for 1 h. Afterward, the cells were supplemented with 20 µM lycorine for 8 h, SCAP was detected by WB (n = 3). (D) The wild type, atg5−/-, atg3−/- and atg7−/- MEF cells were treated with or without 20 µM lycorine for 8 h. The SCAP protein was detected by WB (n = 3). (G) HL-7702 cells were transfected with EGFP-SCAP for 24 h, then the cells were treated with 20 µM lycorine for 4 h, the lysosome was stained with LysoTracker™ Red. After the treatment, the images were captured with confocal microscopy (n = 3). Quantification of colocalizations. The analysis of Mander’s colocalization coefficient was performed as detailed in the Materials and Methods. (H-K) The wild type (H), atg3−/- (I), atg5−/- (J) or atg7−/- (K) MEF cells were pretreated with or without fatostatin (20 µM) for 1 h. The cells then were treated with or without 20 µM lycorine for 4 h. After the treatment, the images were captured with confocal microscopy (n = 3). Quantification of colocalizations. The analysis of Mander’s colocalization coefficient was performed as detailed in the Materials and Methods. Error bars are represented as mean ± SEM. Statistical analysis was done with one-way ANOVA (Dunnett’s posttest). *p < 0.05, **p < 0.01, ***p < 0.001
Figure 5.
Figure 5.
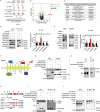
SQSTM1 mediates the lysosomal degradation of SCAP induced by lycorine. (A) A scheme for identified the proteins interacted with SCAP, which promoted by lycorine using IP-MS. (B) The experimental results were presented by volcano maps. (C) The top ten proteins interacting with SCAP promoted by lycorine. (D) 293 T cells were transfected with or without the indicated plasmids for 24 h. Immunoblotting for indicated proteins after immunoprecipitation of MYC from 293 T cells (n = 3). (E) HL-7702 cells were treated with or without 20 µM lycorine for 8 h. Immunoblotting for indicated proteins after immunoprecipitation of SCAP from HL-7702 cells (n = 3). (F) The schematic diagram of SCAP and its truncations. (G) 293 T cells transfected with Flag-SQSTM1 and the indicated HA-tagged SCAP constructs treated with 20 µM lycorine for 8 h and were subjected to immunoprecipitation with an anti-Flag antibody and levels of the co-immunoprecipitated HA-SCAP were detected with an anti-HA antibody (n = 3). (H) The schematic diagram of SQSTM1 and its truncations. (I-J) 293 T cells transfected with MYC-tagged SCAP and indicated Flag-SQSTM1-truncated constructs were treated with 20 µM lycorine and then were subjected to immunoprecipitation with an anti-MYC antibody. The levels of the co-immunoprecipitated Flag-SQSTM1 truncations were detected with an anti-Flag antibody (n = 3). (K) 293 T cells transfected with MYC-tagged SCAP and Flag-tagged SQSTM1TB (TRAF6 binding) domain (170–260) constructs were treated with 20 µM lycorine and then were subjected to immunoprecipitation with an anti-MYC antibody. The levels of the co-immunoprecipitated Flag-SQSTM1 TB domain was detected with an anti-Flag antibody (n = 3). Error bars are represented as mean ± SEM. Statistical analysis was done with one-way ANOVA (Dunnett’s posttest). *p < 0.05, **p < 0.01, ***p < 0.001
Figure 6.
Figure 6.
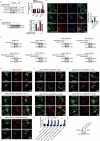
Lycorine-induced SCAP degradation depends on the TB domain of SQSTM1 and can be reversed by fatostatin. (A) 293 T cells were transfected with the indicated plasmids for 24 h. Immunoblotting for indicated proteins after immunoprecipitation of MYC from 293 T cells (n = 3). (B) HL-7702 cells were pretreated with 20 µM fatostatin for 1 h. The cells were treated with or without 20 µM lycorine for 8 h. The protein level of SCAP was detected by WB (n = 3). (C) HL-7702 cells were transfected with EGFP-SCAP and SQSTM1-OFP for 48 h, then the cells were pretreated with 20 µM fatostatin for 2 h, then lycorine was added to these cells for another 4 h. The lysosome was stained by LysoTracker™ Red. After the treatment, the images were captured with confocal microscopy (n = 3). Quantification of colocalizations. The analysis of Mander’s colocalization coefficient was performed as detailed in the Materials and Methods. (D) The WT or sqstm1−/- MEF cells were replenished the indicated truncation of SQSTM1 for 24 h. The cells were treated with 20 µM lycorine for 8 h. The protein level of SCAP was detected by WB (n = 3). (E-K) The sqstm1−/- cells were replenished with the indicated truncation of SQSTM1 for 24 h. cells were treated with 20 µM lycorine for 4 h. After the treatment, the images were captured with confocal microscopy (n = 3). (L) Quantification of colocalizations. The analysis of Mander’s colocalization coefficient was performed as detailed in the Materials and Methods. (M) The protein level of SQSTM1 was detected by WB. Error bars are represented as mean ± SEM. Statistical analysis was done with one-way ANOVA (The Dunnett’s posttest). ***p < 0.001
Figure 7.
Figure 7.
Lycorine ameliorates diet-induced obesity, hyperlipidemia, hepatic steatosis, and insulin resistance in mice. Male C57BL/6 J mice at 6 weeks of age were randomly grouped (n = 6). Mice were allowed ad libitum access to water and different types of diets (HFD, high fat diet). Vehicle (0.5% CMC-Na, chow), lycorine (15 or 30 mg/kg), or lovastatin (30 mg/kg) was administrated to mice by gastric irrigation every day. After 6 weeks of treatment, the mice were sacrificed and subjected to a series of analyzes as indicated below. (A) Food intake (B) Bodyweight. (C) The ratio of fat and body weight or lean. (D) The effect of lycorine on serum TG, TC, LDL-c and HDL-c levels. (E) The effect of lycorine on serum GPT/ALT and GOT1/AST levels. (F) Effect of lycorine on TG and TC levels in the liver. (G) The weight of liver and WAT. (H) Oil red staining in liver and histological analysis of liver, WAT and BAT. Error bars are represented as mean ± SEM. Statistical analyzes were done with two-way ANOVA (Bonferroni’s test) (A) or one-way ANOVA (Dunnett’s posttest) (B-G). *p < 0.05, **p < 0.01, ***p < 0.001 vs HFD
Figure 8.
Figure 8.
Lycorine decreases the protein level of SCAP-SREBF and regulates the expression of metabolic genes in vivo. (A) For each group, equal amounts of total proteins from the livers of 3 mice were subjected to WB with indicated antibodies. Statistical analysis of each protein expression was adjusted to ACTB as the loading control. (B-F) total RNAs were extracted from liver tissue, gene expression in mice liver. (G) total RNAs were extracted from WAT tissue, gene expression in WAT. n = 3, *p < 0.05, **p < 0.01, ***p < 0.001
Figure 9.
Figure 9.
Schematic diagram of lycorine. Sterols block the SCAP-SREBFs transport from the ER to the Golgi apparatus by sequestering the SCAP-SREBFs complex in the ER lumen, which is a potential risk factor of ER stress. Lycorine binds to SCAP at the WD40 domain, which leads to the dissociation of SCAP-SREBFs from INSIG1. Once SCAP leaves the ER, it is captured by SQSTM1 and escorted to the lysosome for degradation. When SCAP proteins are reduced, SREBFs undergoes ubiquitylation and proteasomal degradation, thus lipogenic gene expression is suppressed

Similar articles

Cited by

References

    1. Hua X, Yokoyama C, Wu J, et al. SREBP-2, a second basic-helix-loop-helix-leucine zipper protein that stimulates transcription by binding to a sterol regulatory element. Proc Natl Acad Sci USA. 1993;90:11603–11607. - PMC - PubMed
    1. Yokoyama C, Wang X, Briggs MR, et al. SREBP-1, a basic-helix-loop-helix-leucine zipper protein that controls transcription of the low density lipoprotein receptor gene. Cell. 1993;75:187–197. - PubMed
    1. Rawson RB, Zelenski NG, Nijhawan D, et al. Complementation cloning of S2P, a gene encoding a putative metalloprotease required for intramembrane cleavage of SREBPs. Mol Cell. 1997;1:47–57. - PubMed
    1. Sakai J, Rawson RB, Espenshade PJ, et al. Molecular identification of the sterol-regulated luminal protease that cleaves SREBPs and controls lipid composition of animal cells. Mol Cell. 1998;2:505–514. - PubMed
    1. Briggs MR, Yokoyama C, Wang X, et al. Nuclear protein that binds sterol regulatory element of low density lipoprotein receptor promoter. I. Identification of the protein and delineation of its target nucleotide sequence. J Biol Chem. 1993;268:14490–14496. - PubMed

Publication types

MeSH terms

Grants and funding

This work was supported by the Ministry of Science and Technology of China [2019YFC1711000], National Natural Science Foundation of China [81773957, 81421005, 81903871], National Science & Technology Major Project “Key New Drug Creation and Manufacturing Program”, China [2019ZX09201001-001-001], Natural Science Foundation of Jiangsu Province [BK20190565]. This project was also supported by the Project Program of State Key Laboratory of Natural Medicines, China Pharmaceutical University [SKLNMZZCX201820], the “Double First-Class” University Project [CPU2018GF04].