. 2020 May 20:9:e55845.
doi: 10.7554/eLife.55845.

Identification of a novel toxicophore in anti-cancer chemotherapeutics that targets mitochondrial respiratory complex I

Affiliations

Identification of a novel toxicophore in anti-cancer chemotherapeutics that targets mitochondrial respiratory complex I

Zoe A Stephenson et al. Elife. .

Abstract

Disruption of mitochondrial function selectively targets tumour cells that are dependent on oxidative phosphorylation. However, due to their high energy demands, cardiac cells are disproportionately targeted by mitochondrial toxins resulting in a loss of cardiac function. An analysis of the effects of mubritinib on cardiac cells showed that this drug did not inhibit HER2 as reported, but directly inhibits mitochondrial respiratory complex I, reducing cardiac-cell beat rate, with prolonged exposure resulting in cell death. We used a library of chemical variants of mubritinib and showed that modifying the 1H-1,2,3-triazole altered complex I inhibition, identifying the heterocyclic 1,3-nitrogen motif as the toxicophore. The same toxicophore is present in a second anti-cancer therapeutic carboxyamidotriazole (CAI) and we demonstrate that CAI also functions through complex I inhibition, mediated by the toxicophore. Complex I inhibition is directly linked to anti-cancer cell activity, with toxicophore modification ablating the desired effects of these compounds on cancer cell proliferation and apoptosis.

Keywords: biochemistry; cancer biology; cardiac liability; chemical biology; human; mitochondria; toxicophore.

Plain language summary

The pharmaceutical industry needs to make safe and effective drugs. At the same time this industry is under pressure to keep the costs of developing these drugs at an acceptable level. Drugs work by interacting with and typically blocking a specific target, such as a protein in a particular type of cell. Sometimes, however, drugs also bind other unexpected targets. These “off-target” effects can be the reason for a drug’s toxicity, and it is important – both for the benefit of patients and the money that can be saved when developing drugs – to identify how drugs cause toxic side effects. The earlier researchers detect off-target effects, the better. Recent data has suggested that an anti-cancer drug called mubritinib has off-target effects on the compartments within cells that provide the cell with most of their energy, the mitochondria. This drug’s intended target is a protein called HER2, which is found in large amounts on the surfaces of some breast cancer cells. Yet if mubritinib has this off-target effect on mitochondria, it may be harmful to other cells including heart cells because the heart is an organ that needs a large amount of energy from its mitochondria. Stephenson et al. have now performed experiments to show that mubritinib does not actually interact with HER2 at all, but only targets mitochondria. The effect of mubritinib as an anti-cancer drug is therefore only due to its activity against mitochondria. Digging deeper into the chemistry revealed the small parts of its chemical structure that was responsible for mubritinib’s toxicity against heart cells, the so-called toxic substructure. Another anti-cancer drug called carboxyamidotriazole also has the same toxic substructure. Carboxyamidotriazole is supposed to stop cells from taking up calcium ions, but a final set of experiments demonstrated that this drug also only acts by inhibiting mitochondria. Often there is not enough information about many drugs’ substructures, meaning off-target effects and toxicities cannot be predicted. The pharmaceutical industry will now be able to benefit from this new knowledge about the toxic substructures within some drugs. This research may also help patients who take mubritinib or carboxyamidotriazole, because their doctors will have to check for side effects on the heart more carefully.


Conflict of interest statement

ZS, RH, KP, SM, RH, RS, IC, TA, MS, MM, PF, JH, BK, AW No competing interests declared

Figures
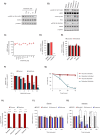
Figure 1.
Figure 1.. Mubritinib does not inhibit HER2, but inhibits ATP production and beat rate of cardiomyocytes.
(A) Western blot analysis of the HER2-overexpressing cell line, BT474, treated with increasing doses of mubritinib. HER2 activity was assessed with antibodies against phosphorylated HER2 (Y1221/1222). Cells were treated with the clinically used HER2 inhibitor, lapatinib (10 μM), as a positive control. (B) Western blot analysis of the HER2-overexpressing cell line, BT474, treated with 1 μM of either mubritinib, lapatinib, compound 5 (inactive mubritinib derivative, see Figure 2A), antimycin A or rotenone for 2 hr. (C) Radiometric kinase assays were carried out and the effect of mubritinib (at the concentrations shown) on recombinant human HER2 activity was determined by measuring the incorporation of radioactive 32P-ATP after 15 mins. Activity values are displayed relative to the untreated sample. (D) Radiometric kinase assays were carried out using recombinant human HER2 in the presence of 1 μM mubritinib and lapatinib (DMSO control and lapatinib, n = 3, mubritinib, n = 2). Significance following lapatinib treatment was assessed using the unpaired students t-test (***p<0.001) relative to the DMSO control. (E) Radiometric kinase assays were carried out on recombinant human EGFR, ErbB4, Flt1 and PDFRα in the presence of 2 μM mubritinib. Error bars represent standard deviation (n = 3). (F) A 24 hr time course for loss of ATP from H9c2 cells following treatment with 2 μM mubritinib in media containing either glucose or galactose as the carbon source. Error bars represent standard deviation (n = 3) and significance was assessed using ANOVA with Dunnett’s multiple comparisons test (****p<0.0001, ***p<0.001, ns = not significant). (G) H9c2 cells were treated with 2 μM mubritinib in media containing either glucose or galactose as the carbon source and cell viability was assessed over a 72 hr period using DRAQ7 staining and Annexin-V-FITC labelling. Error bars represent standard deviation (n = 3) and significance at each time point was assessed using ANOVA with Tukey’s multiple comparisons test (****p<0.0001). (H) hESC-cardiomyocytes (CytivaTM Plus, GE Healthcare) were grown in RPMI-1640 media supplemented with galactose (10 mM) or glucose (11 mM) and treated with 1 μM of mubritinib, or inhibitors of mitochondrial complex III (antimycin A), ATP synthase (oligomycin A) or complex I (rotenone). ATP levels were measured after 2 hr. Error bars represent standard deviation (n = 4) and significance was assessed using the unpaired students t-test (****p<0.0001). (I) hESC-cardiomyocytes (CytivaTM Plus, GE Healthcare) were grown in either galactose (10 mM) or glucose (11 mM) containing media on multi-electrode array plates from which it is possible to assess beat rate. The average beat rates in glucose (i) and galactose (ii) containing media of 52.2 and 30.7 BPM respectively, were set to 100%. Cells were treated with mubritinib (1 μM), antimycin A (1 μM) or rotenone (1 μM). Error bars represent standard deviation (n = 3) and significance was assessed using the unpaired students t-test (*p<0.05, **p<0.01, ****p<0.0001).
Figure 1—figure supplement 1.
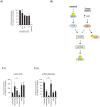
Figure 1—figure supplement 1.. Mubritinib targets complex I in cardiomyocytes.
(A) Quantification of HER2 phosphorylation from Figure 1A displayed relative to the untreated sample. Error bars represent standard deviation (n = 3) and significance was assessed using unpaired students t-test (****p<0.0001, **p<0.01, *p<0.05, ns = not significant). (B) Schematic to show the key components in the signalling pathway that is downstream from changes in energy status or inhibition of HER2. Arrows indicate activation and blocked arrows indicate inactivation of the downstream target. (C) Quantification of (i) ACC (S-79) and (ii) RPS6 (S-240/244) phosphorylation from Figure 1B displayed relative to the untreated sample. Error bars represent standard deviation (n = 3) and significance was assessed using the unpaired students t-test (*p<0.05, **p<0.01, ***p<0.001, ns = not significant).
Figure 2.
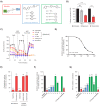
Figure 2.. Mubritinib is an inhibitor of mitochondrial complex I.
(A) Variants of mubritinib were synthesised with alterations to the trifluoromethylphenyl group (2, 3 and 4) or the triazole (5, 6, 7 and 8). Mubritinib (1) and mubritinib synthesised ‘in house’ were used as positive controls. (B) Rotenone-sensitive oxygen consumption rates (OCRs) of H9c2 or hESC-CM cells in glucose containing media were measured after the addition of FCCP in the presence of either 1 μM mubritinib or 1 μM oligomycin A. OCR values are represented relative to untreated cells and error bars represent standard deviation (n = 3). Significance was assessed using the unpaired students t-test (*** p = <0.001, **** p = <0.0001, ns = not significant). (C) OCR was measured in cells pre-treated with 0.5 μM, 2 μM and 10 μM mubritinib, 1 μM rotenone or 10 μM antimycin A using a Seahorse XF Analyzer. PMP was added to permeabilise the plasma membrane, followed by pyruvate, malate and ADP to drive complex I linked respiration. Then, rotenone was added to abolish complex I respiration followed by ADP and succinate to drive complex II linked respiration. Error bars represent standard deviation (n = 3). (D) Mubritinib was incubated with mitochondrial membranes from bovine heart at the concentrations shown, then the rate of NADH was measured spectrophotometrically. Error bars represent standard error of the mean (n = 3). Data were fit using activity (%) = 100/(1 + (IC50 / [inhibitor])Hill slope and yielded an IC50 value of 19.2 nM. (E) Relative rates of NADH or succinate oxidation by mitochondrial membranes or complex I isolated from bovine heart using O2, dQ, APAD+, or FeCN as the electron acceptor in the presence of 500 nM mubritinib. Error bars represent standard deviation (n = 3) and significance was assessed using ANOVA with Dunnett’s multiple comparisons test (****p<0.0001, ns = not significant). (F) Mubritinib and the variants from (A) were incubated with mitochondrial membranes at 500 nM. The rate of NADH oxidation was measured spectrophotometrically. The activity is expressed relative to the DMSO control, set to 100%. Error bars represent standard deviation (n = 3) and significance was assessed using ANOVA with Dunnett’s multiple comparisons test (****p<0.0001, **p<0.01). Activities were inter/extrapolated from measured data points for compounds 7 and 8. (G) H9c2 cells were treated with mubritinib and all compound variants (10 μM) in galactose containing media for 24 hr and ATP levels were measured. Error bars represent standard deviation (n = 3) and significance was assessed using ANOVA with Dunnett’s multiple comparisons test (****p<0.0001, ns = not significant).
Figure 2—figure supplement 1.
Figure 2—figure supplement 1.. Mubritinib inhibits OCR in H9c2 and hESC-CM.
(A and B) Representative seahorse trace (for Figure 2B) from (A) H9c2 or (B) hESC-CM cells in glucose containing media and treated with mubritinib (1 μM) or oligomycin A (1 μM).
Figure 2—figure supplement 2.
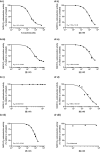
Figure 2—figure supplement 2.. Complex I inhibition by mubritinib and the synthesised variant compounds.
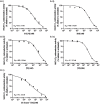
(A) Mubritinib and the compound variants (i-viii) were incubated with mitochondrial membranes at the concentrations shown. The rate of NADH oxidation was measured spectrophotometrically, and data were fit to the standard dose-effect relationship (activity (%) = 100/(1 + (IC50 / [inhibitor])Hill slope). The activity is expressed relative to the DMSO control, set to 100%. For each compound the IC50 values (nM) measured on mitochondrial membranes are shown with standard errors (n = 3).
Figure 3.
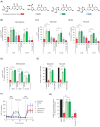
Figure 3.. The toxicophore present in carboxyamidotriazole inhibits mitochondrial complex I.
(A) Chemical structure of carboxyamidotriazole (CAI) (9) and three variants whereby the core triazole ring was replaced with either a pyrazole (10 and 11) or imidazole (12). For the pyrazoles, 11 is an analogue of 9 with one of the triazole nitrogens removed, whereas 10 also removes one of the triazole nitrogen atoms whilst additionally shifting the trichlorobenzophenonemethyl moiety to the 2-position equivalent. (B) H9c2 cells were treated with 3, 6 or 12 μM of CAI (9), 10, 11, 12 or the ‘in house’ synthesised CAI in galactose containing media and after 24 hr ATP levels were measured and data shown are relative to the untreated control (n = 3). Significance was assessed using ANOVA with Dunnett’s multiple comparisons test (****p<0.0001, ***p<0.001, **p<0.01, *p<0.05, ns = not significant). (C) Basal (i) and maximum (ii) oxygen consumption rates were measured using a Seahorse XF Analyzer in H9c2 cells treated with 3 and 10 μM of either CAI (9), 10, 11, 12 or the ‘in house’ synthesised CAI. Error bars represent standard deviation (n = 3) and significance was assessed using ANOVA with Tukey’s multiple comparisons test (****p<0.0001, ***p<0.001, *p<0.05). (D) A549 cells were treated with 3, 6 or 12 μM of CAI (9) or 10 and 11 in galactose containing media and after 24 hr ATP levels were measured and normalised to the untreated control. Error bars represent standard deviation (n = 3) and significance was assessed using ANOVA with Tukey’s multiple comparisons test (****p<0.0001). (E) Basal and maximum oxygen consumption rates were measured using a Seahorse XF Analyzer in A549 cells treated with 5 μM of either CAI (9), 10, 11; or 5 μM mubritinib. Error bars represent standard deviation (n = 3) and significance was assessed using ANOVA with Tukey’s multiple comparisons test (****p<0.0001). (F) A549 cells were pre-treated with either 5 μM CAI (9), 10, 11, mubritinib, antimycin A or piericidin A (complex I inhibitor) and the OCR was measured over the times indicated. PMP was added to permeabilise the plasma membranes followed by addition of pyruvate, malate and ADP to drive complex I respiration and OCR determined. Finally, piericidin A was added to abolish complex I respiration followed by ADP and succinate to drive complex II respiration and OCR was again measured. Representative trace from three independent experiments. (G) CAI (9), 10, 11, 12 and the ‘in house’ synthesised CAI were incubated with mitochondrial membranes at 500 nM. The rate of NADH oxidation was measured spectrophotometrically. The activity is expressed relative to the DMSO control, set to 100%. Error bars represent standard deviation (n = 3) and significance was assessed using ANOVA with Tukey’s multiple comparisons test (****p<0.0001, ns = not significant). Activities were interpolated from measured data points for compounds 10, 11, 12 and ‘in house’ CAI.
Figure 3—figure supplement 1.
Figure 3—figure supplement 1.. The toxicophore in CAI inhibits mitochondrial complex I.
(A and B) Representative seahorse trace (for Figure 3C) of H9c2 cells grown in glucose containing media and treated with either (A) 3 μM or (B) 10 μM of the indicated compounds. (C) A549 cells were treated with 6 or 12 μM of CAI (9) or compound 10 and compound 11 in glucose containing media and after 24 hr ATP levels were measured and normalised to the untreated control. Error bars represent standard deviation (n = 3). (D) Representative seahorse trace (for Figure 3E) of A549 cells grown in glucose containing media and treated with 5 μM of either CAI (9), 10, 11; or 5 μM mubritinib.
Figure 3—figure supplement 2.
Figure 3—figure supplement 2.. Complex I inhibition by mubritinib and the synthesised variant compounds.
(A) CAI and the compound variants (i–v) were incubated with mitochondrial membranes at the concentrations shown. The rate of NADH oxidation was measured spectrophotometrically, and data were fit to the standard dose-effect relationship (activity (%) = 100/(1 + (IC50 / [inhibitor])Hill slope). The activity is expressed relative to the DMSO control, set to 100%. For each compound the IC50 values (nM) measured on mitochondrial membranes are shown with standard errors (n = 3).
Figure 3—figure supplement 3.
Figure 3—figure supplement 3.. CAI inhibits signalling pathways responsive to changes in energy status.
(A) Western blot analysis of A549 cells treated with 5 μM of CAI (9), 5 μM of 11 (inactive CAI derivative), 2.5 μM bepridil hydrochloride (non-specific calcium channel inhibitor) or 1 μM rotenone (complex I inhibitor) for 24 hr. (B) Quantification of (i) ACC (S-79) and (ii) RPS6 (S-240/244) phosphorylation from (E) displayed relative to the untreated sample. Error bars represent standard deviation (n = 3).
Figure 4.
Figure 4.. The toxicophore present in mubritinib and CAI is required for efficacy as an anti-cancer agent.
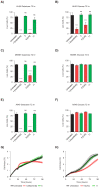
(A and B) HL60 cells grown in media containing galactose (A) or glucose (B) as an energy source treated with mubritinib (1) (2 μM), CAI (9) (5 μM) or the inactive derivatives 5 (2 μM) or 11 (5 μM) for 72 hr. The percentage of live cells was assessed by DRAQ7 staining and Annexin-V-FITC labelling. Error bars represent standard deviation (n = 3) and significance relative to the untreated control sample was assessed using ANOVA with Dunnett’s multiple comparisons test (****p<0.0001, ns = not significant). (C and D) M059K cells grown in media containing galactose (C) or glucose (D) as an energy source treated with mubritinib (1) (2 μM), CAI (9) (5 μM) or the inactive derivatives 5 (2 μM) or 11 (5 μM) for 72 hr. The percentage of live cells was assessed by DRAQ7 staining and Annexin-V-FITC labelling. Error bars represent standard deviation (n = 3) and significance relative to the untreated control sample was assessed using ANOVA with Dunnett’s multiple comparisons test (****p<0.0001, ns = not significant). (E and F) A549 cells grown in media containing galactose (E) or glucose (F) as an energy source treated with mubritinib (1) (2 μM), CAI (9) (5 μM) or the inactive derivatives 5 (2 μM) or 11 (5 μM) for 72 hr. The percentage of live cells was assessed by DRAQ7 staining and Annexin-V-FITC labelling. Error bars represent standard deviation (n = 3) and significance relative to the untreated control sample was assessed using ANOVA with Dunnett’s multiple comparisons test (****p<0.0001, ns = not significant). (G) Cell proliferation profiles from xCELLigence RTCA DP instrument. BT474 cells grown in glucose containing media were seeded in an E-plate 16 and after 24 hr were treated with either 5 μM mubritinib (1) or the derivative compound five which contains a modified triazole ring. The cell index was monitored for 96 hr to determine cell proliferation rates. Error bars represent standard deviation (n = 3). (H) Cell proliferation profiles from xCELLigence RTCA DP instrument. A549 cells grown in glucose containing media were seeded in an E-plate 16 and after 20 hr were treated with either 5 μM CAI (9) or the derivative compound 11 which contains a modified triazole ring. The cell index was monitored for 120 hr to determine cell proliferation rates. Error bars represent standard deviation (n = 3).
Figure 4—figure supplement 1.
Figure 4—figure supplement 1.. CAI and mubritinib inhibit cell growth and induce apoptosis in glycolytic-deficient tumour cell lines.
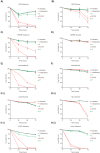
(A and B) HL60 cells grown in media containing galactose (A) or glucose (B) as an energy source treated with mubritinib (1) (2 μM), CAI (9) (5 μM) or the inactive derivatives 5 (2 μM) or 11 (5 μM). Cells were harvested at the indicated time points and the percentage of live cells assessed by DRAQ7staining and Annexin-V-FITC labelling. Error bars represent standard deviation (n = 3). (C and D) M059K cells grown in media containing galactose (C) or glucose (D) as an energy source treated with mubritinib (1) (2 μM), CAI (9) (5 μM) or the inactive derivatives 5 (2 μM) or 11 (5 μM). Cells were harvested at the time points shown and the percentage of live cells assessed by DRAQ7staining and Annexin-V-FITC labelling. Error bars represent standard deviation (n = 3). (E and F) A549 cells grown in media containing galactose (E) or glucose (F) as an energy source treated with mubritinib (1) (2 μM), CAI (9) (5 μM) or the inactive derivatives 5 (2 μM) or 11 (5 μM). Cells were harvested at the time points shown and the percentage of live cells assessed by DRAQ7staining and Annexin-V-FITC labelling. Error bars represent standard deviation (n = 3). (G) U-20S (i) cells and HeLa (ii) cells were treated with mubritinib (1) (2 μM), CAI (9) (5 μM) or the inactive derivatives compound 5 (2 μM) or compound 11 (5 μM) in media containing glucose as an energy source. Cells were harvested at the time points shown and the percentage of live cells assessed by DRAQ7staining and Annexin-V-FITC labelling. (H) U-20S (i) cells and HeLa (ii) cells were treated with mubritinib (1) (2 μM), CAI (9) (5 μM) or the inactive derivatives compound 5 (2 μM) or compound 11 (5 μM) in media containing galactose as an energy source. Cells were harvested at the time points shown and the percentage of live cells assessed by DRAQ7staining and Annexin-V-FITC labelling.
Figure 5.
Figure 5.. Schematic diagram to show the cell-wide effect of ETC complex I inhibition by the toxicophore.
Chemical inhibition of mitochondrial respiratory complex I with mubritinib and CAI leads to a decrease in cellular ATP and the subsequent activation of the energy sensor AMPK. Importantly, AMPK has been shown to phosphorylate and inhibit HER2 (Jhaveri et al., 2015) suggesting how mubritinib has been misattributed as a HER2 inhibitor, as well to negatively regulate protein synthesis via the mTOR axis to inhibit tumour cell growth. Moreover, cancer cells that are dependent on oxidative phosphorylation for ATP production, such as in AML, will be more sensitive to compounds that inhibit complex I. However, the decrease in ATP levels following treatment with these compounds will also have a particularly toxic effect on tissues with a high energy demand, such as cardiac tissue, and thus impact on heart function.
Appendix 1—figure 1.
Appendix 1—figure 1.. Mubritinib analogues.
Appendix 1—figure 2.
Appendix 1—figure 2.. Carboxyamidotriazole analogues.

Comment in

  • The mitochondrial paradox.
    Penman SL, Jensen RL, Kiy RT, Chadwick AE. Penman SL, et al. Elife. 2020 Jun 25;9:e59140. doi: 10.7554/eLife.59140. Elife. 2020. PMID: 32583799 Free PMC article.

Similar articles

Cited by

References

    1. Allen TEH, Goodman JM, Gutsell S, Russell PJ. Using 2D structural alerts to define chemical categories for molecular initiating events. Toxicological Sciences. 2018;165:213–223. doi: 10.1093/toxsci/kfy144. - DOI - PubMed
    1. Anastassiadis T, Deacon SW, Devarajan K, Ma H, Peterson JR. Comprehensive assay of kinase catalytic activity reveals features of kinase inhibitor selectivity. Nature Biotechnology. 2011;29:1039–1045. doi: 10.1038/nbt.2017. - DOI - PMC - PubMed
    1. Azad N, Perroy A, Gardner E, Imamura CK, Graves C, Sarosy GA, Minasian L, Kotz H, Raggio M, Figg WD, Kohn EC. A phase I study of paclitaxel and continuous daily CAI in patients with refractory solid tumors. Cancer Biology & Therapy. 2009;8:1800–1805. doi: 10.4161/cbt.8.19.9593. - DOI - PMC - PubMed
    1. Baccelli I, Gareau Y, Lehnertz B, Gingras S, Spinella JF, Corneau S, Mayotte N, Girard S, Frechette M, Blouin-Chagnon V, Leveillé K, Boivin I, MacRae T, Krosl J, Thiollier C, Lavallée VP, Kanshin E, Bertomeu T, Coulombe-Huntington J, St-Denis C, Bordeleau ME, Boucher G, Roux PP, Lemieux S, Tyers M, Thibault P, Hébert J, Marinier A, Sauvageau G. Mubritinib targets the electron transport chain complex I and reveals the landscape of OXPHOS dependency in acute myeloid leukemia. Cancer Cell. 2019;36:84–99. doi: 10.1016/j.ccell.2019.06.003. - DOI - PubMed
    1. Bauer KS, Cude KJ, Dixon SC, Kruger EA, Figg WD. Carboxyamido-triazole inhibits angiogenesis by blocking the calcium-mediated nitric-oxide synthase-vascular endothelial growth factor pathway. The Journal of Pharmacology and Experimental Therapeutics. 2000;292:31–37. - PubMed

Publication types

MeSH terms