A comparative analysis of unintegrated HIV-1 DNA measurement as a potential biomarker of the cellular reservoir in the blood of patients controlling and non-controlling viral replication
- PMID: 32429953
- PMCID: PMC7236182
- DOI: 10.1186/s12967-020-02368-y
A comparative analysis of unintegrated HIV-1 DNA measurement as a potential biomarker of the cellular reservoir in the blood of patients controlling and non-controlling viral replication
Abstract
Background: The persistence of HIV-1 in reservoir cells is one of the major obstacles to eradicating the virus in infected individuals receiving combination antiretroviral therapy (ART). HIV-1 persists in infected cells as a stable integrated genome and more labile unintegrated DNA (uDNA), which includes linear, 1-LTR and 2-LTR circular DNA. 2-LTR circle DNA, although less abundant, is considered a surrogate marker of recent infection events and is currently used instead of the other unintegrated species as a diagnostic tool. This pilot study aimed to investigate how to best achieve the measurement of uDNA.
Methods: A comparative analysis of two qPCR-based methods (U-assay and 2-LTR assay) was performed on the blood of 12 ART-naïve, 14 viremic and 29 aviremic On-ART patients and 20 untreated spontaneous controllers (HIC), sampled at a single time point.
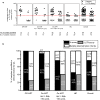
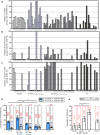
Results: The U-assay, which quantified all unintegrated DNA species, showed greater sensitivity than the 2-LTR assay (up to 75%, p < 0.0001), especially in viremic subjects, in whom other forms, in addition to 2-LTR circles, may also accumulate due to active viral replication. Indeed, in aviremic On-ART samples, the U-assay unexpectedly measured uDNA in a higher proportion of samples (76%, 22/29) than the 2-LTR assay (41%, 12/29), (p = 0.0164). A trend towards lower uDNA levels was observed in aviremic vs viremic On-ART patients, reaching significance when we combined aviremic On-ART and HIC (controllers) vs Off-ART and viremic On-ART subjects (non-controllers) (p = 0.0003), whereas 2-LTR circle levels remained constant (p ≥ 0.2174). These data were supported by the high correlation found between uDNA and total DNA (r = 0.69, p < 0.001).
Conclusions: The great advantage of the U-assay is that, unlike the 2-LTR assay, it allows the accurate evaluation of the totality of uDNA that can still be measured even during successful ART when plasma viremia is below the cut-off of common clinical tests (< 50 copies/mL) and 2-LTR circles are more likely to be under the quantification limit. UDNA measurement in blood cells may be used as a biomarker to reveal a so far hidden or underestimated viral reservoir. The potential clinical relevance of uDNA quantification may lead to improvements in diagnostic methods to support clinical strategies.
Keywords: 2-LTR circles; Aviremic patients; Blood cells; HIC; HIV-1; Reservoir; Total HIV DNA; Unintegrated HIV DNA; Viremic patients; qPCR.
Conflict of interest statement
There are no potential conflicts of interest to disclose.
Figures


Similar articles
-
Persistence of Unintegrated HIV DNA Associates With Ongoing NK Cell Activation and CD34+DNAM-1brightCXCR4+ Precursor Turnover in Vertically Infected Patients Despite Successful Antiretroviral Treatment.Front Immunol. 2022 Apr 26;13:847816. doi: 10.3389/fimmu.2022.847816. eCollection 2022. Front Immunol. 2022. PMID: 35558085 Free PMC article.
-
Episomal HIV-1 DNA and its relationship to other markers of HIV-1 persistence.Retrovirology. 2018 Jan 30;15(1):15. doi: 10.1186/s12977-018-0398-1. Retrovirology. 2018. PMID: 29378611 Free PMC article. Review.
-
HIV-1 latency and virus production from unintegrated genomes following direct infection of resting CD4 T cells.Retrovirology. 2016 Jan 5;13:1. doi: 10.1186/s12977-015-0234-9. Retrovirology. 2016. PMID: 26728316 Free PMC article.
-
Tat controls transcriptional persistence of unintegrated HIV genome in primary human macrophages.Virology. 2018 May;518:241-252. doi: 10.1016/j.virol.2018.03.006. Epub 2018 Mar 15. Virology. 2018. PMID: 29549786 Free PMC article.
-
Distribution and fate of HIV-1 unintegrated DNA species: a comprehensive update.AIDS Res Ther. 2017 Feb 16;14(1):9. doi: 10.1186/s12981-016-0127-6. AIDS Res Ther. 2017. PMID: 28209198 Free PMC article. Review.
Cited by
-
Unveiling Human Non-Random Genome Editing Mechanisms Activated in Response to Chronic Environmental Changes: I. Where Might These Mechanisms Come from and What Might They Have Led To?Cells. 2020 Oct 27;9(11):2362. doi: 10.3390/cells9112362. Cells. 2020. PMID: 33121045 Free PMC article. Review.
-
Persistence of Unintegrated HIV DNA Associates With Ongoing NK Cell Activation and CD34+DNAM-1brightCXCR4+ Precursor Turnover in Vertically Infected Patients Despite Successful Antiretroviral Treatment.Front Immunol. 2022 Apr 26;13:847816. doi: 10.3389/fimmu.2022.847816. eCollection 2022. Front Immunol. 2022. PMID: 35558085 Free PMC article.
-
Primary HIV infection features colonic damage and neutrophil inflammation yet containment of microbial translocation.AIDS. 2024 Apr 1;38(5):623-632. doi: 10.1097/QAD.0000000000003799. Epub 2023 Dec 4. AIDS. 2024. PMID: 38016163 Free PMC article.
-
Quantification of Total HIV DNA as a Marker to Measure Viral Reservoir: Methods and Potential Implications for Clinical Practice.Diagnostics (Basel). 2021 Dec 24;12(1):39. doi: 10.3390/diagnostics12010039. Diagnostics (Basel). 2021. PMID: 35054206 Free PMC article. Review.
-
DNA ultra-sensitive quantification, a technology for studying HIV unintegrated linear DNA.Cell Rep Methods. 2023 Apr 5;3(4):100443. doi: 10.1016/j.crmeth.2023.100443. eCollection 2023 Apr 24. Cell Rep Methods. 2023. PMID: 37159665 Free PMC article.
References
-
- De Maria A, Pantaleo G, Schnittman SM, Greenhouse JJ, Baseler M, Orenstein JM, Fauci AS. Infection of CD8+ T lymphocytes with HIV. Requirement for interaction with infected CD4+ cells and induction of infectious virus from chronically infected CD8+ cells. J Immunol. 1991;146:2220–2226. - PubMed
Publication types
MeSH terms
Substances
LinkOut - more resources
Full Text Sources
Medical

