. 2020 May 14;11(1):2401.
doi: 10.1038/s41467-020-15694-y.

Genotoxic stress triggers the activation of IRE1α-dependent RNA decay to modulate the DNA damage response

Affiliations

Genotoxic stress triggers the activation of IRE1α-dependent RNA decay to modulate the DNA damage response

Estefanie Dufey et al. Nat Commun. .

Abstract

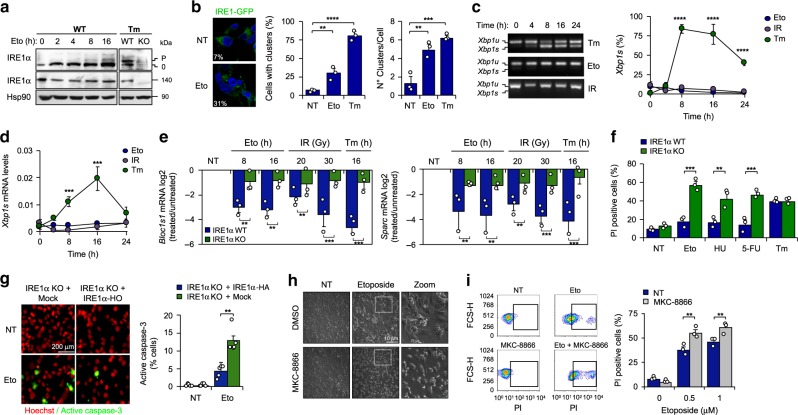
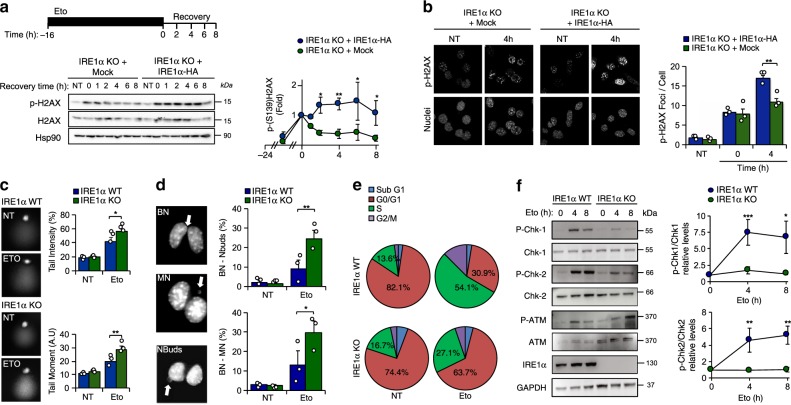
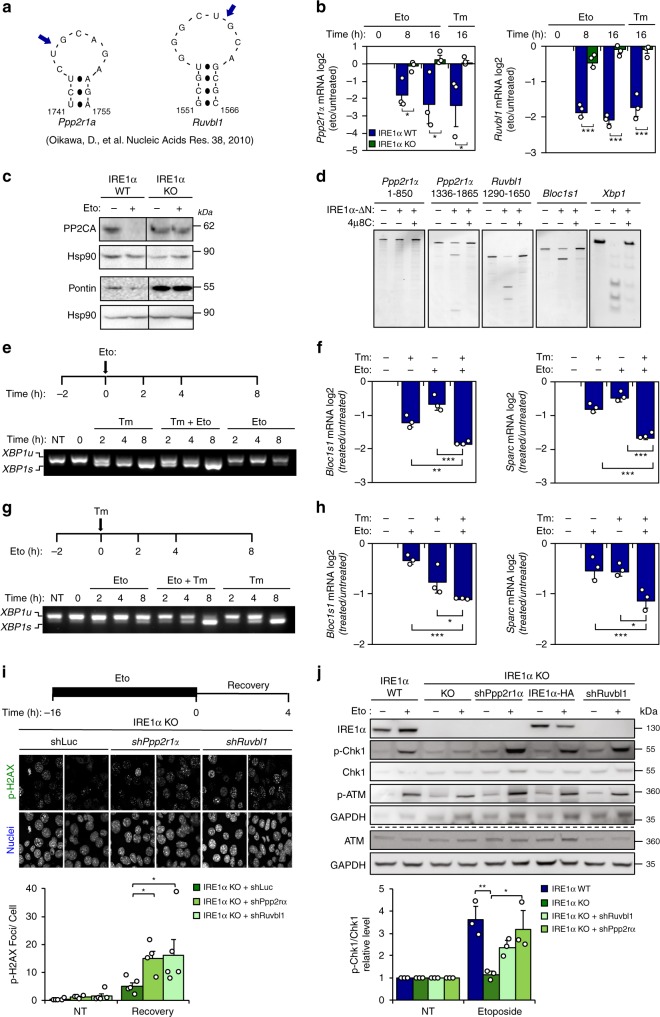
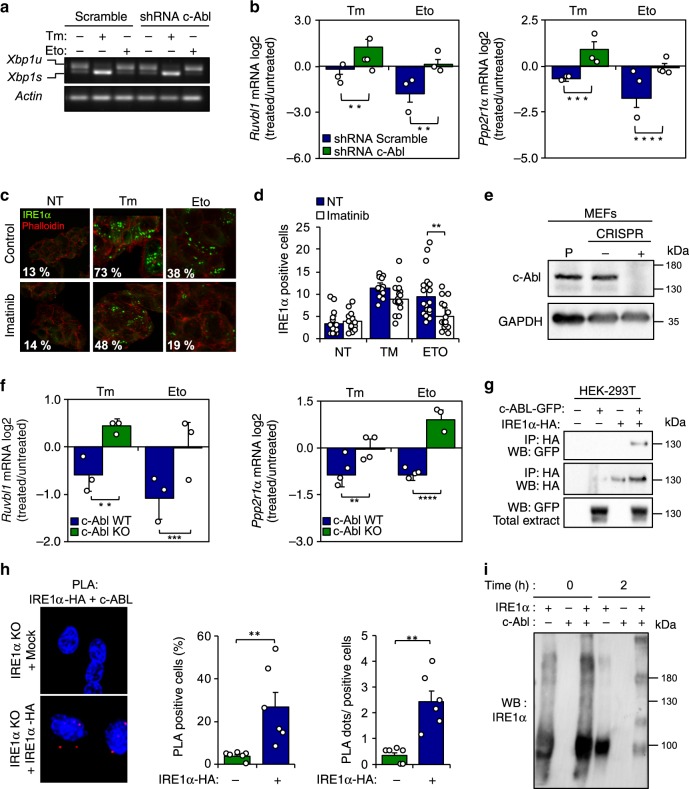
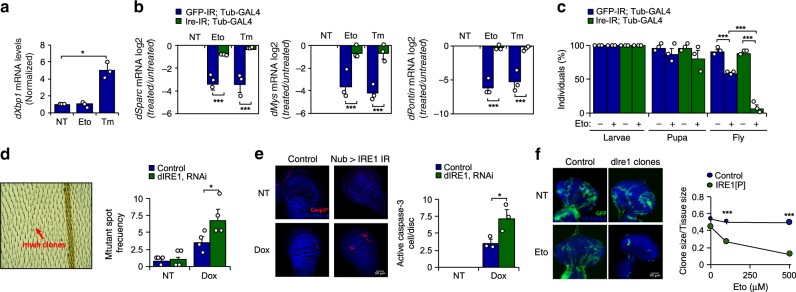
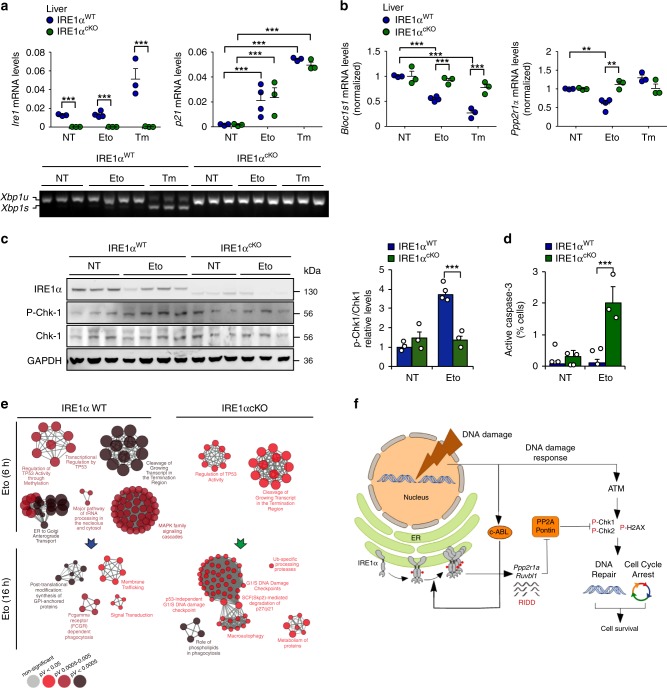
The molecular connections between homeostatic systems that maintain both genome integrity and proteostasis are poorly understood. Here we identify the selective activation of the unfolded protein response transducer IRE1α under genotoxic stress to modulate repair programs and sustain cell survival. DNA damage engages IRE1α signaling in the absence of an endoplasmic reticulum (ER) stress signature, leading to the exclusive activation of regulated IRE1α-dependent decay (RIDD) without activating its canonical output mediated by the transcription factor XBP1. IRE1α endoribonuclease activity controls the stability of mRNAs involved in the DNA damage response, impacting DNA repair, cell cycle arrest and apoptosis. The activation of the c-Abl kinase by DNA damage triggers the oligomerization of IRE1α to catalyze RIDD. The protective role of IRE1α under genotoxic stress is conserved in fly and mouse. Altogether, our results uncover an important intersection between the molecular pathways that sustain genome stability and proteostasis.


Conflict of interest statement

The authors declare no competing interests.

Figures

Fig. 1
Fig. 1. Selective activation of RIDD under DNA damage.
a MEF were treated with 10 μM etoposide (Eto) for indicated time points and phosphorylation levels of IRE1α were detected by Phostag assay (p: phosphorylated 0: non-phosphorylated bands). IRE1α levels were analyzed by western blot. Treatment with 500 ng/mL tunicamicyn (Tm) as positive control (8 h) (n = 3). b TREX-IRE1-3F6H-GFP cells were treated with 25 μM Eto (8 h) or 1 μg/mL Tm (4 h). IRE1-GFP foci were quantified by confocal microscopy (>200 cells, n = 3). c MEF were treated with either 100 ng/mL Tm, 10 μM Eto or 25 Gγ of ionizing radiation (IR) at indicated time points. Xbp1 mRNA splicing percentage was calculated by RT-PCR using densitometric analysis (left panel) (n = 3). d Xbp1s mRNA levels were quantified by real-time-PCR in samples described in c (n = 3). e WT and IRE1α KO cells were treated with 10 μM Eto (8 h and 16 h), IR (20 or 30 Gγ, 16 h) and the decay of mRNA levels of Bloc1s1 and Sparc was monitored by real-time-PCR. Treatment with 500 ng/mL Tm as positive control (n = 3). f WT and IRE1α KO cells were treated with 25 μM Eto, 1 μM 5-fluorouracil (5-FU), 1 μM hydroxyurea (HU) or 1 μg/mL Tm by 24 h and viability analyzed using propidium iodide (PI) staining and FACS (n = 3). g IRE1α KO (Mock) and IRE1α-HA reconstituted cells were treated with 10 µM Eto for 12 h and apoptosis monitored by caspase-3 positive cells (green). Nucleus (Red) was stained to visualize cells number (n = 3). h MEF cells treated 36 h with 0.5 μM Eto in combination with the IRE1α inhibitor 25 μM MKC-8866. Representative images. i WT cells were treated with 0.5 and 1 μM Eto or in combination with 25 μM MKC-8866 (36 h). Cell viability analyzed using PI staining and FACS (n = 3). All panels data is shown as mean ± s.e.m.; *p < 0.05, **p < 0.01, and ***p < 0.001, based on b two-tailed unpaired t-Student’s test, (c, d). One-way ANOVA followed Tukey’s test (eg, i), two-way ANOVA followed Bonferroni’s test. Data is provided as a Source Data file.
Fig. 2
Fig. 2. IRE1α deficiency impairs the DDR.
a IRE1α KO (Mock) and IRE1α-HA reconstituted cells were pre-incubated with 1 μM etoposide (Eto) for 16 h and washed three times with PBS and fresh cell culture media was added. The decay of phosphorylated H2AX (P-H2AX) was monitored over time by western blot (middle panel). Quantification of the levels of P-H2AX in cells stimulated with Eto (bottom panel) (n = 3). b IRE1α KO (Mock) and IRE1α-HA reconstituted cells were incubated with 10 μM Eto for 2 h and then washed with PBS and fresh culture media was added. The distribution P-H2AX expression (green) was monitored by indirect immunofluorescence using confocal microscopy. Nuclei were staining with DAPI (Blue). Quantification of P-H2AX per cell is shown (right panel) (n = 3). c WT and IRE1α KO MEFs cells were treated with 10 µM Eto for 3 h to perform the comet assay. Quantification of tail intensity and tail moment (Tail intensity × tail area) is shown (right panel) (n = 3). d WT and IRE1α KO MEFs cells were treated with 5 μM Eto for 3 h to determined cytokinesis-block micronucleus cytome assay (CBMC). Binucleated cells (BN) with micronucleus (MN), nuclear buds (Nbuds) or nucleoplasmid bridges (NPB; see arrows) were visualized and quantified using epifluorescence microscopy (n = 3). e WT and IRE1α KO MEFs cells were treated with 10 μM Eto for 8 h and cell cycle was analyzed by propidium iodide (PI) staining. Quantification of the percentage of cells in G0/G1 and S phases is shown. f WT and IRE1α KO MEFs cells were treated with 10 μM Eto for indicated times. Expression and phosphorylation levels of indicated proteins involved in the DDR were monitored by western blot (left panel). Quantification of the levels of p-CHK1 and p-CHK2 is shown (right panel) (n = 3). In all panels, data is shown as mean ± s.e.m.; *p < 0.05, **p < 0.01, and ***p < 0.001, based on (a, c, d, f) two-way ANOVA followed Bonferroni’s test, b two-way ANOVA followed Tukey’s test. Data is provided as a Source Data file.
Fig. 3
Fig. 3. IRE1α controls the stability of mRNAs involved in the DRR.
a Putative IRE1α cleavage sites on the Ppp2r1a and Ruvbl1 mRNAs (blue arrows). b WT and IRE1α KO MEF cells were treated with 10 μM etoposide (Eto). Ppp2r1a and Ruvbl1 mRNA levels were monitored by real-time-PCR. Treatment with 500 ng/mL tunicamicyn (Tm) as positive control (n = 3). c Cells were treated with 10 μM Eto (16 h) and PP2A and Pontin expression were monitored by western blot (n = 3). d In vitro RNA cleavage assay was performed using mRNA fragments of human Ppp2r1a and Ruvbl1, incubated in the presence or absence of recombinant cytosolic portion of IRE1α (IRE1α-ΔN) protein (30 min). Experiments were performed in presence or absence of IRE1α inhibitor 4μ8C. Blos1c1 and Xbp1 mRNA were used as positive controls. e Experimental setup (upper panel): MEF cells were pretreated with 100 ng/mL Tm for 2 h and then treated with 10 μM Eto. Xbp1 mRNA splicing was monitored by RT–PCR (bottom panel). f RIDD activity was monitored in samples described in e (n = 3). g Experimental setup (upper panel): MEF WT cells were pretreated with 10 μM Eto for 2 h and then treated with 100 ng/mL Tm. Xbp1 mRNA splicing was monitored by RT–PCR (bottom panel). h RIDD activity was monitored in samples described in g (n = 3). i IRE1α KO MEF cells were transduced with lentiviruses expressing shRNAs against Ppp2r1a (shPpp2r1a), Ruvbl1 (shRuvbl1) or luciferase (shLuc). Cells were incubated with 1 μM Eto (16 h), washed three times with PBS and fresh media was added. P-H2AX levels were monitored by immunofluorescence after 4 h. P-H2AX foci quantification is shown (Bottom panel) (>200 cells, n = 4–5). j WT, IRE1α KO and reconstituted with IRE1α-HA, expressing shRuvbl1, shPpp2r1a or shLuc cells were treated with 5 μM Eto for 8 h and P-CHK1 and P-ATM monitored by western blot. P-CHK1 quantification is shown (bottom panel) (n = 3). All panels data is shown as mean ± s.e.m.; *p < 0.05, **p < 0.01, and ***p < 0.001, based on b two-way ANOVA followed Bonferroni’s test, (f, hj) One-way ANOVA followed Tukey’s test. Data is provided as a Source Data file.
Fig. 4
Fig. 4. c-Abl contributes to the RIDD activation under DNA damage.
a c-Abl was knocked down through the stable delivery of an shRNA. Then cells were treated with 10 μM Etoposide (Eto) or 500 ng/mL tunicamicyn (Tm) for 8 h and Xbp1 mRNA splicing was monitored by RT–PCR (n = 3). b MEF ShRNA Scramble and ShRNA c-Abl cells were treated with 10 μM Eto or 500 ng/mL Tm for 8 h, and the decay of Ppp2r1a and Ruvbl1 was measured by real-time-PCR (n = 3). c Trex-IRE1-GFP cells were pre-treated with 10 μM imatinib by 1 h, and then treated with 10 μM Eto, or 500 ng/mL Tm for 8 h and IRE1-GFP foci visualized by confocal microscopy. d Quantification of the percentage of cells positive IRE1-GFP clusters is shown (>200 cells, n = 3). e c-Abl expression in CRISPR control and c-Abl KO cells was monitored by western blot (n = 3). f CRISPR control and c-Abl KO cells were treated with 10 μM Eto or 500 ng/mL Tm for 8 h, and the decay of Ruvbl1 and Ppp2r1a was measured by Real-Time-PCR (n = 3). g HEK-293T cells reconstituted with IRE1α-HA and c-Abl-GFP were exposed to 10 μM Eto for 8 h. Immunoprecipitation (IP) was performed using the HA epitope (IRE1α) and GFP (c-Abl) to assess the possible interaction with c-Abl. h IRE1α KO (Mock) and reconstituted cells with an IRE1α-HA were treated 8 h with 10 μM Eto and stained with a proximity ligation assay (PLA) using an anti-HA or anti-c-Abl antibodies and analyzed by confocal microscopy. Right panel: Number of dots per cell analyzed and percentage of PLA positive cells were quantified (n = 6). i Recombinant IRE1α and c-Abl proteins were incubated at indicated time points and assess its possible interaction by western blot. All data represents the mean ± s.e.m. of three independent experiments, except for co-IP that were performed twice. *p < 0.05, **p < 0.01, and ***p < 0.001, based on (b, f) two-way ANOVA followed Bonferroni’s test, (d, h) One-way ANOVA followed Tukey’s test. Data is provided as a Source Data file.
Fig. 5
Fig. 5. IRE1α expression confers protection against genotoxic stress in fly models.
a D. melanogaster larvae were fed with 100 μM etoposide (Eto) or 50 μg/ml tunicamycin (Tm) for 4 h and then dXbp1s mRNA evaluated by real-time PCR and normalized to the expression levels of dRpl32 gene (n = 3). b dIre1 mRNA was knocked down by expressing a specific RNAi constructs under the control of tubulin-Gal4 driver. D. melanogaster larvae were fed with 100 μM Eto or 50 μg/ml Tm for 4 h and the decay of RIDD targets dSparc, dPontin, and dMys mRNA was evaluated by RT-qPCR and normalized to the expression levels of dRpl32 mRNA (n = 3). c Control and dIre1 knockdown larvae were fed with 500 μM Eto and allowed to reach adulthood for survival analysis. The number of hatched flies was quantified (n = 20 per group) (n = 3). d A dIre1-RNAi expressing fly line was generated to specifically target dIre1 in the imaginal disc of D. melanogaster. The wing SMART assays test was used to monitor genomic alterations after targeting dIre1 in flies. Larvae in first instar were grown in food supplemented with the DNA damaging agent 0.125 mg/ml doxorubicin (Dox) or 0.5% DMSO as control. Adult flies from control and dIre1 RNAi larvae were fixed and the left wing analyzed for the number of mwh clones (right panel) (n = 3). e Using the same experimental setting described in d, imaginal discs were collected, fixed and caspase-3 positive cells detected by immunofluorescence. Nucleus was stained with TO-PRO3 to visualize total number of cells. Quantification of active caspase-3 cells per imaginal disc is presented (right panel) (n = 3). f Mutant knockout dIre1 cells (dIre1 clone) in the eye-antenna imaginal disc were marked with GFP (see methods). Quantification of the ratio clone size/disc size is presented (right panel) (n = 10 clones). In all panels, data is shown as mean ± s.e.m.; *p < 0.05, **p < 0.01, and ***p < 0.001, based on a one-way ANOVA followed Tukey’s test, bf two-way ANOVA followed Bonferroni’s test. Data is provided as a Source Data file.
Fig. 6
Fig. 6. IRE1α deletion in liver alters the DDR under genotoxic stress.
a IRE1α was conditionally deleted the liver using the MxCre and LoxP system (IRE1αcKO). Mice were intraperitoneally injected with 50 mg/Kg etoposide (Eto) or 1 mg/Kg tunicamycin (Tm) and sacrificed 6 h and 16 h later. Total mRNA levels of the deleted IRE1, and p21 were measured 6 h later in the liver by real-time-PCR (n = 3–4 mice per group). Xbp1 mRNA splicing (bottom panel) was monitored in the same samples by RT-PCR. b Liver extracts of animals described in a, Ppp2r1a and Bloc1s1 mRNA expression levels were measured 6 h later of Eto treatment by real-time-PCR (n = 3). c Protein liver extracts were obtained from mice treated described in a and the expression levels of indicated proteins were monitored 6 h later of Eto treatment by western blot. Quantification of the levels of p-CHK1 is shown (Right panel). d Mice from a were intraperitoneally injected with 50 mg/Kg Eto and sacrificed 48 h later. Then, livers active-caspase 3 detected by immunohistochemistry (n = 2–3). e Gene expression profile analysis was performed in mRNA from liver extracts of animals described in a. Most significant pathways altered by Eto administration in WT and IRE1α null livers are shown. Three independent biological samples were used. In all panels, data is shown as mean ± s.e.m.; *p < 0.05, **p < 0.01, and ***p < 0.001, based on ad two-way ANOVA followed Bonferroni’s test. Data is provided as a Source Data file. f Working model: genotoxic stress activates IRE1α in the absence of ER stress markers, selectively engaging RIDD. IRE1α degrades mRNAs involved in the DNA damage response encoding for Ppp2r1a and Ruvbl1, regulating the (de)phosphorylation of the histone H2AX and CHK-1/2. The non-canonical activation of IRE1α involves the participation of the c-Abl kinase that is activated by DNA damage response kinases as ATM. The expression and function of IRE1α is essential to promote survival under DNA damage conditions by controlling cell cycle arrest and DNA repair programs.

Similar articles

Cited by

References

    1. Pearl LH, Schierz AC, Ward SE, Al-lazikani B, Pearl FMG. Therapeutic opportunities within the DNA damage response. Nat. Rev. Cancer. 2015;15:166–180. doi: 10.1038/nrc3891. - DOI - PubMed
    1. Chevet E, Hetz C, Samali A. Endoplasmic reticulum stress–activated cell reprogramming in oncogenesis. Cancer Discov. 2016;5:586–597. doi: 10.1158/2159-8290.CD-14-1490. - DOI - PubMed
    1. Cubillos-Ruiz JR, Bettigole SE, Glimcher LH. Tumorigenic and immunosuppressive effects of endoplasmic reticulum stress in cancer. Cell. 2017;168:692–706. doi: 10.1016/j.cell.2016.12.004. - DOI - PMC - PubMed
    1. Walter P, Ron D. The unfolded protein response: from stress pathway to homeostatic regulation. Science. 2011;334:1081–1086. doi: 10.1126/science.1209038. - DOI - PubMed
    1. Hetz, C. & Papa, F. R. The unfolded protein response and cell fate control. Mol. Cell. 10.1016/j.molcel.2017.06.017 (2018). - PubMed

Publication types

MeSH terms