. 2020 May 12;12(5):1210.
doi: 10.3390/cancers12051210.

Advantages of Using Paclitaxel in Combination with Oncolytic Adenovirus Utilizing RNA Destabilization Mechanism

Affiliations

Advantages of Using Paclitaxel in Combination with Oncolytic Adenovirus Utilizing RNA Destabilization Mechanism

Elora Hossain et al. Cancers (Basel). .

Abstract

Oncolytic virotherapy is a novel approach to cancer therapy. Ad-fosARE is a conditionally replicative adenovirus engineered by inserting AU-rich elements (ARE) in the 3'-untranslated region of the E1A gene. In this study, we examined the oncolytic activity of Ad-fosARE and used it in a synergistic combination with the chemotherapeutic agent paclitaxel (PTX) for treating cancer cells. The expression of E1A was high in cancer cells due to stabilized E1A-ARE mRNA. As a result, the efficiency of its replication and cytolytic activity in cancer cells was higher than in normal cells. PTX treatment increased the cytoplasmic HuR relocalization in cancer cells, enhanced viral replication through elevated E1A expression, and upregulated CAR (Coxsackie-adenovirus receptor) required for viral uptake. Furthermore, PTX altered the instability of microtubules by acetylation and detyrosination, which is essential for viral internalization and trafficking to the nucleus. These results indicate that PTX can provide multiple advantages to the efficacy of Ad-fosARE both in vitro and in vivo, and provides a basis for designing novel clinical trials. Thus, this virus has a lot of benefits that are not found in other oncolytic viruses. The virus also has the potential for treating PXT-resistant cancers.

Keywords: ARE-mRNA; AU-rich element (ARE), HuR; CAR; E1A; Microtubules; Oncolytic adenovirus; Paclitaxel.


Conflict of interest statement

No conflict of interest.

Figures

Figure 1
Figure 1
The structure of Ad-fosARE and its production efficiency. (a) Schematic representation of Ad-fosARE with c-fos ARE in the 3′-UTR of the E1A gene. Arrows indicate the location of early (E1, 2, and 4) and late (L1–5) genes. (b) Expression of viral proteins in Ad-fosARE and WT300-infected cells. A549, HeLa, and BJ cells were infected by both viruses and the expression of early proteins E1A, E1B and (c) late proteins hexon, penton, and fiber (right) were estimated by western blot analysis. Actin expressions were also assessed as the internal control. (d) Cancer (HeLa, C33A, A549, and H1299) cells and normal (BJ) cells were infected with Ad-fosARE at an MOI of 10 ifu/cell and virus production was determined 48 h after infection. Each titer (ifu/ml) is shown on the graph. Data presented here are mean ± standard deviation of three independent experiments.
Figure 2
Figure 2
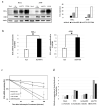
The effects of HuR-depletion on E1A mRNA stabilization and Ad-fosARE replication. (a) HeLa cells were given heat-shock at 43 °C for 2 h, and the amount of HuR in total, nuclear, and cytoplasmic fraction were determined using western blot analysis. β-tubulin and lamin expression were used as cytoplasmic and nuclear fraction markers (top). Virus production was assessed, and the values were compared to the non-treated cells (middle) (* indicates p < 0.05). HeLa cells were infected with Ad-fosARE (MOI 10 ifu/cell) and heat-shocked immediately after infection at 43 °C for 2 h. Transcriptions were inhibited by actinomycin D 5 µl/mL for 60, 120, and 180 minutes. After the indicated periods, cells were harvested and extracted for total cellular RNA. mRNA levels are quantified by quantitative real-time RT-PCR experiments, using Glyceraldehyde 3-phosphate dehydrogenase (GAPDH) as a normalization control. Graphs depict the percentage of remaining E1A mRNA levels with GAPDH mRNA and compared with the standards of normalized mRNA species measured immediately after the addition of actinomycin D and which were set as 100%. The half-lives of the mRNAs (min) are indicated as t½ (bottom). (b) HeLa cells were transfected with a HuR targeting siRNA (HuR 1, HuR 2, and HuR 3) and a negative control siRNA, and the expression of HuR was estimated by western blot analysis. (top) HuR KD-HeLa cells were infected with Ad-fosARE, and viral titers were determined as described in materials and methods after 48 h of virus infection. (bottom) siHuR, siRNA targeting HuR; siCont, control siRNA treated cells. Data shown above presented as mean ± standard deviation of three independent experiments.
Figure 3
Figure 3
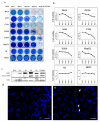
Cell lysis activity of Ad-fosARE. (a) Cancer (HeLa, A549, C33A, H1299, U2OS, and HepG2) cells and normal (BJ and HGF1) cells were infected with the virus at MOIs indicated. Cells were stained using Coomassie brilliant blue 7 days post-infection. Living cells stained blue. (b) Cell metabolic activities of Ad-fosARE-infected cells were measured to estimate the cell lysis activity using the XTT assay. The same cancer and normal cells were infected with the virus at a MOI of 100 ifu/cell and cell viabilities were estimated 1, 3, 5, and 7 days post infection. (c) Cleaved PARP levels were assessed by western blot analysis to detect the cell death activity mediated by Ad-fosARE. PARP expression in cisplatin-treated cells were used as a positive control [34]. (d) HeLa cells were infected with Ad-fosARE with MOI 100 ifu/cell. The apoptosis of cells was also analyzed by Hoechst 33,342 staining 96 h after infection. Nuclear fragmentation and chromatin clumping were observed in the virus treated cells (Yellow arrows). Scale bar: 50 µm. Three replicates represented each assay.
Figure 4
Figure 4
Comparison of the virus production and cell lysis activity of Ad-fosARE, dl1520 and WT300. (a) Cancer cells (HeLa, C33A, A549, and H1299) and normal cells (BJ) were infected with Ad-fosARE, WT300, and dl1520 at MOI of 10 ifu/cell. Virus production was assessed 48 h after infection. Each titer (ifu/ml) is shown on the graph. (b) Cell viabilities were estimated 7 days post-infection by XTT assay. Data presented here are mean ± standard deviations of three independent experiments.
Figure 5
Figure 5
Effects of paclitaxel on cytoplasmic HuR exportation and expression of CAR. (a) Cancer cells (HeLa, A549) and normal cells (BJ) were treated with 4 nM paclitaxel (PTX¬). Cell lysates were separated into the cytoplasmic and nuclear fractions, and HuR localization was estimated by western blot analysis. The level of the HuR protein was monitored in total cell lysates (TP), cytoplasmic (CP), and nuclear extracts (NP). Tubulin, Lamin, and actin are used as the internal control for each fraction. (b) After treatment with PTX, total HeLa cell lysate was collected, and western blot analysis was performed to detect CAR.
Figure 6
Figure 6
Assessment of combinatorial treatment’s effect (Ad-fosARE and PTX) on viral replication and cell lysis activity. (a) Cancer (HeLa and A549) cells and normal (BJ) cells were infected with Ad-fosARE at an MOI of 10 ifu/cell and 4 nM PTX. Virus production was determined 48 h after through Hexon staining. Each titer (ifu/mL) is shown on the graph. Data are shown above as the mean ± standard deviation of three independent experiments. (b) Cell lysis activities of combination treatment were measured using the XTT assay. As mentioned above, cancer and normal cells were infected with the virus at an MOI of 10 ifu/cell and cell viabilities were estimated 1, 3, 5, and 7 days after infection. (c) Prior mentioned cancer and normal cells were subjected to staining with Coomassie brilliant blue 7 days after infection to observe cytopathic effects. Living cells stained blue. (* indicates p < 0.05, ** indicate p < 0.01).
Figure 7
Figure 7
Effects of paclitaxel on Ad-fosARE replication. (a) To check the viral protein synthesis, HeLa and A549 cells were treated in combination with Ad-fosARE (MOI 10) and PTX (4 nM). E1A and E1B55kd were estimated by western blot analysis. Densitometric data of E1A expression (left) (b) With the same dose of treatment E1A mRNA was detected by quantitative real-time RT-PCR using GAPDH mRNA as a normalized control. (c) E1A mRNA stabilization in Ad-fosARE infected cells. HeLa cells were infected with Ad-fosARE and WT300 (MOI-10 ifu/cell) and combination with PTX. Transcriptions were inhibited by actinomycin D 5 µl/mL for 60, 120, and 180 minutes. After the indicated periods, cells were harvested and extracted for total cellular RNA. mRNA levels are quantified by quantitative real-time RT-PCR experiments using GAPDH as a normalization control. Graphs depict the percentage of remaining E1A mRNA levels with GAPDH mRNA and compared with the standards of normalized mRNA species measured immediately after the addition of actinomycin D and which were set as 100%. The half-lives of the mRNAs (min) are indicated as t½. (d) To determine post-translationally modified tubulin, HeLa cells were treated with either Ad-fosARE, PTX or a combination of both. The expression of acetylated and Glu-MTs was quantified by densitometry and the values were normalized to non-infected conditions. Data are shown as the mean ± standard deviation of three independent experiments (* indicates p < 0.05).
Figure 8
Figure 8
In vivo tumor lysis potential of the Ad-fosARE and PTX combination therapy in human cervical cancer xenograft nude mice. HeLa S3 cells were injected subcutaneously into the flanks of female BALB/C nude mice and allowed to grow to ~56 mm in diameter. PTX (0.4 mg in 100 µL of PBS) or vehicle (cremophor EL/dehydrated ethanol/saline) was given by intraperitoneal (i.p.) injection. 1 × 10⁶ ifu (100 µL) of Ad-fosARE or the same volume of PBS was injected intratumorally (i.t.) thrice (days 1, 4, and 7) directly into the tumors after PTX injection. Tumor volumes were calculated by the following equation: Volume (mm3) = A × B2 × 0.5 (A is considered the longest diameter; B is considered shortest diameter). * indicates p < 0.05, ** indicate p < 0.001.

Similar articles

Cited by

References

    1. Alemany R., Balague C., Curiel D.T. Replicative adenoviruses for cancer therapy. Nat. Biotechnol. 2000;18:723–727. doi: 10.1038/77283. - DOI - PubMed
    1. Kirn D. Replication-selective Oncolytic Adenoviruses: Virotherapy aimed at genetic targets in cancer. Oncogene. 2000;19:6660–6669. doi: 10.1038/sj.onc.1204094. - DOI - PubMed
    1. Abou El Hassan M.A., Van der Meulen-Muileman I., Abbas S., Kruyt F.A. Conditionally replicating adenoviruses kill tumor cells via a basic apoptotic machinery—independent mechanism that resembles necrosis-like programmed cell death. J. Virol. 2004;78:12243–12251. doi: 10.1128/JVI.78.22.12243-12251.2004. - DOI - PMC - PubMed
    1. Espel E. The Role of the AU-rich Elements of mRNAs in Controlling translation. Semin. Cell Dev. Biol. 2005;16:59–67. doi: 10.1016/j.semcdb.2004.11.008. - DOI - PubMed
    1. Kruys V., Wathelet M., Poupart P., Contreras R., Fiers W., Content J., Huez G. The 3 untranslated region of the human interferon-beta mRNA has an inhibitory effect on translation. Proc. Natl. Acad. Sci. USA. 1987;84:6030–6034. doi: 10.1073/pnas.84.17.6030. - DOI - PMC - PubMed