. 2020 Jun;14(3):127-132.
doi: 10.1049/iet-syb.2019.0029.

Robustness of a biomolecular oscillator to pulse perturbations

Affiliations

Robustness of a biomolecular oscillator to pulse perturbations

Soumyadip Banerjee et al. IET Syst Biol. 2020 Jun.

Abstract

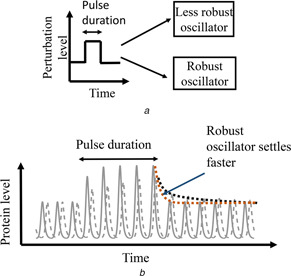
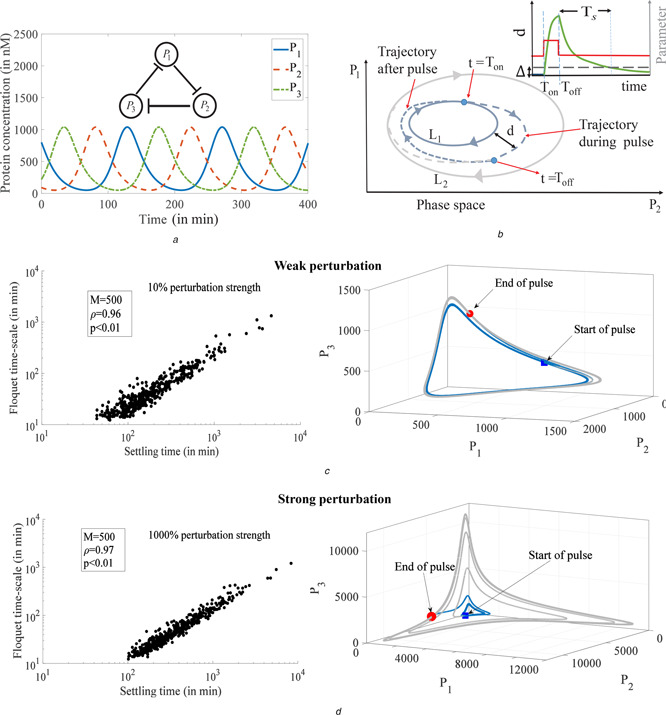
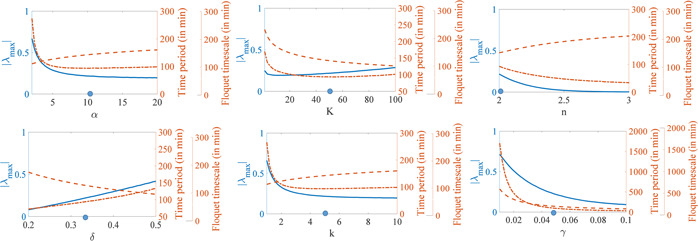
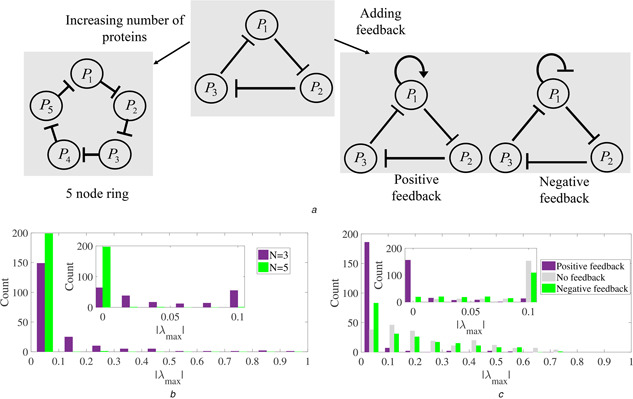
Biomolecular oscillators can function robustly in the presence of environmental perturbations, which can either be static or dynamic. While the effect of different circuit parameters and mechanisms on the robustness to steady perturbations has been investigated, the scenario for dynamic perturbations is relatively unclear. To address this, the authors use a benchmark three protein oscillator design - the repressilator - and investigate its robustness to pulse perturbations, computationally as well as use analytical tools of Floquet theory. They found that the metric provided by direct computations of the time it takes for the oscillator to settle after pulse perturbation is applied, correlates well with the metric provided by Floquet theory. They investigated the parametric dependence of the Floquet metric, finding that the parameters that increase the effective delay enhance robustness to pulse perturbation. They found that the structural changes such as increasing the number of proteins in a ring oscillator as well as adding positive feedback, both of which increase effective delay, facilitates such robustness. These results highlight such design principles, especially the role of delay, for designing an oscillator that is robust to pulse perturbation.


Figures

Fig. 1
Fig. 1
Illustration of an oscillator's robustness to pulse perturbation (a) Schematic showing pulse perturbation applied to two oscillators, one robust and other less robust, (b) Solid line shows the response of a robust oscillator and dashed line shows the response of less robust oscillator. The dotted line indicates the envelope of the response
Fig. 2
Fig. 2
Dominant Floquet multiplier as a measure of robustness to pulse perturbation (a) Deterministic simulation of the repressilator model showing the time trace of the three protein concentrations P1, P2, and P3. The simulation is performed using the nominal parameters: promoter strength, α = 10 nM/min (under full induced condition) and α 0 = 5 × 10−4 nM/min (under repressed condition), dissociation constant, K = 50 nM, Hill coefficient, n = 2 and mRNA half‐life = 1/δ = 3 min and protein half‐life = 1/γ = 20 min and k=5min1, (b) Approach used to compute the settling time is shown. The solid blue closed curve represents an oscillating trajectory L 1 and the grey closed curve with arrows represents the oscillating trajectory L 2. The dashed blue line represents the trajectory of the perturbed oscillator undergoing a transition between L 1 and L 2. In the inset, the green solid line shows the variation of the minimum distance d between the perturbed trajectory and L 1 with time. The variation of the parameter with time is shown in red. The bound Δ is shown as a black dashed line, (c) The left figure shows the scatter plot showing the correlation between the Floquet timescale (τ) and settling time (T s) computed directly for low perturbation strength. Each point represents a periodic orbit corresponding to a parameter set chosen within a range of the nominal parameter set α = 2–20, K = 1–100, n = 2–4, δ = 0.2–0.5, k = 1–10, γ = 0.01–0.1. In the inset, M denotes the total number of parameter sets randomly chosen within the above range, ρ denotes the correlation coefficient and p denotes the p‐index. For the settling time computation bound, Δ is chosen to be 0.5. The right figure shows the response of the repressilator operating at the nominal parameter to weak perturbation. The grey solid line represents the perturbed trajectory of the oscillator when the pulse is on and the blue solid line represents the perturbed trajectory in the post pulse period. The blue square represents the onset of pulse whereas, the red filled circle represents the end of the pulse, (d) Similar plots as in (c), corresponds to high perturbation strength
Fig. 3
Fig. 3
Robustness to pulse perturbation depends on the choice of intrinsic parameters. In each plot, the solid blue line represents the variation of the dominant Floquet multiplier λmax with the parameter indicated on the x‐axis. The red dot‐dashed line represents the settling time τ predicted by Floquet analysis. The red dashed line represents the time period, T. The range of parameters are taken around the nominal value which is indicated by a blue filled circle on the x‐axis
Fig. 4
Fig. 4
Structural modifications in repressilator can improve its robustness to pulse perturbation (a) Schematic showing two possible ways to modify the repressilator structure, (b) Bar plot showing the distribution of dominant Floquet multipliers obtained for 200 periodic orbits of three‐node (N=3) and five‐node (N=5) circuits. The inset shows the distribution of the dominant Floquet multiplier within the range 0–0.1. The parameter sets in both cases are chosen from a nominal parameter range of the repressilator, (c) Bar plot showing the distribution of dominant Floquet multipliers obtained for 200 periodic orbits each for three different feedback models. The distribution with violet bars is for the positive feedback model, the grey bar for the no feedback model, and the green bar for the negative feedback model. The inset within the figure shows the distribution of the dominant Floquet multiplier within the range 0–0.1. The range of parameters chosen for the feedback models are: α = 2–20, α s = 5–50, α n = 5–50, K = 1–10, J = 100–500, n = 2, m = 2, δ = 0.2–0.5, k = 1–10, γ = 0.01–0.1

Similar articles

References

    1. Barkai N., and Leibler S.: ‘Robustness in simple biochemical networks’, Nature, 1997, 387, (6636), p. 913 - PubMed
    1. Peschel N., and Helfrich‐Förster C.: ‘Setting the clock‐by nature: circadian rhythm in the fruitfly Drosophila melanogaster ’, FEBS L., 2011, 585, (10), pp. 1435–1442 - PubMed
    1. Stelling J., Gilles E.D., and Doyle F.J.: ‘Robustness properties of circadian clock architectures’, Proc. Natl. Acad. Sci., 2004, 101, (36), pp. 13210–13215 - PMC - PubMed
    1. Shinar G., Milo R., and Martínez M.R. et al.: ‘Input–output robustness in simple bacterial signaling systems’, Proc. Natl. Acad. Sci., 2007, 104, (50), pp. 19931–19935 - PMC - PubMed
    1. Potvin T.L., Lord N.D., and Vinnicombe G. et al.: ‘Synchronous long‐term oscillations in a synthetic gene circuit’, Nature, 2016, 538, (7626), pp. 514–517 - PMC - PubMed

Publication types

LinkOut - more resources