. 2020 May 13;20(1):12.
doi: 10.1186/s12861-020-00215-3.

Ephrin-B2 paces neuronal production in the developing neocortex

Affiliations

Ephrin-B2 paces neuronal production in the developing neocortex

Anthony Kischel et al. BMC Dev Biol. .

Abstract

Background: During mammalian cerebral cortex development, different types of projection neurons are produced in a precise temporal order and in stereotypical numbers. The mechanisms regulating timely generation of neocortex projection neurons and ensuring production in sufficient numbers of each neuronal identity are only partially understood.

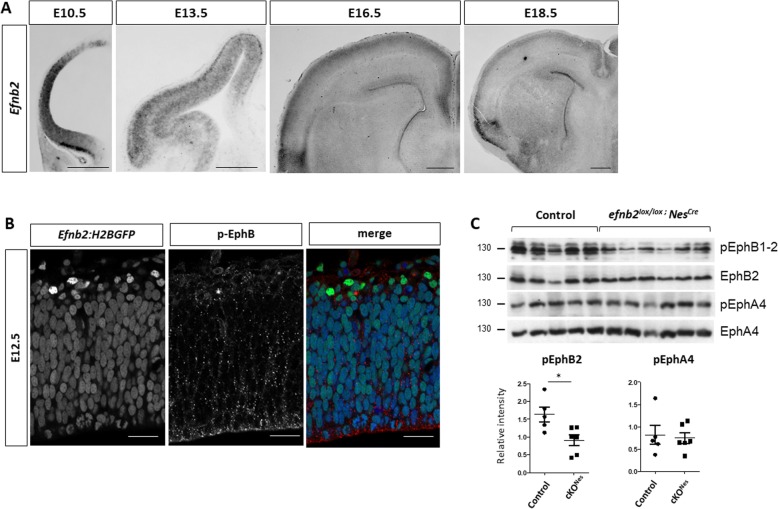
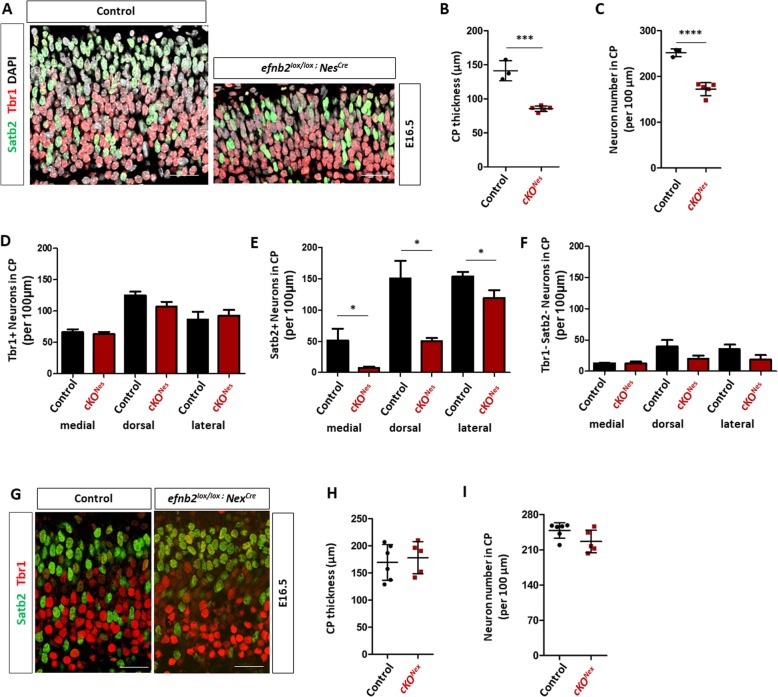
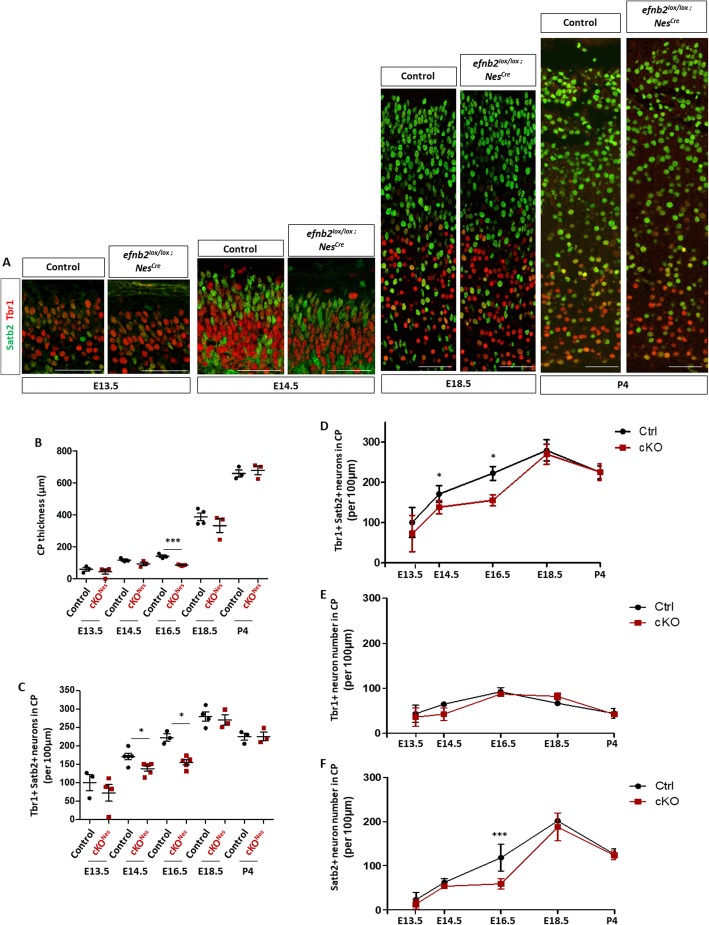
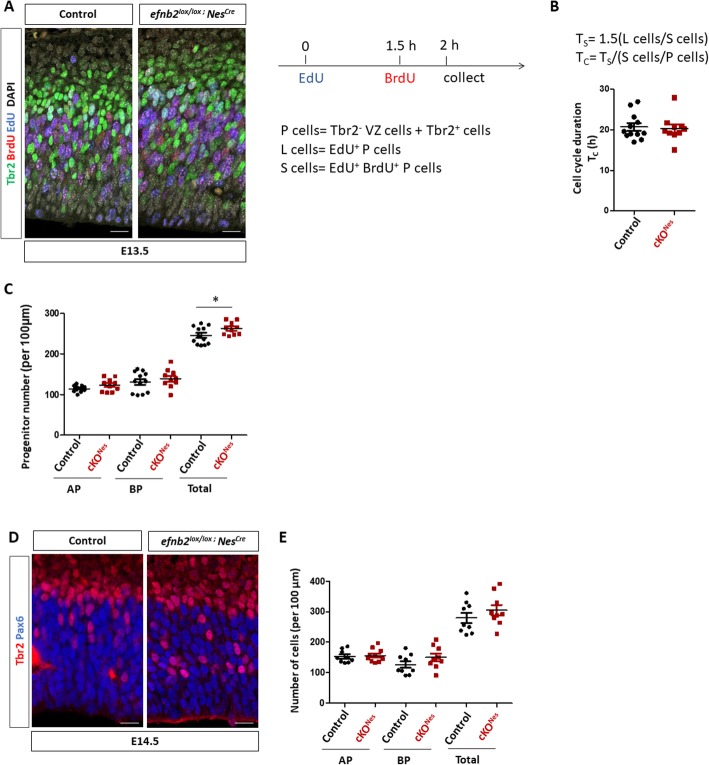
Results: Here, we show that ephrin-B2, a member of the Eph:ephrin cell-to-cell communication pathway, sets the neurogenic tempo in the neocortex. Indeed, conditional mutant embryos for ephrin-B2 exhibit a transient delay in neurogenesis and acute stimulation of Eph signaling by in utero injection of synthetic ephrin-B2 led to a transient increase in neuronal production. Using genetic approaches we show that ephrin-B2 acts on neural progenitors to control their differentiation in a juxtacrine manner. Unexpectedly, we observed that perinatal neuron numbers recovered following both loss and gain of ephrin-B2, highlighting the ability of neural progenitors to adapt their behavior to the state of the system in order to produce stereotypical numbers of neurons.

Conclusions: Altogether, our data uncover a role for ephrin-B2 in embryonic neurogenesis and emphasize the plasticity of neuronal production in the neocortex.

Keywords: Eph:ephrin signaling; Mouse; Neocortex; Neural progenitors; Neurogenesis.


Conflict of interest statement

The authors declare that they have no competing interests.

Figures

Fig. 1
Fig. 1
Ephrin-B2 is dynamically expressed in the developing neocortex. a. Efnb2 in situ hybridization on transverse sections of the neocortex at different developmental stages (indicated). Scale bar: 500 μm. b. Epifluorescence (GFP; green) detection on a transverse section of the neocortex of an E12.5 Efnb2:H2BGFP embryo. The section was immunostained with a phospho-EphB1–2 antibody (red) and Draq5 (blue). c. Western blot analysis of E13.5 neocortex tissue extracted from control (n = 5) and Efnb2lox/lox; Nes-Cre (n = 6) embryos. Antibodies are indicated on the side. Quantification of the signal (bottom) shows the ratio between pEph and total Eph
Fig. 2
Fig. 2
Loss of ephrin-B2 in progenitors impairs neuronal production. a. Transverse sections of the CP of the dorsal neocortex of E16.5 control and Efnb2lox/lox; Nes-Cre embryos were immunostained for Tbr1 (red), Satb2 (green) and DAPI. b. Measurement of CP thickness in control (n = 3) and Efnb2lox/lox; Nes-Cre (n = 5) embryos. The data is the average of lateral, dorsal, medial measurements. c. Quantification of the number of neurons in the CP of the neocortex. The graph represents total neuron numbers in control (n = 3) and Efnb2lox/lox; Nes-Cre (n = 5) embryos. The data is the average of lateral, dorsal, medial counts. d. Quantification of the number of Tbr1+ neurons in medial, dorsal and lateral regions of the CP of the neocortex in control (n = 3) and Efnb2lox/lox; Nes-Cre (n = 5) E16.5 embryos. e. Quantification of the number of Satb2+ neurons in medial, dorsal and lateral regions of the CP of the neocortex in control (n = 3) and Efnb2lox/lox; Nes-Cre (n = 5) E16.5 embryos. f. Quantification of the number of Tbr1-Satb2- neurons in medial, dorsal and lateral regions of the CP of the neocortex in control (n = 3) and Efnb2lox/lox; Nes-Cre (n = 5) E16.5 embryos. g. Transverse sections of the CP of the neocortex of E16.5 control and Efnb2lox/lox; Nex-Cre embryos were immunostained for Tbr1 (red) and Satb2 (green). h. Measurement of CP thickness in control (n = 5) and Efnb2lox/lox; Nex-Cre (n = 5) embryos. The data is the average of lateral, dorsal, medial measurements. i. Quantification of the number of neurons in the CP of the neocortex. The graph represents total neuron numbers in control (n = 5) and Efnb2lox/lox; Nex-Cre (n = 5) embryos. The data is the average of lateral, dorsal, medial counts. Data are reported as mean ± SEM (*P < 0.05; ***P < 0.001; ****P < 0.0001). CP: cortical plate. Scale bars B-G: 50 μm
Fig. 3
Fig. 3
The decrease in neuronal number in the neocortex of Efnb2 cKONes is transient. a. Transverse sections of the CP of the neocortex of control and Efnb2lox/lox; Nes-Cre embryos at different developmental stages (indicated) were immunostained for Tbr1 (red) and Satb2 (green). b. Measurement of CP thickness in control (n = 3 or 4) and Efnb2lox/lox; Nes-Cre (n = 3 or 4) embryos at all stages. c. Quantification of the number of neurons in the CP of the neocortex at all stages. The graph represents the number of Tbr1+ and Satb2+ neurons in control and Efnb2lox/lox; Nes-Cre embryos. d. Mean total neuron numbers at each developmental stages of both genotypes were plotted on a curve graph. e. Mean numbers of Tbr1+ neurons at each developmental stage were plotted on a curve graph. f. Mean numbers of Satb2+ neurons at each developmental stage were plotted on a curve graph. Data on graphs are reported as mean ± SEM, unpaired t-test and 1-way ANOVA with Bonferroni’s multiple comparison test (*P < 0.05; ***P < 0.001). CP: cortical plate. Scale bars: 50 μm
Fig. 4
Fig. 4
Cell cycle duration and numbers of progenitors in Efnb2 cKONes. a. Transverse sections of the neocortex of EdU/BrdU-injected E13.5 control and Efnb2lox/lox; Nes-Cre embryos were immunostained for BrdU (red), Tbr2 (green) and EdU (blue). Scale bars: 25 μm. The injection protocol and the various cell populations that were counted are indicated on the right. b. S-phase duration (Ts) and cell cycle duration (Tc) were calculated using the indicated formulas. The graph shows Tc in control (n = 6) and Efnb2lox/lox; Nes-Cre embryos (n = 5). Data for each counted hemisphere are plotted. c. Quantification of AP (Tbr2-), BP (Tbr2+) and total progenitor numbers in control (n = 6) and Efnb2lox/lox; Nes-Cre embryos (n = 5). Data for each counted hemisphere and mean ± SEM are reported, unpaired t-test with Welch’s correction (*P < 0.05). d. Transverse sections of the neocortex of E14.5 control and Efnb2lox/lox; Nes-Cre embryos were immunostained for Tbr2 (red) and Pax6 (blue). Scale bars: 25 μm. e. Quantification of AP (Pax6+), BP (Tbr2+) and total progenitor numbers in control (n = 4) and Efnb2lox/lox; Nes-Cre embryos (n = 4). Mean ± SEM are reported. AP: apical progenitors; BP: basal progenitors
Fig. 5
Fig. 5
Acute injection of eB2-Fc in the lateral ventricle leads to an increased neuronal production. a. Transverse sections of the neocortex of E15.5 or E18.5 control injected embryos (IgG) (n = 4) and embryos injected with eB2-Fc (n = 4) were immunostained for Tbr1 (red) and Satb2 (green). Scale bars: 50 μm. b. Quantification of the number of neurons in the neocortex of E15.5 and E18.5 embryos. The graph represents numbers of Tbr1+ and Satb2+ neurons in the lateral region of the neocortex in control and eB2-Fc injected embryos. c. Quantification of the number of Tbr1+ and Satb2+ neurons in the neocortex of E15.5 injected embryos (dorsal region of the neocortex). Data for each counted hemisphere are plotted. d. Transverse sections of the ventricular zone and subventricular zone of E15.5 control injected embryos (IgG) and embryos injected with eB2-Fc (dorsal region of the neocortex) were immunostained for Pax6 (red) and Tbr2 (green). Scale bars: 20 μm. e. Quantification of the number of Pax6+ and Tbr2+ progenitors in IgG (n = 4) and eB2-Fc (n = 5) injected embryos. Data for each counted hemisphere are plotted. Data are reported as mean ± SEM. Mann-Whitney statistical test (*P < 0.05; **P < 0.01)

Similar articles

Cited by

References

    1. Herculano-Houzel S, Mota B, Lent R. Cellular scaling rules for rodent brains. Proc Natl Acad Sci U S A. 2006;103(32):12138–12143. doi: 10.1073/pnas.0604911103. - DOI - PMC - PubMed
    1. Greig LC, Woodworth MB, Galazo MJ, Padmanabhan H, Macklis JD. Molecular logic of neocortical projection neuron specification, development and diversity. Nat Rev Neurosci. 2013;14(11):755–769. doi: 10.1038/nrn3586. - DOI - PMC - PubMed
    1. Lodato S, Shetty AS, Arlotta P. Cerebral cortex assembly: generating and reprogramming projection neuron diversity. Trends Neurosci. 2015;38(2):117–125. doi: 10.1016/j.tins.2014.11.003. - DOI - PMC - PubMed
    1. Harris KD, Shepherd GM. The neocortical circuit: themes and variations. Nat Neurosci. 2015;18(2):170–181. doi: 10.1038/nn.3917. - DOI - PMC - PubMed
    1. Malatesta P, Hartfuss E, Gotz M. Isolation of radial glial cells by fluorescent-activated cell sorting reveals a neuronal lineage. Development. 2000;127(24):5253–5263. - PubMed

Publication types

MeSH terms

LinkOut - more resources