. 2020 May 18;53(4):458-472.e5.
doi: 10.1016/j.devcel.2020.04.010. Epub 2020 May 7.

DNA Helicase Mph1FANCM Ensures Meiotic Recombination between Parental Chromosomes by Dissociating Precocious Displacement Loops

Affiliations

DNA Helicase Mph1FANCM Ensures Meiotic Recombination between Parental Chromosomes by Dissociating Precocious Displacement Loops

Rima Sandhu et al. Dev Cell. .

Abstract

Meiotic pairing between parental chromosomes (homologs) is required for formation of haploid gametes. Homolog pairing depends on recombination initiation via programmed double-strand breaks (DSBs). Although DSBs appear prior to pairing, the homolog, rather than the sister chromatid, is used as repair partner for crossing over. Here, we show that Mph1, the budding yeast ortholog of Fanconi anemia helicase FANCM, prevents precocious DSB strand exchange between sister chromatids before homologs have completed pairing. By dissociating precocious DNA displacement loops (D-loops) between sister chromatids, Mph1FANCM ensures high levels of crossovers and non-crossovers between homologs. Later-occurring recombination events are protected from Mph1-mediated dissociation by synapsis protein Zip1. Increased intersister repair in absence of Mph1 triggers a shift among remaining interhomolog events from non-crossovers to crossover-specific strand exchange, explaining Mph1's apparent anti-crossover function. Our findings identify temporal coordination between DSB strand exchange and homolog pairing as a critical determinant for recombination outcome.

Keywords: D-loop; DNA helicase; DSB repair; FANCM; Fanconi anemia; Mph1; homologous pairing; meiosis; partner choice; recombination.


Conflict of interest statement

Declaration of Interests The authors declare no competing interests.

Figures

Fig. 1.
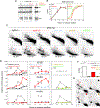
Fig. 1.. Weak Homolog Bias prior to Pairing Completion is Compensated for by Enhanced Crossover-Specific Strand Exchange (23˚C).
(A) DSBs and crossovers at the HIS4::LEU2 hotspot. 1D gel Southern blot analysis of XhoI-digested genomic DNA. (B) Schematic depiction of recombination intermediates and products at HIS4::LEU2. Circled X indicates XhoI sites. #, only one of four IH-SEI intermediates is shown (Hunter and Kleckner, 2001); *, double digestion with XhoI and BamHI detects subsets of crossovers (CO-1) and non-crossovers (NCO-1) as well as a subset of CO-2 (R1) and a mixture of COs and NCOs (R2; see Fig. S1C). (C) 2D gel Southern blot analyses of JMs in (i) SPO11 and (ii) spo11-HA/yf. (D) 1D gel Southern blot analysis of COs and NCOs in (i) SPO11 and (ii) spo11-HA/yf. (E) Quantitative analysis in SPO11 (left) and spo11-HA/yf (right) of (i) DSBs in dmc1Δ; and (ii) DSBs, (iii) SEIs, IH-dHJs and IS-dHJs and (iv) COs and NCOs in WT. Filled rectangles indicate 50% entry and 50% exit times, perpendicular error bars indicate SDs (see Table S1). In (iii), the rectangle indicates the combined lifespan of IH-SEIs and IH-dHJs. In (iv), the red dot indicates average maximum levels and 50% entry times of COs, error bars indicate SDs. Vertical dashed lines mark t = 8 h. (F) Homolog pairing and recombination at normal (SPO11) or reduced DSB abundance (spo11-HA/yf). (i) Nuclei exhibiting two GFP dot(s) within ≤ 400 nm or one GFP dot in SPO11 ndt80Δ and spo11-HA/yf ndt80Δ. GFP-tetR marks homologous positions at LEU2 (n = 2) or non-homologous positions on different chromosomes (LEU2 and LYS2; n = 2). See Fig. S2A. (ii) Unpaired (green): Average frequencies of SPO11 ndt80Δ nuclei with homologous GFP foci separated by > 400 nm. Paired (black): Single GFP focus or focus pairs within ≤ 400 nm arising from homologous GFP tag positions adjusted for non-homologous GFP pairs (n = 3). Dotted and continuous red lines indicate zygotene and pachytene entry, respectively (n = 2). Also see Fig. S3B. Vertical arrows indicate average times of 50% exit from the “unpaired” stage (green) and 50% entry into the “paired” stage (black). Error bars (SD) are shown at the end of arrows in (iii).<\p>Recombination kinetics in (iii) SPO11 NDT80 and (iv) spo11-HA/yf NDT80. Filled rectangles are from Fig. 1E. (G) Kinetic analysis of IH-SEI, IH-dHJ and IS-dHJ in (i) SPO11 and (ii) spo11-HA/yf. Red horizontal bars indicate the time interval between IH-SEIs and IH-dHJs. (H) Inverse correlation between homolog bias and CO bias. IS:IH ratios are from the work presented here (23˚C) and from Joshi et al. (2015) (33˚C). IS:IH and CO:NCO ratios at the time of their respective maximum levels were determined in the same DNA samples. Error bars, SD (see Fig. S1C-ii, Table S1 for details).
Fig. 2.
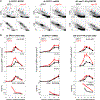
Fig. 2.. DNA Helicase Mph1 Dissociates DSB First End Strand Exchange Intermediates.
(A) 1D gel Southern blot analyses of DSBs in a dmc1Δ background also carrying mutations sgs1-md or mph1Δ (left panel), or srs2Δ (s), mph1Δ (m), or ndt80Δ (n) (right panel). (B) Quantitation of DSBs in Fig. 2A. (C) Excerpts of 2D gel analyses in dmc1Δ background. Lower panels show enlarged excerpts from upper panels. Also see Fig. S4A. (D) Quantitation of SEIs, IS-dHJs and IH-dHJs. Intermediates are expressed as fractions of maximum levels in parallel WT cultures. Asterisk, for srs2Δ and ndt80Δ, SEIs were not quantitated due to weak signal intensities. (E) Excerpts of 2D gel analyses of WT, dmc1Δ, dmc1Δ mph1Δ, and dmc1Δ mph1Δ rad51-II3A following PvuII digestion. Parents carry identical PvuII sites separated by 5.5 kb at HIS4LEU2, and IS- and IH-dHJs comigrate. Also see Fig. S4D. (F) Quantitation of dHJs at t = 6 h (WT) or t =7 h (other genotypes) in dmc1Δ mph1Δ in presence (RAD51) or absence of Rad51 strand exchange activity (rad51-II3A). Error bars indicate range (n = 2).
Fig. 3.
Fig. 3.. Mph1 Delays Stable Strand Invasion to Minimize Exchange between Sister Chromatids.
(A) Excerpts from 2D gel Southern blot analyses in MPH1 and mph1Δ at times of earliest JM detection (“early”) and times of maximum JM levels (“max”). (i) NDT80 SPO11, (ii) ndt80Δ SPO11, and (iii) NDT80 spo11-HA/yf. For complete 2D gels, see Fig. S5 (B) Top: Quantitative analysis of JMs in MPH1 and mph1Δ in the indicated strain backgrounds. JM levels are expressed as fractions of peak levels of the respective species in the parallel MPH1 culture. Bottom: Ratios of IS-dHJs to IH-dHJs. Dotted vertical lines indicate the time of maximum JMs in WT. (i) NDT80 SPO11. *, JM peak levels in MPH1 are 1.6 % (IH + IS-SEIs), 0.60 % (IS-dHJs) and 0.99 % (IH-dHJs). (ii) ndt80Δ SPO11. #, JM average maximum levels at t = 8 h in MPH1 are 1.3 ± 0.26 % (IH + IS-SEIs), 0.49 ± 0.17 % (IS-dHJs) and 4.9 ± 1.2 % (IH-dHJs), n = 3; error bars, SD. (iii) NDT80 spo11-HA/yf. ‡, JM average peak levels in MPH1 are 0.54 ± 0.01 % (IH + IS-SEIs), 0.23 ± 0.05 % (IS-dHJs) and 0.19 ± 0.04 % (IH-dHJs). n = 2; error bars indicate ranges.
Fig. 4.
Fig. 4.. MPH1-Mediated Interhomolog Recombination Contributes to Crossovers and Non-Crossovers.
(A) 1D gel Southern blot analyses of COs and NCOs in MPH1 and mph1Δ in the following backgrounds: (i) SPO11 at 23˚C, (ii) ndt80Δ at 23˚C and 30˚C, and (iii) spo11-HA/yf at 23˚C. (B) Quantitative analyses of COs and NCOs. (i) In SPO11, multiple pairs of MPH1 and mph1Δ cultures are shown. Timing of all species is shown relative to the JM peak time (dotted line; see Fig. S5B). Signals are expressed as fractions of maximum levels in a parallel WT culture. Average maximum levels in MPH1 are 4.2 ± 1.5% (COs) and 3.4 ± 1.4% (NCOs). n = 5; error bars, SD. (ii) In ndt80Δ, CO and NCO levels are expressed as fractions of maximum levels in a parallel WT culture (NDT80), i.e. 6.5% (COs) and 5.6% (NCOs). Also see Fig. S6B. (iii) In spo11-HA/yf, COs and NCOs are expressed as fractions of the average maximum levels in spo11-HA/yf MPH1 [2.8 ± 0.2 % (CO) and 1.1 ± 0.1 % (NCO), respectively]. n = 2; error bars indicate range. (C) Spore viabilities in MPH1 and mph1Δ at normal (left) and decreased DSB levels (right). Numbers of spores analyzed are n = 400 (MPH1 SPO11); n = 240 (mph1ΔSPO11); n = 240 (MPH1 spo11-HA/yf); n = 480 (mph1Δ spo11-HA/yf, from N = 2 meiotic cultures). (D) Meiotic progression in MPH1 and mph1Δ in SPO11 and spo11-HA/yf.
Fig. 5.
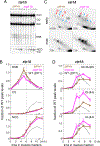
Fig. 5.. ZIP1 Antagonizes Mph1-Mediated Dissociation of Late JM Intermediates.
(A) 1D gel Southern blot analyses of DSBs and COs (top) as well as COs and NCOs (bottom) in WT and mph1Δ in a zip1Δ background. (B) Quantitative analysis of blots in Fig. 5A. Duplicate cultures were compared to a parallel WT culture (MPH1 ZIP1). (C) Excerpts from 2D gel analyses in MPH1 and mph1Δ in a zip1Δ background at times of earliest JM detection (“early”) and times of maximum JM levels (“max”). (D) Quantitative analysis of JMs in MPH1 and mph1Δ in a zip1Δ background. Dotted vertical lines indicate time of maximum JMs in WT. *, JM maximum levels in MPH1 are0.5 % (IH + IS-SEIs), 0.23 % (IS-dHJs) and 0.68 % (IH-dHJs). n = 2; error bars indicate range.
Fig. 6.
Fig. 6.. Independent Contributions of MPH1 and SGS1 to Recombination.
(A) 1D gel Southern blot analysis of COs and NCOs in WT, mph1Δ, sgs1-md, and sgs1-md mph1Δ cultures at 23˚C. (B) Quantitative analysis of COs and NCOs. The dotted line indicates the time of JM maximum levels (t = 5 h). Levels are expressed as fraction of WT maximum levels. Also see Fig. S8. (C) Excerpts of 2D gel analyses at maximum JM levels at 23˚C in sgs1-md and mph1Δ single and double mutants. (D) Top: Quantitative analysis of JMs. The dotted line indicates the JM peak time in WT. Average WT peak levels are 1.2 ± 0.58 % (IH + IS-SEIs), 0.65 ± 0.27 % (IS-dHJs) and 1.6 ± 0.80 % (IH-dHJs). Bottom: Average ratios of IS-dHJs to IH-dHJs. n = 2; error bars indicate range.
Fig. 7.
Fig. 7.. Coordination between DSB Strand Exchange and Homolog Pairing during Meiosis.
(a) Recombination events along unpaired homologs mediate pairing. (b) Early DSBs are preferentially repaired with the sister chromatid. (c) Intersister exchange is compensated for by crossover-specific strand invasion. (d) Crossover-specific IH-SEIs are stabilized during loose pairing, whereas DSB second end capture depends on pairing completion. (e) DNA helicase Mph1 FANCM dissociates DSB first end strand exchange prior to pairing/synapsis. (f) Zip1, acting locally or via the SC (symbolized by rounded rectangle), protects exchanges between homologs and sister chromatids (not shown) from dissociation by Mph1 FANCM. (g) Roles of Mph1 FANCM and Sgs1BLM (see text for details).

Comment in

Similar articles

Cited by

References

    1. Ahuja JS, and Börner GV (2011). Analysis of meiotic recombination intermediates by two-dimensional gel electrophoresis. Methods Mol. Biol. 745, 99–116. - PubMed
    1. Allers T, and Lichten M. (2001). Differential timing and control of noncrossover and crossover recombination during meiosis. Cell 106, 47–57. - PubMed
    1. Bernstein KA, Gangloff S, and Rothstein R. (2010). The RecQ DNA helicases in DNA repair. Annu. Rev. Genet. 44, 393–417. - PMC - PubMed
    1. Bishop DK (1994). RecA homologs Dmc1 and Rad51 interact to form multiple nuclear complexes prior to meiotic chromosome synapsis. Cell 79, 1081–1092. - PubMed
    1. Blary A, Gonzalo A, Eber F, Bérard A, Bergès H, Bessoltane N, Charif D, Charpentier C, Cromer L, Fourment J, et al. (2018). FANCM limits meiotic crossovers in Brassica crops. Front. Plant Sci. 9, 368. - PMC - PubMed

Publication types

MeSH terms

Substances

LinkOut - more resources