Predicting the global mammalian viral sharing network using phylogeography
- PMID: 32385239
- PMCID: PMC7210981
- DOI: 10.1038/s41467-020-16153-4
Predicting the global mammalian viral sharing network using phylogeography
Abstract
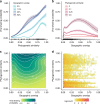
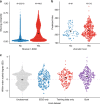
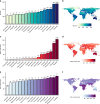
Understanding interspecific viral transmission is key to understanding viral ecology and evolution, disease spillover into humans, and the consequences of global change. Prior studies have uncovered macroecological drivers of viral sharing, but analyses have never attempted to predict viral sharing in a pan-mammalian context. Using a conservative modelling framework, we confirm that host phylogenetic similarity and geographic range overlap are strong, nonlinear predictors of viral sharing among species across the entire mammal class. Using these traits, we predict global viral sharing patterns of 4196 mammal species and show that our simulated network successfully predicts viral sharing and reservoir host status using internal validation and an external dataset. We predict high rates of mammalian viral sharing in the tropics, particularly among rodents and bats, and within- and between-order sharing differed geographically and taxonomically. Our results emphasize the importance of ecological and phylogenetic factors in shaping mammalian viral communities, and provide a robust, general model to predict viral host range and guide pathogen surveillance and conservation efforts.
Conflict of interest statement
The authors declare no competing interests.
Figures


Similar articles
-
Climate change increases cross-species viral transmission risk.Nature. 2022 Jul;607(7919):555-562. doi: 10.1038/s41586-022-04788-w. Epub 2022 Apr 28. Nature. 2022. PMID: 35483403
-
Host and viral traits predict zoonotic spillover from mammals.Nature. 2017 Jun 29;546(7660):646-650. doi: 10.1038/nature22975. Epub 2017 Jun 21. Nature. 2017. PMID: 28636590 Free PMC article.
-
Distinct spread of DNA and RNA viruses among mammals amid prominent role of domestic species.Glob Ecol Biogeogr. 2020 Mar;29(3):470-481. doi: 10.1111/geb.13045. Epub 2019 Dec 19. Glob Ecol Biogeogr. 2020. PMID: 32336945 Free PMC article.
-
Evolution and ecology of influenza A viruses.Curr Top Microbiol Immunol. 2014;385:359-75. doi: 10.1007/82_2014_396. Curr Top Microbiol Immunol. 2014. PMID: 24990620 Review.
-
Viral evolution in deep time: lentiviruses and mammals.Trends Genet. 2012 Feb;28(2):89-100. doi: 10.1016/j.tig.2011.11.003. Epub 2011 Dec 22. Trends Genet. 2012. PMID: 22197521 Review.
Cited by
-
Virus-host interactions predictor (VHIP): Machine learning approach to resolve microbial virus-host interaction networks.PLoS Comput Biol. 2024 Sep 18;20(9):e1011649. doi: 10.1371/journal.pcbi.1011649. eCollection 2024 Sep. PLoS Comput Biol. 2024. PMID: 39292721 Free PMC article.
-
The evolutionary drivers and correlates of viral host jumps.Nat Ecol Evol. 2024 May;8(5):960-971. doi: 10.1038/s41559-024-02353-4. Epub 2024 Mar 25. Nat Ecol Evol. 2024. PMID: 38528191 Free PMC article.
-
The coevolutionary mosaic of bat betacoronavirus emergence risk.Virus Evol. 2023 Dec 20;10(1):vead079. doi: 10.1093/ve/vead079. eCollection 2024. Virus Evol. 2023. PMID: 38361817 Free PMC article.
-
Range area and the fast-slow continuum of life history traits predict pathogen richness in wild mammals.Sci Rep. 2023 Nov 18;13(1):20191. doi: 10.1038/s41598-023-47448-3. Sci Rep. 2023. PMID: 37980452 Free PMC article.
-
Robust evidence for bats as reservoir hosts is lacking in most African virus studies: a review and call to optimize sampling and conserve bats.Biol Lett. 2023 Nov;19(11):20230358. doi: 10.1098/rsbl.2023.0358. Epub 2023 Nov 15. Biol Lett. 2023. PMID: 37964576 Free PMC article. Review.
References
Publication types
MeSH terms
Grants and funding
LinkOut - more resources
Full Text Sources

