

Design of Fluorescent Probes for Bioorthogonal Labeling of Carbonylation in Live Cells
- PMID: 32376913
- PMCID: PMC7203098
- DOI: 10.1038/s41598-020-64790-y
Design of Fluorescent Probes for Bioorthogonal Labeling of Carbonylation in Live Cells
Abstract
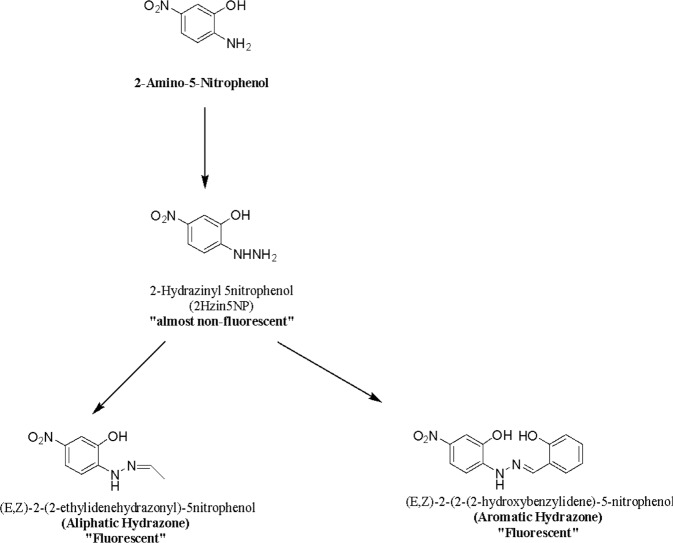
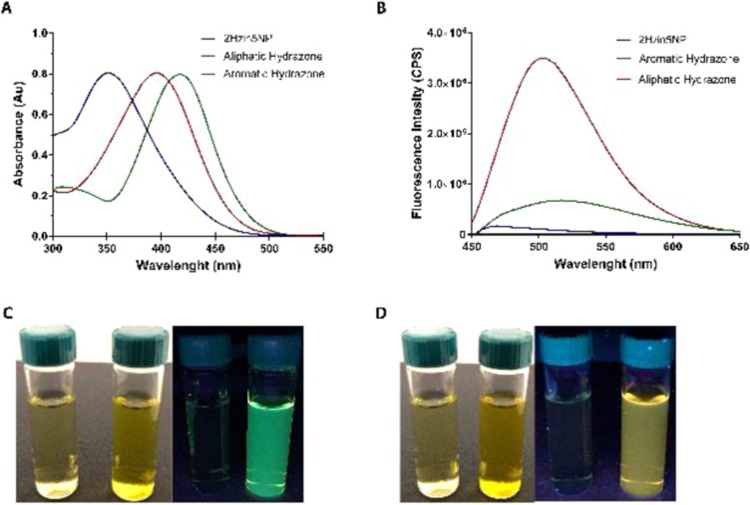
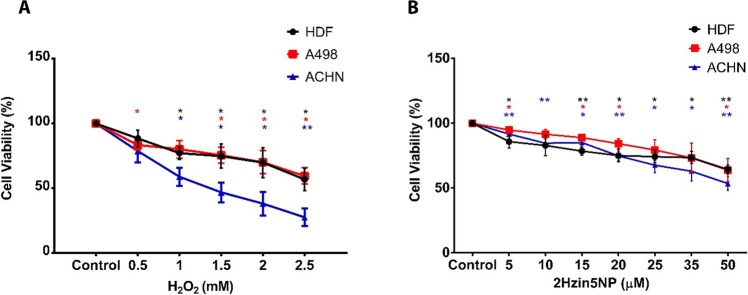
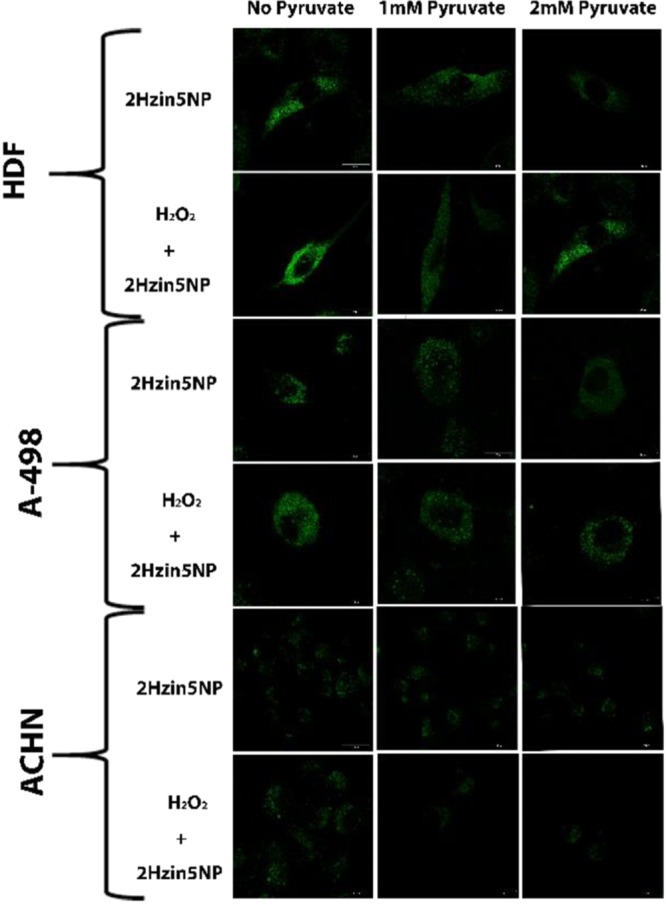
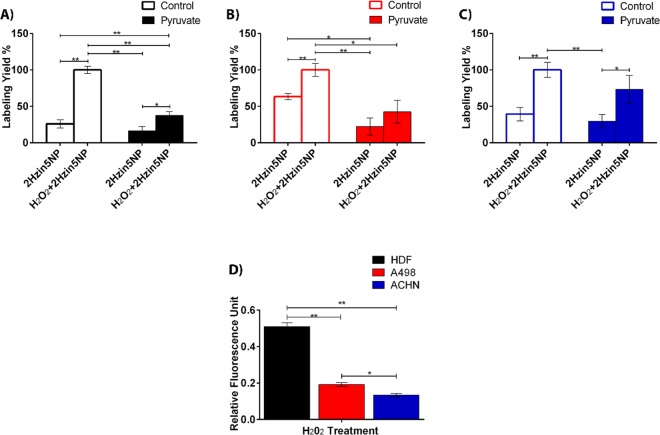
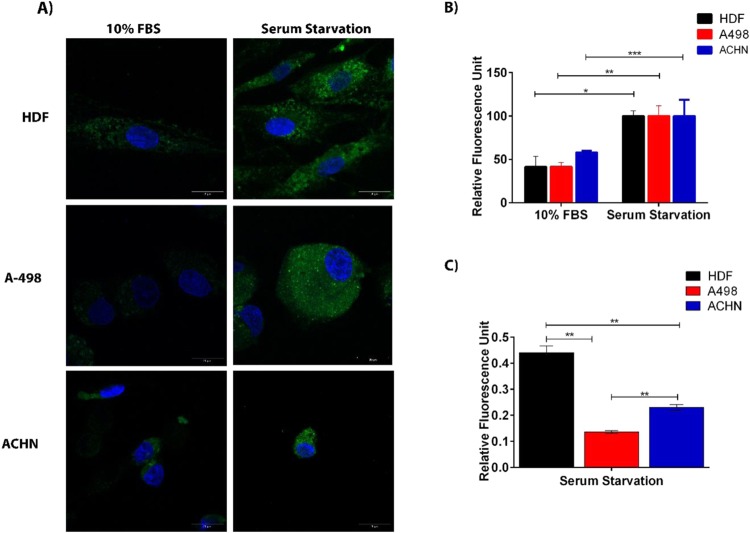
With the rapid development of chemical biology, many diagnostic fluorophore-based tools were introduced to specific biomolecules by covalent binding. Bioorthogonal reactions have been widely utilized to manage challenges faced in clinical practice for early diagnosis and treatment of several tumor samples. Herein, we designed a small molecule fluorescent-based biosensor, 2Hydrazine-5nitrophenol (2Hzin5NP), which reacts with the carbonyl moiety of biomolecules through bioorthogonal reaction, therefore can be utilized for the detection of biomolecule carbonylation in various cancer cell lines. Our almost non-fluorescent chemical probe has a fast covalent binding with carbonyl moieties at neutral pH to form a stable fluorescent hydrazone product leading to a spectroscopic alteration in live cells. Microscopic and fluorometric analyses were used to distinguish the exogenous and endogenous ROS induced carbonylation profile in human dermal fibroblasts along with A498 primary site and ACHN metastatic site renal cell carcinoma (RRC) cell lines. Our results showed that carbonylation level that differs in response to exogenous and endogenous stress in healthy and cancer cells can be detected by the newly synthesized bioorthogonal fluorescent probe. Our results provide new insights into the development of novel bioorthogonal probes that can be utilized in site-specific carbonylation labeling to enhance new diagnostic approaches in cancer.
Conflict of interest statement
The authors declare no competing interests.
Figures
Similar articles
-
Detection of oxidative stress-induced carbonylation in live mammalian cells.Free Radic Biol Med. 2015 Jul;84:11-21. doi: 10.1016/j.freeradbiomed.2015.03.011. Epub 2015 Mar 20. Free Radic Biol Med. 2015. PMID: 25801292 Free PMC article.
-
Design strategies for bioorthogonal smart probes.Org Biomol Chem. 2014 Dec 14;12(46):9307-20. doi: 10.1039/c4ob01632g. Epub 2014 Oct 15. Org Biomol Chem. 2014. PMID: 25315039 Free PMC article. Review.
-
Affinity Conjugation for Rapid and Covalent Labeling of Proteins in Live Cells.Methods Mol Biol. 2019;2008:191-202. doi: 10.1007/978-1-4939-9537-0_15. Methods Mol Biol. 2019. PMID: 31124098
-
Visualization of oxidative stress-induced carbonylation in live mammalian cells.Methods Enzymol. 2020;641:165-181. doi: 10.1016/bs.mie.2020.04.040. Epub 2020 Jun 15. Methods Enzymol. 2020. PMID: 32713522
-
Chemical biology-based approaches on fluorescent labeling of proteins in live cells.Mol Biosyst. 2013 May;9(5):862-72. doi: 10.1039/c2mb25422k. Mol Biosyst. 2013. PMID: 23318293 Review.
Cited by
-
A Novel Fluorogenic Assay for the Detection of Nephrotoxin-Induced Oxidative Stress in Live Cells and Renal Tissue.ACS Sens. 2021 Jul 23;6(7):2523-2528. doi: 10.1021/acssensors.1c00422. Epub 2021 Jul 2. ACS Sens. 2021. PMID: 34214393 Free PMC article.
-
Current Probes for Imaging Carbonylation in Cellular Systems and Their Relevance to Progression of Diseases.Technol Cancer Res Treat. 2022 Jan-Dec;21:15330338221137303. doi: 10.1177/15330338221137303. Technol Cancer Res Treat. 2022. PMID: 36345252 Free PMC article. Review.
-
Research Progress and Application of Bioorthogonal Reactions in Biomolecular Analysis and Disease Diagnosis.Top Curr Chem (Cham). 2021 Sep 29;379(6):39. doi: 10.1007/s41061-021-00352-8. Top Curr Chem (Cham). 2021. PMID: 34590223 Review.
References
-
- Gill, J. G., Piskounova, E. & Morrison, S. J. Cancer, Oxidative Stress, and Metastasis. Cold Spring Harbor Symposia on Quantitative Biology, 10.1101/sqb.2016.81.030791 (2017). - PubMed
Publication types
MeSH terms
Substances
LinkOut - more resources
Full Text Sources
