

Transgenic Overexpression of the Disordered Prion Protein N1 Fragment in Mice Does Not Protect Against Neurodegenerative Diseases Due to Impaired ER Translocation
- PMID: 32367491
- PMCID: PMC7253391
- DOI: 10.1007/s12035-020-01917-2
Transgenic Overexpression of the Disordered Prion Protein N1 Fragment in Mice Does Not Protect Against Neurodegenerative Diseases Due to Impaired ER Translocation
Abstract
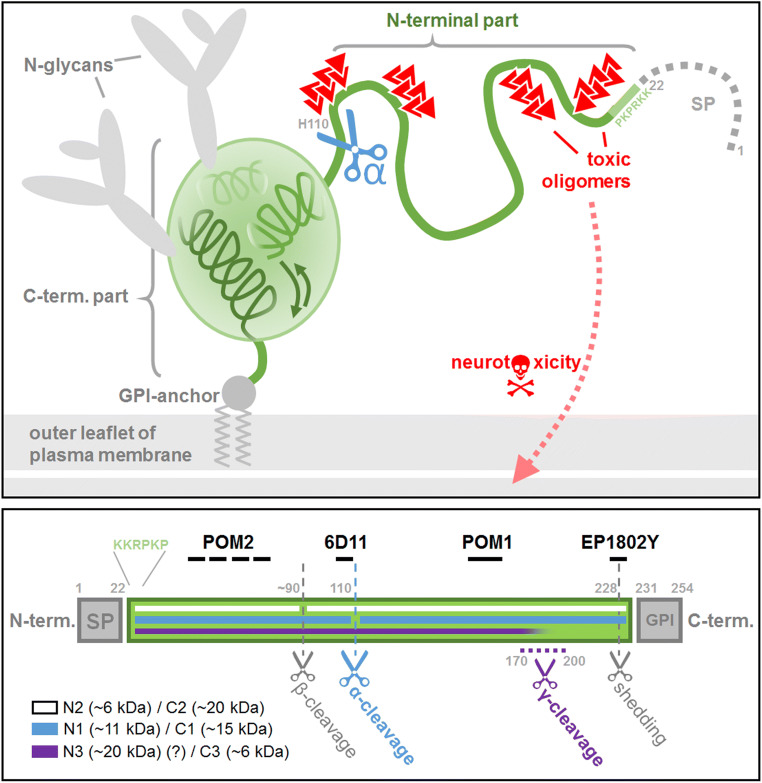
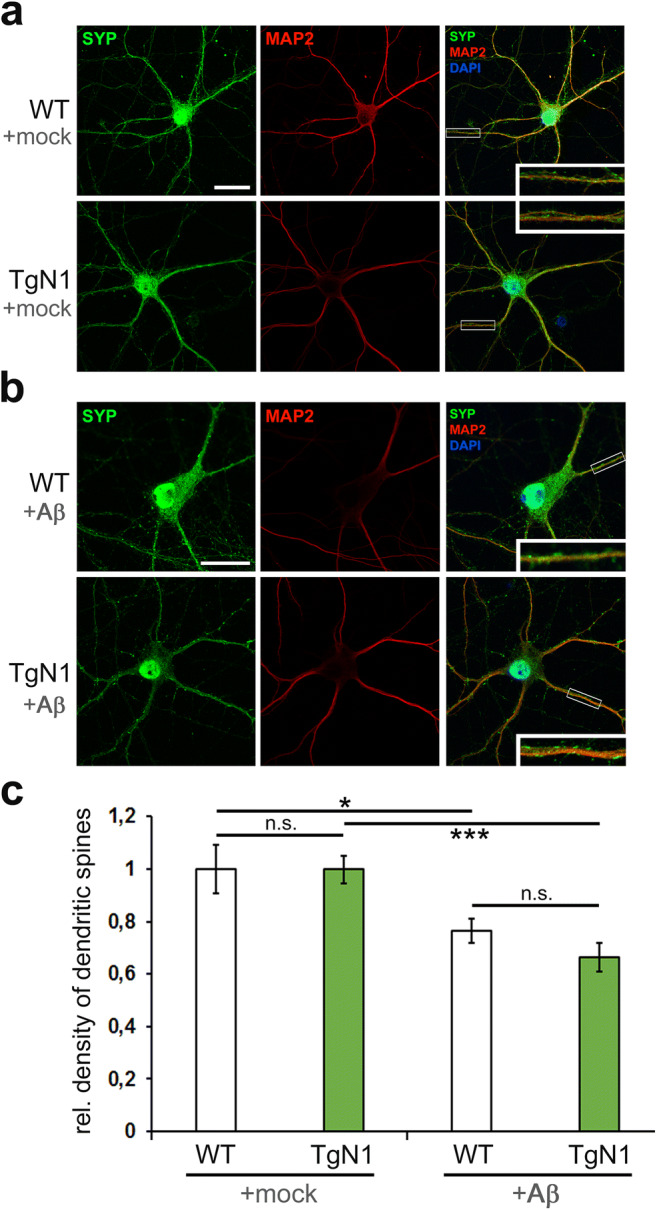
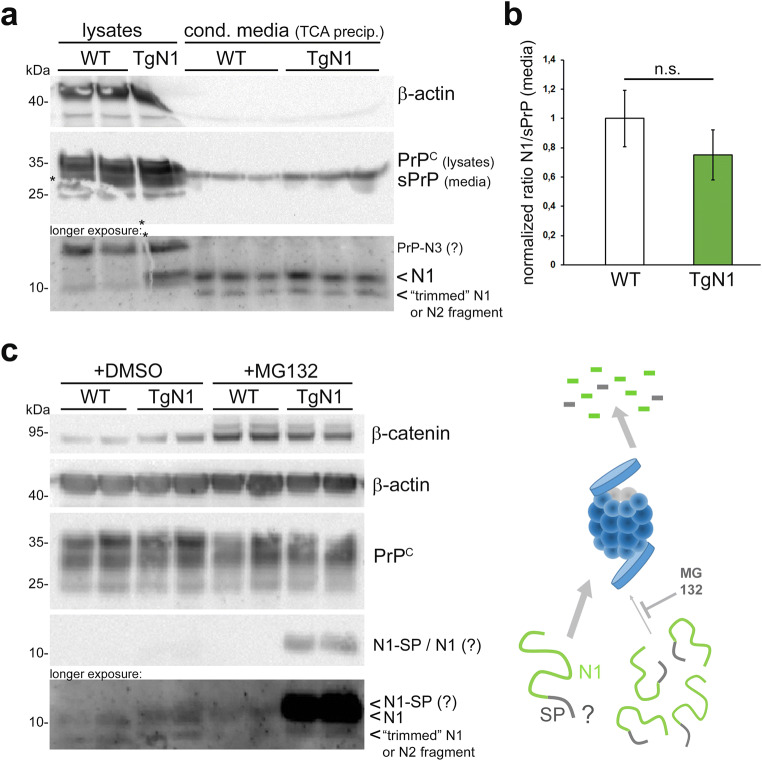
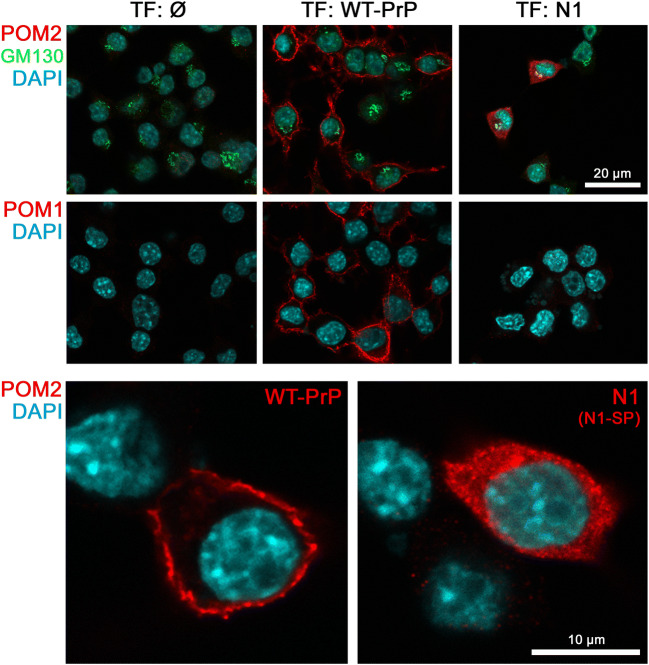
The structurally disordered N-terminal half of the prion protein (PrPC) is constitutively released into the extracellular space by an endogenous proteolytic cleavage event. Once liberated, this N1 fragment acts neuroprotective in ischemic conditions and interferes with toxic peptides associated with neurodegenerative diseases, such as amyloid-beta (Aβ) in Alzheimer's disease. Since analog protective effects of N1 in prion diseases, such as Creutzfeldt-Jakob disease, have not been studied, and given that the protease releasing N1 has not been identified to date, we have generated and characterized transgenic mice overexpressing N1 (TgN1). Upon intracerebral inoculation of TgN1 mice with prions, no protective effects were observed at the levels of survival, clinical course, neuropathological, or molecular assessment. Likewise, primary neurons of these mice did not show protection against Aβ toxicity. Our biochemical and morphological analyses revealed that this lack of protective effects is seemingly due to an impaired ER translocation of the disordered N1 resulting in its cytosolic retention with an uncleaved signal peptide. Thus, TgN1 mice represent the first animal model to prove the inefficient ER translocation of intrinsically disordered domains (IDD). In contrast to earlier studies, our data challenge roles of cytoplasmic N1 as a cell penetrating peptide or as a potent "anti-prion" agent. Lastly, our study highlights both the importance of structured domains in the nascent chain for proteins to be translocated and aspects to be considered when devising novel N1-based therapeutic approaches against neurodegenerative diseases.
Keywords: Cell-penetrating peptide; Cytosolic prions; Intrinsically disordered domains; Prion disease; Proteasome; Translocation.
Figures
Similar articles
-
The N-terminal domain of the prion protein is required and sufficient for liquid-liquid phase separation: A crucial role of the Aβ-binding domain.J Biol Chem. 2021 Jul;297(1):100860. doi: 10.1016/j.jbc.2021.100860. Epub 2021 Jun 6. J Biol Chem. 2021. PMID: 34102212 Free PMC article.
-
Decoding the function of the N-terminal tail of the cellular prion protein to inspire novel therapeutic avenues for neurodegenerative diseases.Virus Res. 2015 Sep 2;207:62-8. doi: 10.1016/j.virusres.2014.10.015. Epub 2014 Oct 23. Virus Res. 2015. PMID: 25456402 Review.
-
Neuroprotective effect and potential of cellular prion protein and its cleavage products for treatment of neurodegenerative disorders part I. a literature review.Expert Rev Neurother. 2021 Sep;21(9):969-982. doi: 10.1080/14737175.2021.1965881. Epub 2021 Sep 2. Expert Rev Neurother. 2021. PMID: 34470561 Free PMC article. Review.
-
Insights into Mechanisms of Transmission and Pathogenesis from Transgenic Mouse Models of Prion Diseases.Methods Mol Biol. 2017;1658:219-252. doi: 10.1007/978-1-4939-7244-9_16. Methods Mol Biol. 2017. PMID: 28861793 Free PMC article. Review.
-
Mutated but Not Deleted Ovine PrP(C) N-Terminal Polybasic Region Strongly Interferes with Prion Propagation in Transgenic Mice.J Virol. 2015 Nov 25;90(3):1638-46. doi: 10.1128/JVI.02805-15. Print 2016 Feb 1. J Virol. 2015. PMID: 26608316 Free PMC article.
Cited by
-
Biological Functions of the Intrinsically Disordered N-Terminal Domain of the Prion Protein: A Possible Role of Liquid-Liquid Phase Separation.Biomolecules. 2021 Aug 12;11(8):1201. doi: 10.3390/biom11081201. Biomolecules. 2021. PMID: 34439867 Free PMC article. Review.
-
Comparing Prion Proteins Across Species: Is Zebrafish a Useful Model?Mol Neurobiol. 2025 Jan;62(1):832-845. doi: 10.1007/s12035-024-04324-z. Epub 2024 Jun 25. Mol Neurobiol. 2025. PMID: 38918277 Free PMC article. Review.
-
Ligands binding to the prion protein induce its proteolytic release with therapeutic potential in neurodegenerative proteinopathies.Sci Adv. 2021 Nov 26;7(48):eabj1826. doi: 10.1126/sciadv.abj1826. Epub 2021 Nov 24. Sci Adv. 2021. PMID: 34818048 Free PMC article.
-
Anchorless risk or released benefit? An updated view on the ADAM10-mediated shedding of the prion protein.Cell Tissue Res. 2023 Apr;392(1):215-234. doi: 10.1007/s00441-022-03582-4. Epub 2022 Jan 27. Cell Tissue Res. 2023. PMID: 35084572 Free PMC article. Review.
-
Structural details of amyloid β oligomers in complex with human prion protein as revealed by solid-state MAS NMR spectroscopy.J Biol Chem. 2021 Jan-Jun;296:100499. doi: 10.1016/j.jbc.2021.100499. Epub 2021 Mar 3. J Biol Chem. 2021. PMID: 33667547 Free PMC article.
References
-
- Riek R, Hornemann S, Wider G, Glockshuber R, Wüthrich K. NMR characterization of the full-length recombinant murine prion protein, mPrP(23-231) FEBS Lett. 1997;413(2):282–288. - PubMed
-
- Sonati T, Reimann RR, Falsig J, Baral PK, O’Connor T, Hornemann S, Yaganoglu S, Li B, Herrmann US, Wieland B, Swayampakula M, Rahman MH, Das D, Kav N, Riek R, Liberski PP, James MNG, Aguzzi A. The toxicity of antiprion antibodies is mediated by the flexible tail of the prion protein. Nature. 2013;501:102–106. - PubMed
-
- Riek R, Hornemann S, Wider G, Billeter M, Glockshuber R, Wüthrich K. Nmr structure of the mouse prion protein domain Prp(121-231) Nature. 1996;382(6587):180–182. - PubMed
MeSH terms
Substances
Grants and funding
LinkOut - more resources
Full Text Sources
Medical
Research Materials
