

Reduction of the P5A-ATPase Spf1p phosphoenzyme by a Ca2+-dependent phosphatase
- PMID: 32353073
- PMCID: PMC7192388
- DOI: 10.1371/journal.pone.0232476
Reduction of the P5A-ATPase Spf1p phosphoenzyme by a Ca2+-dependent phosphatase
Abstract
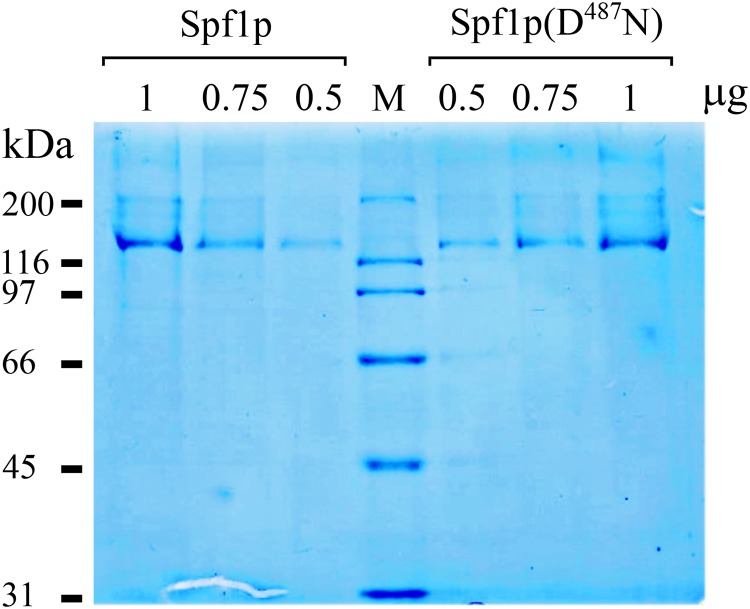
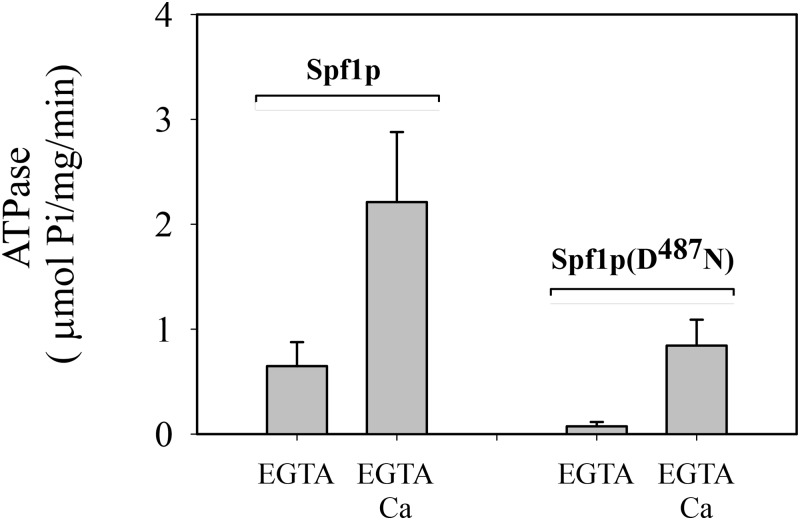
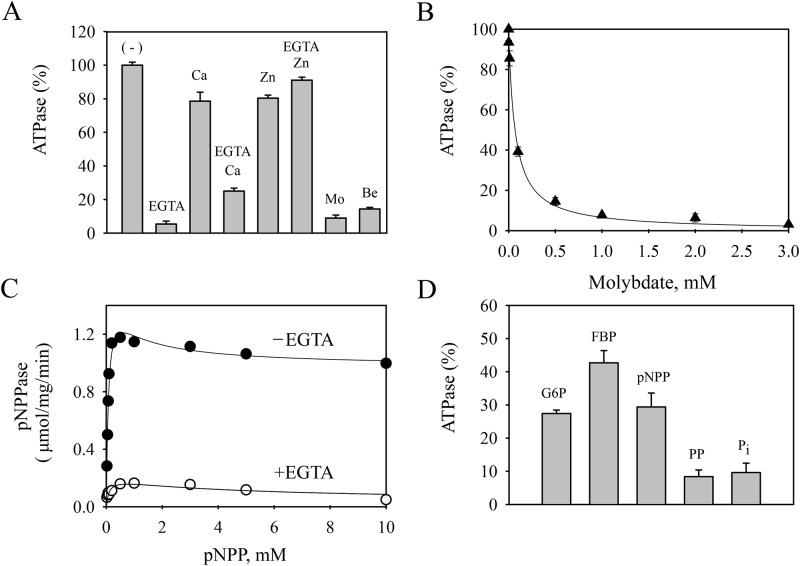
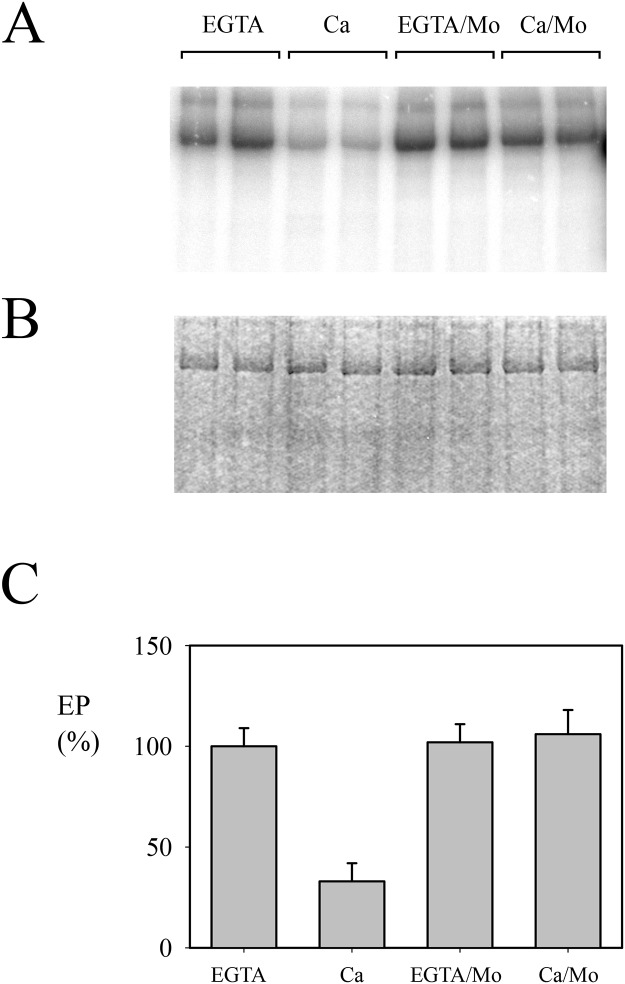
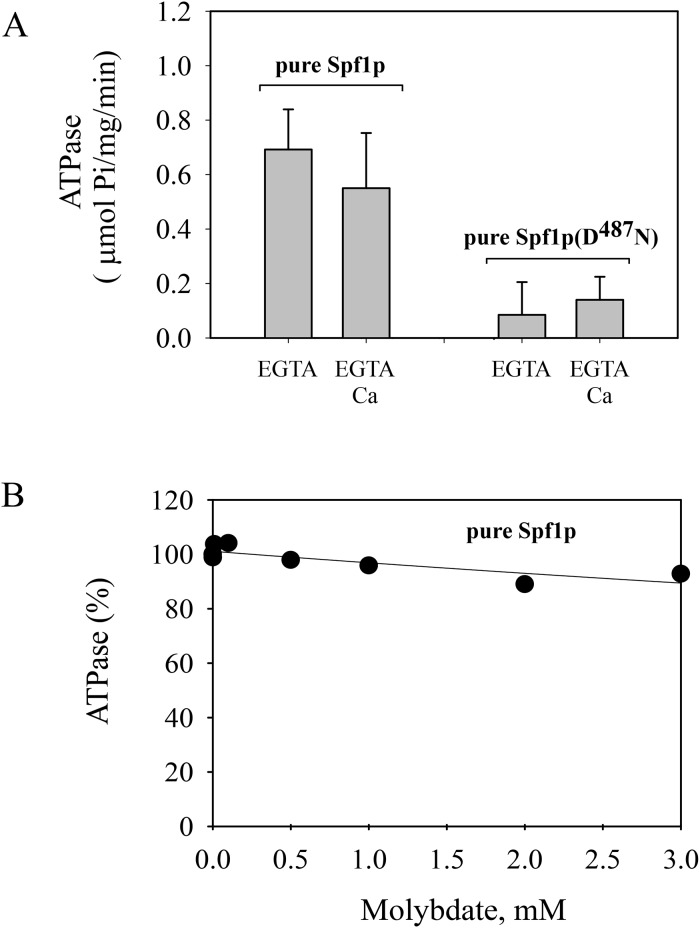
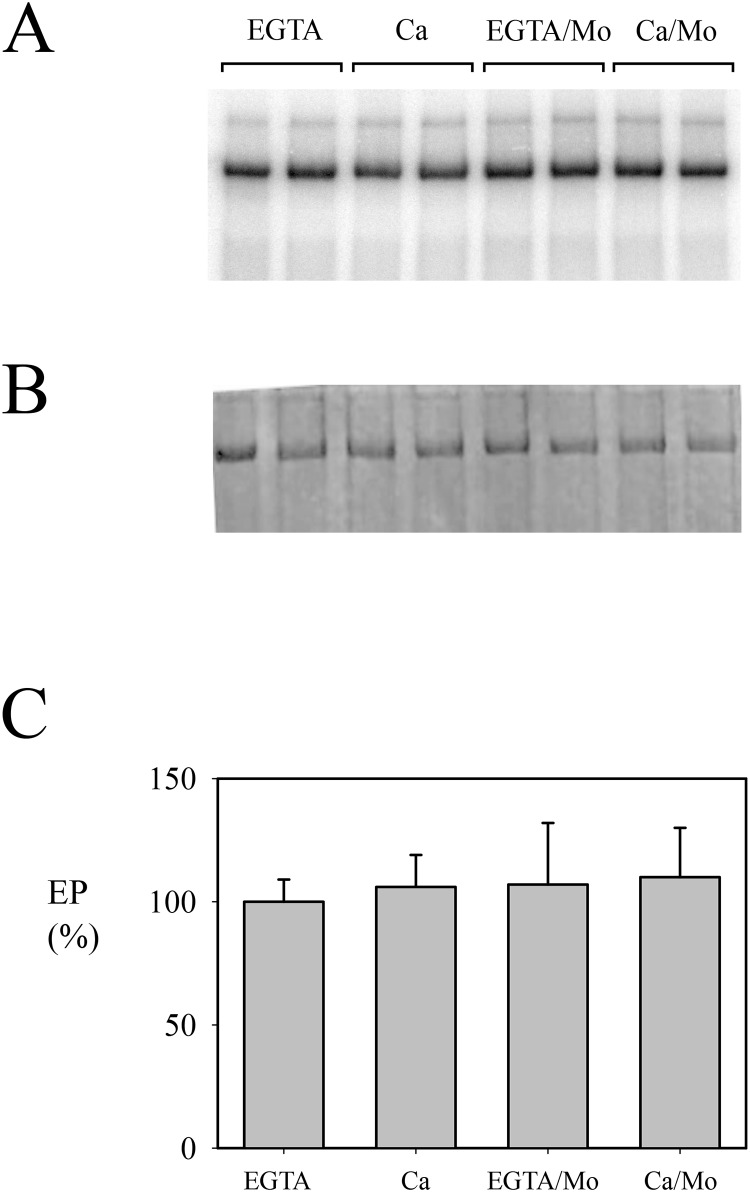
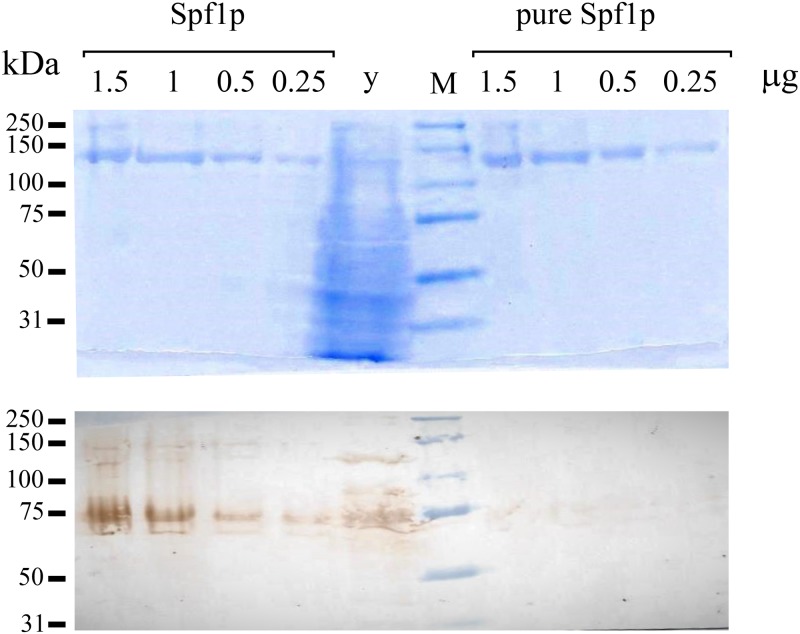
P5 ATPases are eukaryotic pumps important for cellular metal ion, lipid and protein homeostasis; however, their transported substrate, if any, remains to be identified. Ca2+ was proposed to act as a ligand of P5 ATPases because it decreases the level of phosphoenzyme of the Spf1p P5A ATPase from Saccharomyces cerevisiae. Repeating previous purification protocols, we obtained a purified preparation of Spf1p that was close to homogeneity and exhibited ATP hydrolytic activity that was stimulated by the addition of CaCl2. Strikingly, a preparation of a catalytically dead mutant Spf1p (D487N) also exhibited Ca2+-dependent ATP hydrolytic activity. These results indicated that the Spf1p preparation contained a co-purifying protein capable of hydrolyzing ATP at a high rate. The activity was likely due to a phosphatase, since the protein i) was highly active when pNPP was used as substrate, ii) required Ca2+ or Zn2+ for activity, and iii) was strongly inhibited by molybdate, beryllium and other phosphatase substrates. Mass spectrometry identified the phosphatase Pho8p as a contaminant of the Spf1p preparation. Modification of the purification procedure led to a contaminant-free Spf1p preparation that was neither stimulated by Ca2+ nor inhibited by EGTA or molybdate. The phosphoenzyme levels of a contaminant-free Spf1p preparation were not affected by Ca2+. These results indicate that the reported effects of Ca2+ on Spf1p do not reflect the intrinsic properties of Spf1p but are mediated by the activity of the accompanying phosphatase.
Conflict of interest statement
The authors have declared that no competing interests exist.
Figures
Similar articles
-
Highly exposed segment of the Spf1p P5A-ATPase near transmembrane M5 detected by limited proteolysis.PLoS One. 2021 Jan 28;16(1):e0245679. doi: 10.1371/journal.pone.0245679. eCollection 2021. PLoS One. 2021. PMID: 33507968 Free PMC article.
-
The Spf1p P5A-ATPase "arm-like" domain is not essential for ATP hydrolysis but its deletion impairs autophosphorylation.Biochem Biophys Res Commun. 2021 Jul 23;563:113-118. doi: 10.1016/j.bbrc.2021.05.054. Epub 2021 Jun 1. Biochem Biophys Res Commun. 2021. PMID: 34087682
-
The effect of metal ions on the Spf1p P5A-ATPase. High sensitivity to irreversible inhibition by zinc.Arch Biochem Biophys. 2022 Dec 15;732:109450. doi: 10.1016/j.abb.2022.109450. Epub 2022 Oct 31. Arch Biochem Biophys. 2022. PMID: 36328152
-
Inhibition of the Formation of the Spf1p Phosphoenzyme by Ca2.J Biol Chem. 2016 Apr 1;291(14):7767-73. doi: 10.1074/jbc.M115.695122. Epub 2016 Feb 8. J Biol Chem. 2016. PMID: 26858246 Free PMC article.
-
Towards defining the substrate of orphan P5A-ATPases.Biochim Biophys Acta. 2015 Mar;1850(3):524-35. doi: 10.1016/j.bbagen.2014.05.008. Epub 2014 May 14. Biochim Biophys Acta. 2015. PMID: 24836520 Review.
Cited by
-
ATP hydrolytic activity of purified Spf1p correlate with micellar lipid fluidity and is dependent on conserved residues in transmembrane helix M1.PLoS One. 2022 Oct 20;17(10):e0274908. doi: 10.1371/journal.pone.0274908. eCollection 2022. PLoS One. 2022. PMID: 36264897 Free PMC article.
-
Dynamic membranes: the multiple roles of P4 and P5 ATPases.Plant Physiol. 2021 Apr 2;185(3):619-631. doi: 10.1093/plphys/kiaa065. Plant Physiol. 2021. PMID: 33822217 Free PMC article.
-
Lipid flippases as key players in plant adaptation to their environment.Nat Plants. 2021 Sep;7(9):1188-1199. doi: 10.1038/s41477-021-00993-z. Epub 2021 Sep 16. Nat Plants. 2021. PMID: 34531559 Review.
-
Highly exposed segment of the Spf1p P5A-ATPase near transmembrane M5 detected by limited proteolysis.PLoS One. 2021 Jan 28;16(1):e0245679. doi: 10.1371/journal.pone.0245679. eCollection 2021. PLoS One. 2021. PMID: 33507968 Free PMC article.
References
-
- Sørensen D.M., Holen H.W., Holemans T., Vangheluwe P., Palmgren M.G. (2015) Towards defining the substrate of orphan P5A-ATPases Biochim. Biophys. Acta. 1850,524–535 - PubMed
-
- de Tezanos Pinto F, Adamo H.P. (2018) The strategic function of the P5-ATPase ATP13A2 in toxic waste disposal. Neurochem Int. 12,108–113 - PubMed
Publication types
MeSH terms
Substances
Grants and funding
LinkOut - more resources
Full Text Sources
Molecular Biology Databases
Miscellaneous
