Review
. 2020 Apr 15:11:534.
doi: 10.3389/fmicb.2020.00534. eCollection 2020.

Too Much of a Good Thing: How Ectopic DNA Replication Affects Bacterial Replication Dynamics

Affiliations
Review

Too Much of a Good Thing: How Ectopic DNA Replication Affects Bacterial Replication Dynamics

Aisha H Syeda et al. Front Microbiol. .

Abstract

Each cell division requires the complete and accurate duplication of the entire genome. In bacteria, the duplication process of the often-circular chromosomes is initiated at a single origin per chromosome, resulting in two replication forks that traverse the chromosome in opposite directions. DNA synthesis is completed once the two forks fuse in a region diametrically opposite the origin. In some bacteria, such as Escherichia coli, the region where forks fuse forms a specialized termination area. Polar replication fork pause sites flanking this area can pause the progression of replication forks, thereby allowing forks to enter but not to leave. Transcription of all required genes has to take place simultaneously with genome duplication. As both of these genome trafficking processes share the same template, conflicts are unavoidable. In this review, we focus on recent attempts to add additional origins into various ectopic chromosomal locations of the E. coli chromosome. As ectopic origins disturb the native replichore arrangements, the problems resulting from such perturbations can give important insights into how genome trafficking processes are coordinated and the problems that arise if this coordination is disturbed. The data from these studies highlight that head-on replication-transcription conflicts are indeed highly problematic and multiple repair pathways are required to restart replication forks arrested at obstacles. In addition, the existing data also demonstrate that the replication fork trap in E. coli imposes significant constraints to genome duplication if ectopic origins are active. We describe the current models of how replication fork fusion events can cause serious problems for genome duplication, as well as models of how such problems might be alleviated both by a number of repair pathways as well as the replication fork trap system. Considering the problems associated both with head-on replication-transcription conflicts as well as head-on replication fork fusion events might provide clues of how these genome trafficking issues have contributed to shape the distinct architecture of bacterial chromosomes.

Keywords: 3′ exonuclease; bacterial replication dynamics; ectopic replication origins; recG gene; replication; termination of DNA replication; transcription.


Figures

FIGURE 1
FIGURE 1
Chromosome structure and replication dynamics in Escherichia coli. (A) Schematic representation of the E. coli chromosome. Two replication forks are initiated at the origin (oriC) move in opposite directions along the DNA and eventually approach one other and fuse within the terminus region diametrically opposed to oriC. A replication fork trap is formed in the terminus region via terminator sequences (terA–J) which are arranged as two opposed groups, with the red terminators oriented to block movement of the clockwise replication fork and the blue terminators oriented to block the anticlockwise fork. The large gray arrow highlights the total spanned area covered by ter sites, while the core termination area, defined by the four innermost ter sites, is marked by a small gray arrow. The chromosomal locations for oriC and the dif chromosome dimer resolution site are marked. The location of rrn operons, which are highly transcribed particularly under fast growth conditions, are shown by green arrows, with the arrow pointing in the direction in which transcribing RNA polymerase molecules travel. “GRP” indicates the location of a cluster of genes encoding ribosomal proteins, almost all of which are transcribed co-directionally with replication. Chromosomal macrodomains Ori, NSright, NSleft, Right, Left, and Ter are shown as described in Duigou and Boccard (2017) and domain boundaries given in Mbp. Numbers on the inside are the minutes of the standard genetic map (0–100 min). (B) Marker frequency analysis of wild type E. coli cells. The number of reads (normalized against reads for a stationary phase wild type control) is plotted against the chromosomal location. A schematic representation of the E. coli chromosome showing positions of oriC (green line) and ter sites (above) as well as dif and rrn operons A–E, G, and H (below) is shown above the plotted data. The MFA raw data were taken from Rudolph et al. (2013) and re-plotted to allow changes the scale of the plots, if necessary, and to highlight specific schematic features of the E. coli chromosome. A magnified view of the replication profile in the termination area is shown in the enlarged circle.
FIGURE 2
FIGURE 2
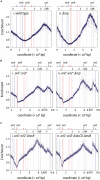
Chromosome structure and replication dynamics in E. coli cells with additional ectopic replication origins. (A) Integration sites of 5 kb oriC fragments into pheA upstream of the rrnG operon, termed oriX, and near the lacZYA operon, termed oriZ (Wang et al., 2011; Ivanova et al., 2015; Dimude et al., 2018b). All genetic and structural elements shown are as described in Figure 1. (B) Marker frequency analysis of E. coli oriC+ oriX+ and oriC+ oriZ+ cells. The number of reads (normalized against reads for a stationary phase wild type control) is plotted against the chromosomal location. A schematic representation of the E. coli chromosome showing positions of oriC, oriX and oriZ (green lines) and ter sites (above) as well as dif and rrn operons A–E, G, and H (below) is shown above the plotted data. The MFA raw data were taken from Dimude et al. (2018b) and re-plotted to allow changes the scale of the plots, if necessary, and to highlight specific schematic features of the E. coli chromosome. (C) Integration site of a 5 kb oriC fragment, termed oriY, into malT, upstream of the rrnD operon. See text for details. (D) Marker frequency analysis in E. coli oriC+ oriX+ oriZ+ cells. The number of reads (normalized against reads for a stationary phase wild type control) is plotted against the chromosomal location. A schematic representation of the E. coli chromosome showing positions of oriC, oriX, and oriZ (green lines) and ter sites (all above) as well as dif and rrn operons A–E, G, and H (all below) is shown above the plotted data. The MFA raw data were taken from Dimude et al. (2018b) and re-plotted to allow changes the scale of the plots, if necessary, and to highlight specific schematic features of the E. coli chromosome.
FIGURE 3
FIGURE 3
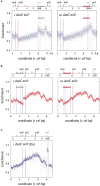
Chromosomal rearrangements in E. coli cells replicating from a single ectopic replication origin. (A) Replication profiles of E. coli cells with a single ectopic replication origin. Shown is the marker frequency analysis of E. coliΔoriC oriZ+ cells. The number of reads (normalized against reads for a stationary phase wild type control) is plotted against the chromosomal location. A schematic representation of the E. coli chromosome showing positions of oriC (gray to indicate the deletion) and oriZ (green line) and ter sites (above) as well as dif and rrn operons A–E, G, and H (below) is shown above the plotted data. A clear discontinuity of the profile can be seen in (panel i) (marked by a gray bar), which is due to a large inversion, as highlighted by the continuous replication profile that results if the area highlighted (red bar indicates the inverted area) is inverted. The MFA raw data were taken from Ivanova et al. (2015) and re-plotted to allow changes the scale of the plots, if necessary, and to highlight specific schematic features of the E. coli chromosome. (B) Replication profiles of E. coliΔoriC oriX+ cells. A clear discontinuity of the profile can be seen in panel i (marked by a gray bar), which is due to a large inversion, as highlighted by the continuous replication profile that results if the area highlighted (red bar indicates the inverted area) is inverted. The MFA raw data were taken from Dimude et al. (2018b) and re-plotted to allow changes the scale of the plots, if necessary, and to highlight specific schematic features of the E. coli chromosome. (C) Replication profiles of E. coliΔoriC oriX+ Δtus cells. A clear discontinuity of the replication profile can be seen between the rrn operons A and B, which is due to a duplication of the entire region. See text for details.
FIGURE 4
FIGURE 4
Replication dynamics and cell viability in cells with one or two active replication origins lacking either Rep helicase or RecBCD exonuclease. (A) Cells lacking Rep helicase show an increased origin/terminus ratio than wild type cells, indicating that replication fork progression is significantly slowed. The replication profiles are generated by plotting the number of sequence reads (normalized against reads for a stationary phase wild type control) against their chromosomal location. The schematic representation of the E. coli chromosome above each panel shows the positions of the two origins, oriC and oriZ, and ter sites (above) as well as the dif chromosome dimer resolution site and rrn operons A–E, G, and H (below). (B) Replication fork progression is blocked at the highly transcribed rrnH operon replicated in a direction opposite to normal in oriC+ oriZ+ cells lacking Rep helicase. Please note that the chromosomal coordinates are shifted in comparison to panel (A) so that oriC and oriZ next to each other. (C) Replication fork progression is arrested at rrnH if replication proceeds in an orientation opposite to normal, and oriZ peak height is much reduced in cells lacking RecBCD exonuclease (panel i). oriZ peak height is restored if SbcCD is missing in addition to RecBCD (panel ii). See text for details. For an in-depth discussion of the underrepresentation of sequence reads in the termination area please refer to Wendel et al. (2014), Sinha et al. (2017, , and Dimude et al. (2018a). All raw data in panels (A–C) are taken from Dimude et al. (2018a) and re-plotted to allow changes the scale of the plots, if necessary, and to highlight specific schematic features of the E. coli chromosome. As for panel (B), please note that the chromosomal coordinates for panel (C) are shifted in comparison to panel (A) so that oriC and oriZ are next to each other.
FIGURE 5
FIGURE 5
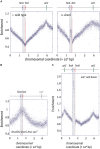
Over-replication in the termination area in the absence of RecG helicase. (A) Replication profiles of E. coli cells in exponential phase. Cells were grown at 37°C. The number of reads (normalized against the reads for a stationary wild type control) is plotted against the chromosomal coordinate. Positions of oriC (green line) and primary ter sites are shown above the plotted data with red and blue lines representing the left and right replichore, as depicted in Figure 1A. The termination area between the innermost ter sites is highlighted in light gray. (B) Marker frequency analysis of a ΔrecG Δtus rpo* strain that carries a temperature-sensitive allele of the main replication initiator protein DnaA. The strain was grown at 42°C to inactivate DnaA(ts) and therefore prevent oriC firing. (C) Marker frequency analysis of chromosome replication in oriC+ oriZ+ strain in the absence of RecG. Strains were grown at 37°C. The raw data in panels (A–C) were taken from Rudolph et al. (2013) and re-plotted to allow changes the scale of the plots, if necessary, and to highlight specific schematic features of the E. coli chromosome.
FIGURE 6
FIGURE 6
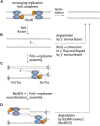
Illustration of how replication fork fusions might trigger over-replication in the termination area and how this is normally prevented by proteins such as RecG and/or 3′ exonucleases. The fusion of two replisomes (A) can result in the formation of key intermediates, such as a 3′ single-stranded DNA flap (B), which can be processed by restart proteins such as PriA (C,D) if it is not removed or degraded. ter/Tus complexes are shown in panels (C,D) as triangles. The blue ter/Tus complexes are oriented such that they would block synthesis initiated within the termination area and moving counterclockwise, while the red ter/Tus complexes would block clockwise synthesis. As these complexes are permissive for the forks coming from oriC in panel (A) they have been excluded for simplicity. Note that, while the formation of a 3′ flap can occur at both forks, only one such reaction was shown for simplicity. See text for details.

Similar articles

Cited by

References

    1. Alexander J. L., Orr-Weaver T. L. (2016). Replication fork instability and the consequences of fork collisions from rereplication. Genes Dev. 30 2241–2252. 10.1101/gad.288142.116 - DOI - PMC - PubMed
    1. Atkinson J., Gupta M. K., Rudolph C. J., Bell H., Lloyd R. G., McGlynn P. (2011). Localization of an accessory helicase at the replisome is critical in sustaining efficient genome duplication. Nucleic Acids Res. 39 949–957. 10.1093/nar/gkq889 - DOI - PMC - PubMed
    1. Baharoglu Z., Lestini R., Duigou S., Michel B. (2010). RNA polymerase mutations that facilitate replication progression in the rep uvrD recF mutant lacking two accessory replicative helicases. Mol. Microbiol. 77 324–336. 10.1111/j.1365-2958.2010.07208.x - DOI - PMC - PubMed
    1. Bai L., Yuan Z., Sun J., Georgescu R., O’Donnell M. E., Li H. (2017). Architecture of the Saccharomyces cerevisiae Replisome. Adv. Exp. Med. Biol. 1042 207–228. 10.1007/978-981-10-6955-0_10 - DOI - PMC - PubMed
    1. Balakrishnan L., Bambara R. A. (2013). Flap endonuclease 1. Annu. Rev. Biochem. 82 119–138. 10.1146/annurev-biochem-072511-122603 - DOI - PMC - PubMed

LinkOut - more resources