Delayed Expression of PD-1 and TIGIT on HIV-Specific CD8 T Cells in Untreated HLA-B*57:01 Individuals Followed from Early Infection
- PMID: 32350076
- PMCID: PMC7343205
- DOI: 10.1128/JVI.02128-19
Delayed Expression of PD-1 and TIGIT on HIV-Specific CD8 T Cells in Untreated HLA-B*57:01 Individuals Followed from Early Infection
Abstract
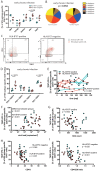
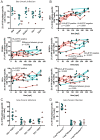
While the relationship of protective human leukocyte antigen (HLA) class I alleles and HIV progression is well defined, the interaction of HLA-mediated protection and CD8 T-cell exhaustion is less well characterized. To gain insight into the influence of HLA-B*57:01 on the deterioration of CD8 T-cell responses during HIV infection in the absence of antiretroviral treatment, we compared HLA-B*57:01-restricted HIV-specific CD8 T-cell responses to responses restricted by other HLA class I alleles longitudinally after control of peak viremia. Detailed characterization of polyfunctionality, differentiation phenotypes, transcription factor, and inhibitory receptor expression revealed progression of CD8 T-cell exhaustion over the course of the infection in both patient groups. However, early effects on the phenotype of the total CD8 T-cell population were apparent only in HLA-B*57-negative patients. The HLA-B*57:01-restricted, HIV epitope-specific CD8 T-cell responses showed beneficial functional patterns and significantly lower frequencies of inhibitory receptor expression, i.e., PD-1 and coexpression of PD-1 and TIGIT, within the first year of infection. Coexpression of PD-1 and TIGIT was correlated with clinical markers of disease progression and declining percentages of the T-bethi Eomesdim CD8 T-cell population. In accordance with clinical and immunological deterioration in the HLA-B*57:01 group, the difference in PD-1 and TIGIT receptor expression did not persist to later stages of the disease.IMPORTANCE Given the synergistic nature of TIGIT and PD-1, the coexpression of those inhibitory receptors should be considered when evaluating T-cell pathogenesis, developing immunomodulatory therapies or vaccines for HIV, and when using immunotherapy or vaccination for other causes in HIV-infected patients. HIV-mediated T-cell exhaustion influences the patient´s disease progression, immune system and subsequently non-AIDS complications, and efficacy of vaccinations against other pathogens. Consequently, the possibilities of interfering with exhaustion are numerous. Expanding the use of immunomodulatory therapies to include HIV treatment depends on information about possible targets and their role in the deterioration of the immune system. Furthermore, the rise of immunotherapies against cancer and elevated cancer incidence in HIV-infected patients together increase the need for detailed knowledge of T-cell exhaustion and possible interactions. A broader approach to counteract immune exhaustion to alleviate complications and improve efficacy of other vaccines also promises to increase patients' health and quality of life.
Keywords: CD4; CD8-positive T lymphocytes; HIV Gag; HIV-1; PD-1; T-cell immunoreceptor with Ig and ITIM domain; TIGIT; cellular immunity; disease progression; evolution; human HLA-B*5701 antigen; molecular evolution; programmed cell death protein 1; viral load.
Copyright © 2020 Scharf et al.
Figures



Similar articles
-
Expression of TIGIT, PD-1 and HLA-DR/CD38 markers on CD8-T cells of children and adolescents infected with HIV and uninfected controls.Rev Inst Med Trop Sao Paulo. 2023 Feb 6;65:e14. doi: 10.1590/S1678-9946202365014. eCollection 2023. Rev Inst Med Trop Sao Paulo. 2023. PMID: 36753067 Free PMC article.
-
Correlation Between TIGIT Expression on CD8+ T Cells and Higher Cytotoxic Capacity.J Infect Dis. 2021 Nov 16;224(9):1599-1604. doi: 10.1093/infdis/jiab155. J Infect Dis. 2021. PMID: 33744939 Free PMC article.
-
PD-1+ TIGIT+ CD8+ T cells are associated with pathogenesis and progression of patients with hepatitis B virus-related hepatocellular carcinoma.Cancer Immunol Immunother. 2019 Dec;68(12):2041-2054. doi: 10.1007/s00262-019-02426-5. Epub 2019 Nov 12. Cancer Immunol Immunother. 2019. PMID: 31720814 Free PMC article.
-
The Role of Immunomodulatory Receptors in the Pathogenesis of HIV Infection: A Therapeutic Opportunity for HIV Cure?Front Immunol. 2020 Jul 2;11:1223. doi: 10.3389/fimmu.2020.01223. eCollection 2020. Front Immunol. 2020. PMID: 32714317 Free PMC article. Review.
-
Enhancing Human Immunodeficiency Virus-Specific CD8(+) T Cell Responses with Heteroclitic Peptides.Front Immunol. 2015 Jul 23;6:377. doi: 10.3389/fimmu.2015.00377. eCollection 2015. Front Immunol. 2015. PMID: 26257743 Free PMC article. Review.
Cited by
-
Can Soluble Immune Checkpoint Molecules on Exosomes Mediate Inflammation?J Neuroimmune Pharmacol. 2022 Dec;17(3-4):381-397. doi: 10.1007/s11481-021-10018-3. Epub 2021 Oct 25. J Neuroimmune Pharmacol. 2022. PMID: 34697721 Free PMC article. Review.
-
Tumor necrosis family receptor superfamily member 9/tumor necrosis factor receptor-associated factor 1 pathway on hepatitis C viral persistence and natural history.World J Hepatol. 2020 Oct 27;12(10):754-765. doi: 10.4254/wjh.v12.i10.754. World J Hepatol. 2020. PMID: 33200014 Free PMC article. Review.
-
Inverted CD8 T-Cell Exhaustion and Co-Stimulation Marker Balance Differentiate Aviremic HIV-2-Infected From Seronegative Individuals.Front Immunol. 2021 Oct 12;12:744530. doi: 10.3389/fimmu.2021.744530. eCollection 2021. Front Immunol. 2021. PMID: 34712231 Free PMC article.
-
CD155-TIGIT Axis as a Therapeutic Target for Cancer Immunotherapy.Curr Med Chem. 2024;31(13):1634-1645. doi: 10.2174/0929867330666230324152532. Curr Med Chem. 2024. PMID: 38666504 Review.
-
The CD8+ T Cell Noncytotoxic Antiviral Responses.Microbiol Mol Biol Rev. 2021 May 12;85(2):e00155-20. doi: 10.1128/MMBR.00155-20. Print 2021 May 19. Microbiol Mol Biol Rev. 2021. PMID: 33980586 Free PMC article. Review.
References
-
- Maldarelli F, Kearney M, Palmer S, Stephens R, Mican J, Polis MA, Davey RT, Kovacs J, Shao W, Rock-Kress D, Metcalf JA, Rehm C, Greer SE, Lucey DL, Danley K, Alter H, Mellors JW, Coffin JM. 2013. HIV populations are large and accumulate high genetic diversity in a nonlinear fashion. J Virol 87:10313–10323. doi:10.1128/JVI.01225-12. - DOI - PMC - PubMed
-
- Keele BF, Giorgi EE, Salazar-Gonzalez JF, Decker JM, Pham KT, Salazar MG, Sun C, Grayson T, Wang S, Li H, Wei X, Jiang C, Kirchherr JL, Gao F, Anderson JA, Ping LH, Swanstrom R, Tomaras GD, Blattner WA, Goepfert PA, Kilby JM, Saag MS, Delwart EL, Busch MP, Cohen MS, Montefiori DC, Haynes BF, Gaschen B, Athreya GS, Lee HY, Wood N, Seoighe C, Perelson AS, Bhattacharya T, Korber BT, Hahn BH, Shaw GM. 2008. Identification and characterization of transmitted and early founder virus envelopes in primary HIV-1 infection. Proc Natl Acad Sci U S A 105:7552–7557. doi:10.1073/pnas.0802203105. - DOI - PMC - PubMed
-
- Fellay J, Shianna KV, Ge D, Colombo S, Ledergerber B, Weale M, Zhang K, Gumbs C, Castagna A, Cossarizza A, Cozzi-Lepri A, De Luca A, Easterbrook P, Francioli P, Mallal S, Martinez-Picado J, Miro JM, Obel N, Smith JP, Wyniger J, Descombes P, Antonarakis SE, Letvin NL, McMichael AJ, Haynes BF, Telenti A, Goldstein DB. 2007. A whole-genome association study of major determinants for host control of HIV-1. Science 317:944–947. doi:10.1126/science.1143767. - DOI - PMC - PubMed
-
- Limou S, ANRS Genomic Group, Le Clerc S, Coulonges C, Carpentier W, Dina C, Delaneau O, Labib T, Taing L, Sladek R, Deveau C, Ratsimandresy R, Montes M, Spadoni JL, Lelievre JD, Levy Y, Therwath A, Schachter F, Matsuda F, Gut I, Froguel P, Delfraissy JF, Hercberg S, Zagury JF. 2009. Genomewide association study of an AIDS-nonprogression cohort emphasizes the role played by HLA genes (ANRS Genomewide Association Study 02). J Infect Dis 199:419–426. doi:10.1086/596067. - DOI - PubMed
Publication types
MeSH terms
Substances
Grants and funding
LinkOut - more resources
Full Text Sources
Medical
Molecular Biology Databases
Research Materials

