. 2020 Apr 28;13(629):eaaw7963.
doi: 10.1126/scisignal.aaw7963.

Local Ca2+ signals couple activation of TRPV1 and ANO1 sensory ion channels

Affiliations

Local Ca2+ signals couple activation of TRPV1 and ANO1 sensory ion channels

Shihab Shah et al. Sci Signal. .

Abstract

ANO1 (TMEM16A) is a Ca2+-activated Cl- channel (CaCC) expressed in peripheral somatosensory neurons that are activated by painful (noxious) stimuli. These neurons also express the Ca2+-permeable channel and noxious heat sensor TRPV1, which can activate ANO1. Here, we revealed an intricate mechanism of TRPV1-ANO1 channel coupling in rat dorsal root ganglion (DRG) neurons. Simultaneous optical monitoring of CaCC activity and Ca2+ dynamics revealed that the TRPV1 ligand capsaicin activated CaCCs. However, depletion of endoplasmic reticulum (ER) Ca2+ stores reduced capsaicin-induced Ca2+ increases and CaCC activation, suggesting that ER Ca2+ release contributed to TRPV1-induced CaCC activation. ER store depletion by plasma membrane-localized TRPV1 channels was demonstrated with an ER-localized Ca2+ sensor in neurons exposed to a cell-impermeable TRPV1 ligand. Proximity ligation assays established that ANO1, TRPV1, and the IP3 receptor IP3R1 were often found in close proximity to each other. Stochastic optical reconstruction microscopy (STORM) confirmed the close association between all three channels in DRG neurons. Together, our data reveal the existence of ANO1-containing multichannel nanodomains in DRG neurons and suggest that coupling between TRPV1 and ANO1 requires ER Ca2+ release, which may be necessary to enhance ANO1 activation.


Conflict of interest statement

Competing Interests: The authors declare that they have no competing interests.

Figures

Figure 1.
Figure 1.. Optical interrogation of Cl channel activity in DRG neurons.
(A) Schematic of the dual imaging protocol. DRG neurons are transfected with EYFP (H148Q/I152L); NaI (I) is added to the extracellular solutions. Upon stimulation of GPCRs such as the bradykinin receptor B2R, Ca2+ is released from the endoplasmic reticulum (ER) through the IP3R. This rise in intracellular Ca2+ is detected by fura-2 (depicted as brightening of cytosol in the middle and right panels). Activation of ANO1 channels by released Ca2+ results in I influx, which, in turn induces quenching of the EYFP-QL fluorescence (right panel). (B) Schematic of expected EYFP (H148Q/I152L) quenching in response to ANO1-mediated I influx (30 mM extracellular NaI; based on (19)). (C) Schematic of the optimized protocol developed in this study. The concentration of NaI is reduced in steps to develop a protocol with minimal agonist-independent quenching and sufficient dynamic range. (D) Representative traces of EYFP (H148Q/I152L) fluorescence quenching produced by 5 mM (black trace), 10 mM (red trace) and 30 mM (grey trace) extracellular NaI and subsequently added GABA (100 μM). (E) Scatter plots summarizing experiments similar to those shown in (D); 5 mM: n=5 neurons, 10 mM: n=5 neurons and 30 mM: n=7 neurons. Quenching produced after standard bath solution application (black circle), NaI application (red triangle) and NaI and GABA (100 μM) application (grey triangles). Asterisks denote the following: *p<0.05 and ***p<0.001 (paired t-test); n.s, not significant.
Figure 2.
Figure 2.. All-optical demonstration of coupling of CaCC activation to IP3R-mediated Ca2+ release.
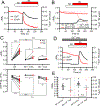
(A, B) Representative traces showing Ca2+ rises and concurrent EYFP-QL fluorescence quenching in small-diameter DRG neurons transfected with EYFP-QL and loaded with fura-2AM in response to BK (250 nM) application in the absence (A) or presence (B) of ANO1 inhibitors, T16A-inhA01 (50 μM) or Ani9 (500 nM). (C) Scatter plots summarizing experiments similar to those shown in (A); BK: n=12 neurons, (B); T16A-inhA01: n=6 neurons and Ani9: n=7 neurons. (D) Representative trace showing fura-2 and EYFP-QL responses to BK application in DRG neurons when Ca2+ was omitted from the extracellular solutions. (E) Comparison between the data for BK application with (n=12 neurons) and without extracellular Ca2+ (n=5 neurons). In C and E, asterisks denote the following: *p<0.05, **p<0.01 and ***p<0.001; n.s, not significant (paired or unpaired t-test, as appropriate).
Figure 3.
Figure 3.. ER Ca2+ release is required for the TRPV1-mediated activation of CaCC.
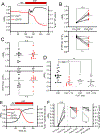
(A) Representative trace showing a Ca2+ rise and a concurrent EYFP-QL fluorescence quenching in a small-diameter DRG neuron transfected with EYFP-QL and loaded with fura-2AM in response to capsaicin (1 μM) application. (B) Scatter plots summarizing experiments similar to those shown in (A); n=9 neurons. (C) Comparisons for the fura-2 ratiometric Ca2+ measurement and EYFP-QL fluorescence quenching in response to capsaicin and BK application. (D) Summary of fura-2 Ca2+ imaging experiments in which capsaicin was applied either under control conditions (n=19 neurons), in the presence of thapsigargin (TG; 1μM; n=12 neurons), with no extracellular Ca2+ (n=9 neurons), or in the presence of cyclopiazonic acid (CPA; 1μM; n=16 neurons). (E) Representative traces showing a response to capsaicin in triple imaging experiments, where fura-2 Ca2+ levels (black trace), EYFP-QL fluorescence quenching (red trace) and ER-Ca2+ levels using red-CEPIA (grey trace) were simultaneously monitored in EYFP-QL and red-CEPIA co-transfected DRG neurons. (F) Scatter plots summarizing experiments similar to those shown in (E), n=8 neurons. In B-F, asterisks denote the following: *p<0.05, **p<0.01 and ***p<0.001; n.s, not significant (B, F: paired t-test and Wilcoxon signed-rank test; C: unpaired t-test; D: one-way ANOVA).
Figure 4.
Figure 4.. Thapsigargin disrupts capsaicin-induced currents in small-diameter DRG neurons.
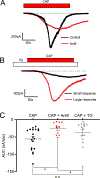
(A) Representative whole-cell patch clamp recordings from DRG neurons held at −60mV during application of capsaicin (1 μM) in the absence (black trace) or presence (red trace) of the ANO1 inhibitor Ani9 (500 nM). (B) Responses to capsaicin (1 μM) in the presence of thapsigargin (TG; 1 μM). Capsaicin-induced currents that were smaller (black trace) or of comparable amplitude (red trace) to those obtained under control conditions are shown. (C) Scatter plots summarizing areas under the curve for capsaicin responses in experiments similar to these shown in (A, B); control (n=18 neurons), Ani9 (n=11 neurons); TG (n=16 neurons). In C, asterisks denote the following: *p<0.05; n.s, not significant (Kruskal-Wallis ANOVA with Mann-Whitney test).
Figure 5.
Figure 5.. ER-localized TRPV1 channels are not engaged during extracellular TRPV1 stimulation in small-diameter DRG neurons.
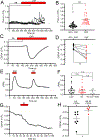
(A) Representative traces showing Ca2+ responses in small-diameter DRG neurons loaded with fluo-4AM in response to capsaicin (1 μM) in the presence of ruthenium red (RR; 10 μM) and after the RR washout. (B) Scatter plots summarizing experiments similar to those shown in (A); RR + CAP (n=42 neurons); CAP (n=38 neurons). (C) Representative trace showing fluorescence changes in a small-diameter DRG neurons transfected with green-CEPIA in response to capsaicin (1 μM) in the presence of RR (10 μM) and after the RR washout. (D) Scatter plots summarizing experiments similar to those shown in (C); n=6 neurons. (E) Representative traces showing a Ca2+ response in a small-diameter DRG neuron loaded with fura-2AM in response to capsaicin (1 μM) and K2 (30 μM). (F) Scatter plots summarizing experiments similar to those shown in (E); CAP n=19 neurons; K2 n=19 neurons; K2 (Ca2+ free) n=8 neurons. (G) Representative trace showing fluorescence changes in a small-diameter DRG neuron transfected with red-CEPIA in response to K2 (30 μM). (H) Scatter plots summarizing experiments similar to those shown in (F); K2 CEPIA n=8 neurons; NR K2 CEPIA n=4 neurons. In B, D, F, asterisks denote the following: *p<0.05, **p<0.01 and ***p<0.001; n.s, not significant (B: Mann-Whitney test; D: paired t-test; F: Kruskal-Wallis ANOVA with Mann-Whitney test; H: unpaired t-test).
Figure 6.
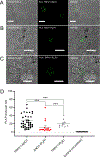
Figure 6.. ANO1, TRPV1 and IP3R1s are in close proximity in small-diameter DRG neurons as tested with Proximity Ligation Assay (PLA).
(A-C) PLA images for TRPV1-ANO1 (A), ANO1-IP3R1 (B) and TRPV1-IP3R1 (C) pairs in DRG cultures. Left panels: brightfield images; middle panels: PLA puncta detection; right panels: merged images of brightfield and PLA puncta. Scale bars represent 20 μm. (D) Scatter plots summarizing number of PLA puncta per cell in experiments similar to these shown in (A-C); TRPV1-ANO1 (n=41 neurons), ANO1-IP3R1 (n=16 neurons); TRPV1-IP3R1 (n=16 neurons); black outlined symbols depict negative control where only one primary antibody (against ANO1) was used in conjunction with both PLA secondary probes (fig. S6A, B). In D, asterisks denote the following: ***p<0.001 (Kruskal-Wallis ANOVA with Mann-Whitney test).
Figure 7.
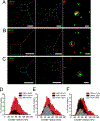
Figure 7.. ANO1, TRPV1 and IP3R1s are found in close proximity in small-diameter DRG neurons as tested with STORM.
(A-C) Right panels display representative STORM images from DRG neurons, double-labeled for either TRPV1 and ANO1 (A), ANO1 and IP3R1 (B), or TRPV1 and IP3R1 (C) using dye-pairs of Alexa Fluor 405/ Alexa Fluor 647 (green centroids) and Cy3/ Alexa Fluor 647 (red centroids); scale is indicated by the white bars. Scale bars represent: Left panel, 5μm; middle panel, 1μm; right panel, 0.2μm for A-C. (D to F) Cluster distributions representing double-labeled TRPV1-ANO1; n=6 neurons (D), ANO1-IP3R1; n=9 neurons (E), or TRPV1-IP3R1; n=6 neurons (F). Summary data for cluster percentages, localization number per cluster, and probability distribution statistics are given in tables S1–S3.
Figure 8.
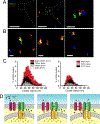
Figure 8.. Imaging of ANO1-TRPV1-IP3R1s complexes using three-color STORM.
(A, B) Representative STORM images for triple-labeled ANO1 (blue centroids) TRPV1 (green centroids) and IP3R1 (red centroids) in DRG neurons; scale is indicated by the white bars. Scale bars represent: A; Left panel, 5 μm; middle panel, 1 μm; right panel, 0.2 μm; B; 0.2 μm for all images. (C) Cluster distributions representing triple-labeled ANO1-TRPV1-IP3R1 combinations of proteins, protein pairs, or single proteins; n=12 neurons. Summary data for cluster percentages, localization number per cluster, and probability distribution statistics are given in tables S1–3. (D) Schematic depicting possible ANO1-TRPV1-IP3R1 functional coupling in DRG neurons. Our data suggests that a sizable fraction of ANO1, TRPV1 and IP3R1s are in close proximity at the ER-PM junctions and form complexes in small-diameter DRG neurons. TRPV1 activation leads to Na+ and Ca2+ influx (middle) but can also activate IP3R Ca2+ release (right), presumably through PLC activation. Release of Ca2+ from the ER maximizes ANO1 activation (right) which ultimately causes Cl efflux and depolarization of the neuron.

Similar articles

Cited by

References

    1. Jin X, Shah S, Du X, Zhang H, Gamper N, Activation of Ca2+-activated Cl− channel ANO1 by localized Ca2+ signals. J Physiol 594, 19–30 (2016). - PMC - PubMed
    1. Hartzell C, Putzier I, Arreola J, Calcium-activated chloride channels. Annu Rev Physiol 67, 719–758 (2005). - PubMed
    1. Pedemonte N, Galietta LJ, Structure and function of TMEM16 proteins (anoctamins). Physiol Rev 94, 419–459 (2014). - PubMed
    1. Huang F, Wong X, Jan LY, International Union of Basic and Clinical Pharmacology. LXXXV: calcium-activated chloride channels. Pharmacol Rev 64, 1–15 (2012). - PMC - PubMed
    1. Caputo A, Caci E, Ferrera L, Pedemonte N, Barsanti C, Sondo E, Pfeffer U, Ravazzolo R, Zegarra-Moran O, Galietta LJ, TMEM16A, a membrane protein associated with calcium-dependent chloride channel activity. Science 322, 590–594 (2008). - PubMed

Publication types