A spatio-temporal analysis to identify the drivers of malaria transmission in Bhutan
- PMID: 32341415
- PMCID: PMC7184595
- DOI: 10.1038/s41598-020-63896-7
A spatio-temporal analysis to identify the drivers of malaria transmission in Bhutan
Abstract
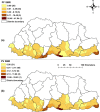
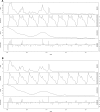
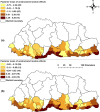
At a time when Bhutan is on the verge of malaria elimination, the aim of this study was to identify malaria clusters at high geographical resolution and to determine its association with local environmental characteristics. Malaria cases from 2006-2014 were obtained from the Vector-borne Disease Control Program under the Ministry of Health, Bhutan. A Zero-Inflated Poisson multivariable regression model with a conditional autoregressive (CAR) prior structure was developed. Bayesian Markov chain Monte Carlo (MCMC) simulation with Gibbs sampling was used to estimate posterior parameters. A total of 2,062 Plasmodium falciparum and 2,284 Plasmodium vivax cases were reported during the study period. Both species of malaria showed seasonal peaks with decreasing trend. Gender and age were not associated with the transmission of either species of malaria. P. falciparum increased by 0.7% (95% CrI: 0.3%, 0.9%) for a one mm increase in rainfall, while climatic variables (temperature and rainfall) were not associated with P. vivax. Insecticide treated bed net use and residual indoor insecticide coverage were unaccounted for in this study. Hot spots and clusters of both species were isolated in the central southern part of Bhutan bordering India. There was significant residual spatial clustering after accounting for climate and demographic variables.
Conflict of interest statement
The authors declare no competing interests.
Figures


Similar articles
-
Bayesian spatio-temporal modelling of environmental, climatic, and socio-economic influences on malaria in Central Vietnam.Malar J. 2024 Aug 24;23(1):258. doi: 10.1186/s12936-024-05074-y. Malar J. 2024. PMID: 39182127 Free PMC article.
-
Analysis of clinical malaria disease patterns and trends in Vietnam 2009-2015.Malar J. 2018 Sep 17;17(1):332. doi: 10.1186/s12936-018-2478-z. Malar J. 2018. PMID: 30223843 Free PMC article.
-
Spatiotemporal clustering of malaria in southern-central Ethiopia: A community-based cohort study.PLoS One. 2019 Sep 30;14(9):e0222986. doi: 10.1371/journal.pone.0222986. eCollection 2019. PLoS One. 2019. PMID: 31568489 Free PMC article. Clinical Trial.
-
Malaria epidemiology and interventions in Ethiopia from 2001 to 2016.Infect Dis Poverty. 2018 Nov 5;7(1):103. doi: 10.1186/s40249-018-0487-3. Infect Dis Poverty. 2018. PMID: 30392470 Free PMC article. Review.
-
Malaria control in Bhutan: case study of a country embarking on elimination.Malar J. 2012 Jan 9;11:9. doi: 10.1186/1475-2875-11-9. Malar J. 2012. PMID: 22230355 Free PMC article. Review.
Cited by
-
Bayesian spatio-temporal modelling of environmental, climatic, and socio-economic influences on malaria in Central Vietnam.Malar J. 2024 Aug 24;23(1):258. doi: 10.1186/s12936-024-05074-y. Malar J. 2024. PMID: 39182127 Free PMC article.
-
Risk mapping and socio-ecological drivers of soil-transmitted helminth infections in the Philippines: a spatial modelling study.Lancet Reg Health West Pac. 2023 Nov 22;43:100974. doi: 10.1016/j.lanwpc.2023.100974. eCollection 2024 Feb. Lancet Reg Health West Pac. 2023. PMID: 38076323 Free PMC article.
-
A Systematic Review of Areal Units and Adjacency Used in Bayesian Spatial and Spatio-Temporal Conditional Autoregressive Models in Health Research.Int J Environ Res Public Health. 2023 Jul 1;20(13):6277. doi: 10.3390/ijerph20136277. Int J Environ Res Public Health. 2023. PMID: 37444123 Free PMC article. Review.
-
Spatial analysis to evaluate risk of malaria in Northern Sumatera, Indonesia.Malar J. 2022 Aug 20;21(1):241. doi: 10.1186/s12936-022-04262-y. Malar J. 2022. PMID: 35987665 Free PMC article.
-
Identifying socio-ecological drivers of common cold in Bhutan: a national surveillance data analysis.Sci Rep. 2022 Jul 9;12(1):11716. doi: 10.1038/s41598-022-16069-7. Sci Rep. 2022. PMID: 35810192 Free PMC article.
References
-
- WHO. World Malaria Report 2017. (Geneva, Switzerland, 2017).
-
- WHO. World Malaria Report 2019. (Geneva, Switzerland, 2019).
-
- WHO. World Malaria Report 2016. (Geneva, Switzerland, 2016).
-
- WHO. World Malaria Report 2018. (Geneva, Switzerland, 2018).
-
- WHO. Confronting Plasmodium vivax malaria. (2015).
Publication types
MeSH terms
LinkOut - more resources
Full Text Sources

