

Optimal sidestepping of intraflagellar transport kinesins regulates structure and function of sensory cilia
- PMID: 32338401
- PMCID: PMC7298308
- DOI: 10.15252/embj.2019103955
Optimal sidestepping of intraflagellar transport kinesins regulates structure and function of sensory cilia
Erratum in
-
Optimal sidestepping of intraflagellar transport kinesins regulates structure and function of sensory cilia.EMBO J. 2020 Sep 15;39(18):e106366. doi: 10.15252/embj.2020106366. EMBO J. 2020. PMID: 33433002 Free PMC article.
Abstract
Cytoskeletal-based molecular motors produce force perpendicular to their direction of movement. However, it remains unknown whether and why motor proteins generate sidesteps movement along their filamentous tracks in vivo. Using Hessian structured illumination microscopy, we located green fluorescent protein (GFP)-labeled intraflagellar transport (IFT) particles inside sensory cilia of live Caenorhabditis elegans with 3-6-nanometer accuracy and 3.4-ms resolution. We found that IFT particles took sidesteps along axoneme microtubules, demonstrating that IFT motors generate torque in a living animal. Kinesin-II and OSM-3-kinesin collaboratively drive anterograde IFT. We showed that the deletion of kinesin-II, a torque-generating motor protein, reduced sidesteps, whereas the increase of neck flexibility of OSM-3-kinesin upregulated sidesteps. Either increase or decrease of sidesteps of IFT kinesins allowed ciliogenesis to the regular length, but changed IFT speeds, disrupted axonemal ninefold symmetry, and inhibited sensory cilia-dependent animal behaviors. Thus, an optimum level of IFT kinesin sidestepping is associated with the structural and functional fidelity of cilia.
Keywords: Caenorhabditis elegans; cilia; intraflagellar transport; kinesin; torque generation.
© 2020 The Authors.
Conflict of interest statement
The authors declare that they have no conflict of interest.
Figures
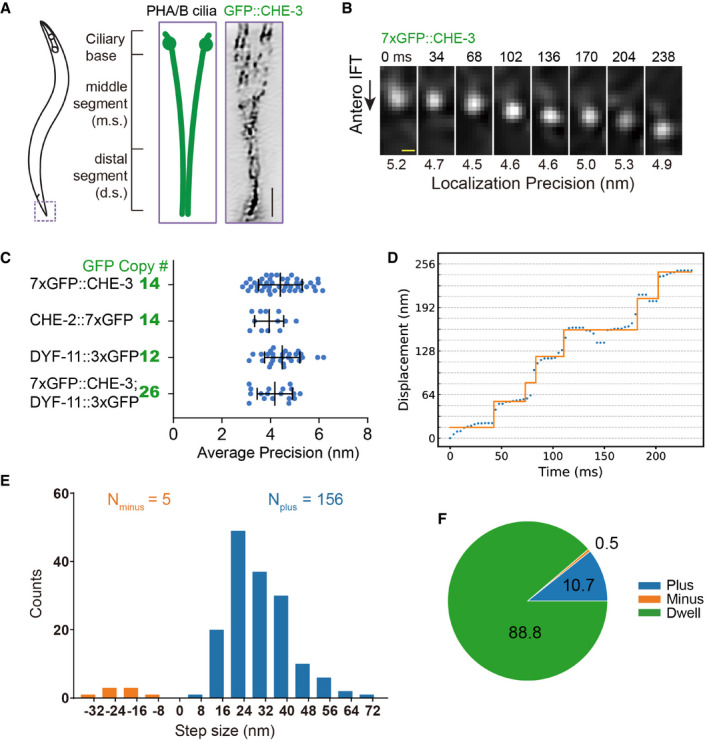
Schematic depiction of the Caenorhabditis elegans phasmid cilia (left). Two sensory cilia are aligned into the phasmid channel (the dashed box and enlarged in the middle). Each cilium contains a ciliary base, a middle segment (m.s.), and a distal segment (d.s.). Right shows an inverted fluorescence Hessian‐SIM image of GFP‐tagged dynein‐2 heavy chain CHE‐3 in cilia, in which individual puncta were resolved. Scale bar: 1 μm. Also shown in Appendix Fig S4A.
Frame series of an anterograde moving IFT particle from a 7xGFP::CHE‐3 worm. Localization precisions are shown under each frame. Time in millisecond (ms); scale bar, 100 nm. More examples from CHE‐2::7xGFP, DYF‐11::3xGFP, or 7xGFP::CHE‐3; DYF‐11::3xGFP animals are in Appendix Fig S3B and C.
Localization precisions (mean ± SD) of tracks from multi‐GFP‐labeled worms. The number of GFP copies was estimated as the following: The dynein‐2 heavy chain of CHE‐3 forms a dimer, 14 = 2 × 7; IFT particle subunit CHE‐2 is also a dimer, 14 = 2 × 7; IFT particle subunit DYF‐11 can be a tetramer, 12 = 4 × 3; and the genetic cross combined 7xGFP::CHE‐3 with DYF‐11::3XGFP, 26 = 2 × 7 + 4 × 3.
The representative diagram shows the displacement of the cargo within the middle ciliary segment. The y‐axis grid lines are spaced 16 nm. Protein CHE‐3 tagged with 7× GFP was used for tracking experiments. Trace was analyzed using the SIC fitting algorithm (Kalafut & Visscher, 2008).
Histogram of 161 displacements detected in 15 tracks extracted from 12 WT worms. The plus and minus displacements are defined as the upward “jumping” or downward “jumping” in Fig 1D. Protein markers used for tracking experiments are CHE‐3 tagged with 7× GFP, CHE‐2 tagged with 7× GFP, or CHE‐3 tagged with 7× GFP plus DYF‐11 tagged with 3× GFP.
The proportion of the plus displacement, the minus displacement, and dwell (defined as the segments in Fig 1D where there was no displacement detected) during imaging time of 15 tracks extracted from 12 WT animals. Proteins used for tracking experiments are the same as in Fig 1E.
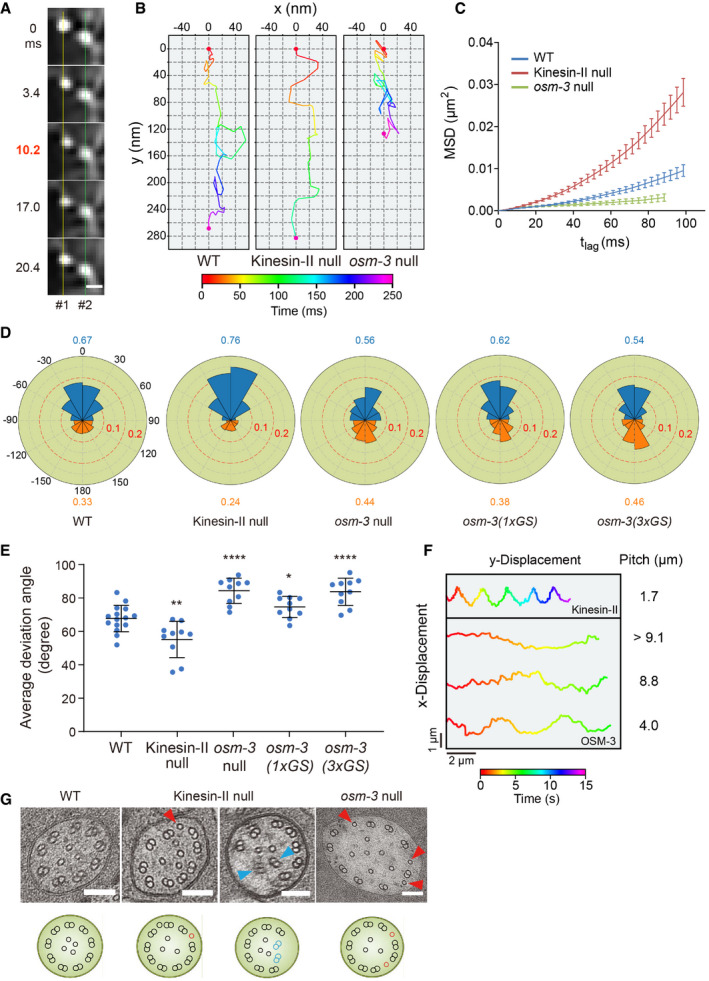
Frame series shows the off‐axis movement of an IFT particle (#1). A neighboring particle (#2) serves as a fiduciary marker. Scale bar: 200 nm.
Representative two‐dimensional IFT tracks from WT, kinesin‐II (klp‐11), and osm‐3 null animals. Red and violet circles indicate the start and end of the tracks, respectively. Proteins used for tracking experiments are CHE‐3 tagged with 7× GFP or DYF‐11 tagged with 3× GFP.
Time‐averaged mean‐square displacement (MSD) versus lag time (t lag) of 10–15 tracks from WT and IFT kinesin mutant animals. Proteins used for tracking experiments are CHE‐3 tagged with 7× GFP, CHE‐3 tagged with 7× GFP plus DYF‐11 tagged with 3× GFP, CHE‐2 tagged with 7× GFP, or DYF‐11 tagged with 3× GFP. Error bars indicate standard errors.
Angle histogram (rose plot) of the deviation angles of displacement in 10–15 tracks from WT and mutant animals. The deviation angle is defined as the angle between the displacement vector and the overall direction of motion. Deviation to the right or left of the overall direction is between 0° and 180° or between 0° and −180°, respectively. Deviations between 90°–180° and −90° to −180° are backstepping (orange). Proteins used for tracking experiments are the same as in Fig 1E.
Average deviation angles in 10–15 tracks from WT and mutant animals. Comparisons were performed with the WT. Proteins used for tracking experiments are the same as in Fig 1E. *P < 0.05, **P < 0.01, ****P < 0.0001 by Student's t‐tests. Error bars indicate standard deviations.
Representative tracks of the recombinant Caenorhabditis elegans kinesin‐II and OSM‐3‐kinesin moving along suspended MTs in the optical trap assay. Appendix Fig S3E depicts the experiment scheme.
Representative TEM images of the middle ciliary segments from WT and IFT kinesin mutant animals. Red arrowheads indicate ectopic singlet microtubules. Blue arrowheads indicate ectopic doublet microtubules. The schematics below depict the phenotype of each image. Scale bars: 100 nm.
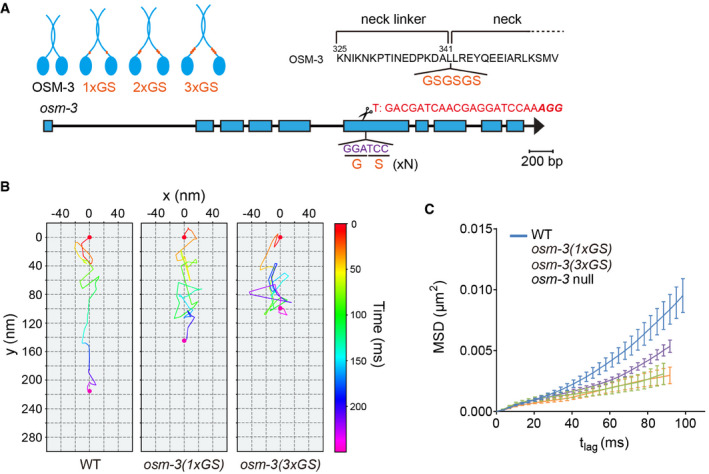
Design of OSM‐3 constructs with flexible necks. Top, poly‐GS repeats (orange) were knocked into the endogenous osm‐3 locus. Bottom, schematic of osm‐3 gene model, and sgRNA sequence.
Representative two‐dimensional IFT tracks from WT and OSM‐3(1 or 3xGS) animals. Red and violet circles indicate the start and end of the tracks, respectively. Proteins used for tracking experiments are the same as in Fig 1E.
Time‐averaged mean‐square displacement (MSD) versus lag time (t lag) of 10–15 tracks from WT and mutant worms. Proteins used for tracking experiments are the same as in Fig 1E. Error bars indicate standard errors.
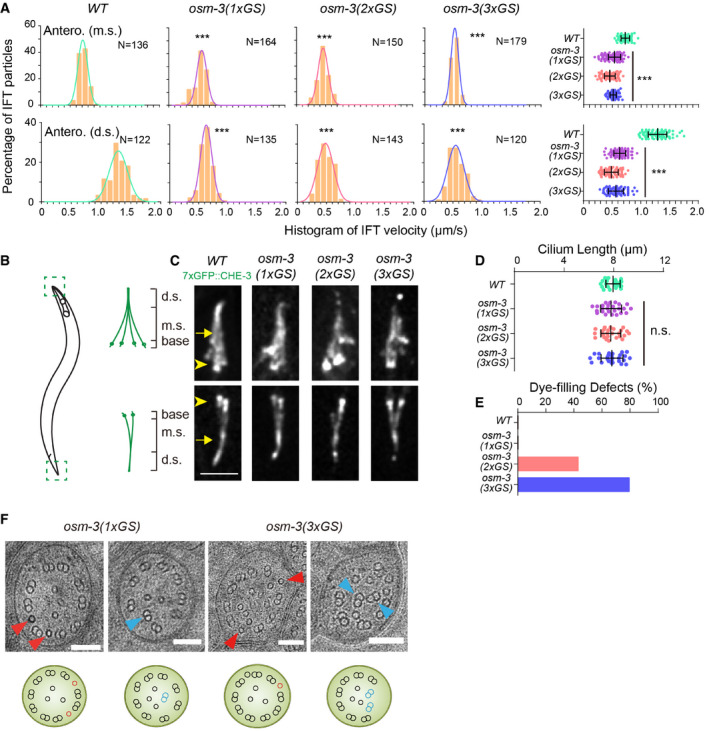
Histogram of anterograde IFT speeds of 3xGFP::CHE‐3 at the middle (top) and distal (bottom) ciliary segments (top). The plots were fit by a Gaussian distribution. Comparisons were performed between the WT and osm‐3 mutants. ***P < 0.001 by Student's t‐tests. Error bars indicate standard errors.
Schematic depiction of the Caenorhabditis elegans amphid and phasmid cilia. Each cilium contains a ciliary base, a middle segment (m.s.), and a distal segment (d.s.).
Amphid (top) and phasmid (bottom) cilia in the WT and osm‐3 GS knock‐in animals. Cilia are marked with 7xGFP::CHE‐3. Arrowheads indicate the ciliary base. Arrows indicate the junctions between the middle and distal segments. Scale bars: 5 μm.
Cilium length (mean ± SD) in WT and osm‐3 mutant animals. Comparisons were performed between the WT and osm‐3 mutants. N = 24–32. n.s., not significant by Student's t‐tests. Error bars indicate standard errors.
Quantifications of dye‐filling defects from WT and osm‐3 mutant animals. N ≥ 100.
Representative TEM images of the middle ciliary segments from osm‐3(1xGS) and osm‐3(3xGS) worms. Red arrowheads indicate ectopic singlet microtubules. Blue arrowheads indicate ectopic doublet microtubules. The schematics below depict the phenotype of each image. Scale bars: 100 nm.
Similar articles
-
Mechanisms of Regulation in Intraflagellar Transport.Cells. 2022 Sep 2;11(17):2737. doi: 10.3390/cells11172737. Cells. 2022. PMID: 36078145 Free PMC article. Review.
-
Measuring rates of intraflagellar transport along Caenorhabditis elegans sensory cilia using fluorescence microscopy.Methods Enzymol. 2013;524:285-304. doi: 10.1016/B978-0-12-397945-2.00016-0. Methods Enzymol. 2013. PMID: 23498746
-
Analysis of intraflagellar transport in C. elegans sensory cilia.Methods Cell Biol. 2009;93:235-66. doi: 10.1016/S0091-679X(08)93013-2. Epub 2009 Dec 4. Methods Cell Biol. 2009. PMID: 20409821
-
Dauer pheromone and G-protein signaling modulate the coordination of intraflagellar transport kinesin motor proteins in C. elegans.J Cell Sci. 2010 Jun 15;123(Pt 12):2077-84. doi: 10.1242/jcs.062885. Epub 2010 May 25. J Cell Sci. 2010. PMID: 20501698
-
Intraflagellar transport: mechanisms of motor action, cooperation, and cargo delivery.FEBS J. 2017 Sep;284(18):2905-2931. doi: 10.1111/febs.14068. Epub 2017 Apr 18. FEBS J. 2017. PMID: 28342295 Free PMC article. Review.
Cited by
-
NEKL-4 regulates microtubule stability and mitochondrial health in C. elegans ciliated neurons.bioRxiv [Preprint]. 2024 Feb 14:2024.02.14.580304. doi: 10.1101/2024.02.14.580304. bioRxiv. 2024. Update in: J Cell Biol. 2024 Sep 2;223(9):e202402006. doi: 10.1083/jcb.202402006. PMID: 38405845 Free PMC article. Updated. Preprint.
-
NEKL-4 regulates microtubule stability and mitochondrial health in ciliated neurons.J Cell Biol. 2024 Sep 2;223(9):e202402006. doi: 10.1083/jcb.202402006. Epub 2024 May 20. J Cell Biol. 2024. PMID: 38767515 Free PMC article.
-
Modulation of inner junction proteins contributes to axoneme differentiation.Proc Natl Acad Sci U S A. 2023 Jul 25;120(30):e2303955120. doi: 10.1073/pnas.2303955120. Epub 2023 Jul 18. Proc Natl Acad Sci U S A. 2023. PMID: 37463209 Free PMC article.
-
Mechanisms of Regulation in Intraflagellar Transport.Cells. 2022 Sep 2;11(17):2737. doi: 10.3390/cells11172737. Cells. 2022. PMID: 36078145 Free PMC article. Review.
-
Neurons dispose of hyperactive kinesin into glial cells for clearance.EMBO J. 2024 Jul;43(13):2606-2635. doi: 10.1038/s44318-024-00118-0. Epub 2024 May 28. EMBO J. 2024. PMID: 38806659 Free PMC article.
References
-
- Bargmann CI, Hartwieg E, Horvitz HR (1993) Odorant‐selective genes and neurons mediate olfaction in C. elegans . Cell 74: 515–527 - PubMed
-
- Brunnbauer M, Dombi R, Ho TH, Schliwa M, Rief M, Okten Z (2012) Torque generation of kinesin motors is governed by the stability of the neck domain. Mol Cell 46: 147–158 - PubMed
Publication types
MeSH terms
Substances
Grants and funding
LinkOut - more resources
Full Text Sources
Research Materials
