. 2020 Apr 6;219(4):e201907018.
doi: 10.1083/jcb.201907018.

Spectrin couples cell shape, cortical tension, and Hippo signaling in retinal epithelial morphogenesis

Affiliations

Spectrin couples cell shape, cortical tension, and Hippo signaling in retinal epithelial morphogenesis

Hua Deng et al. J Cell Biol. .

Abstract

Although extracellular force has a profound effect on cell shape, cytoskeleton tension, and cell proliferation through the Hippo signaling effector Yki/YAP/TAZ, how intracellular force regulates these processes remains poorly understood. Here, we report an essential role for spectrin in specifying cell shape by transmitting intracellular actomyosin force to cell membrane. While activation of myosin II in Drosophila melanogaster pupal retina leads to increased cortical tension, apical constriction, and Yki-mediated hyperplasia, spectrin mutant cells, despite showing myosin II activation and Yki-mediated hyperplasia, paradoxically display decreased cortical tension and expanded apical area. Mechanistically, we show that spectrin is required for tethering cortical F-actin to cell membrane domains outside the adherens junctions (AJs). Thus, in the absence of spectrin, the weakened attachment of cortical F-actin to plasma membrane results in a failure to transmit actomyosin force to cell membrane, causing an expansion of apical surfaces. These results uncover an essential mechanism that couples cell shape, cortical tension, and Hippo signaling and highlight the importance of non-AJ membrane domains in dictating cell shape in tissue morphogenesis.


Figures

Figure 1.
Figure 1.
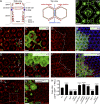
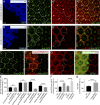
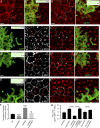
Spectrin couples cell shape and Hippo signaling in Drosophila retina development. (A) A cartoon showing side view (cross section) and top view (tangential section around AJs) of imaginal disc epithelial cells. Left (side view): The apical membrane domain includes the membrane region above the AJs; the lateral membrane domain includes the membrane region below the AJs but not the basal membrane that faces the ECM; junctional membrane domain refers to AJ-associated membrane region. Note the AJ-associated actomyosin cytoskeleton attached to membrane through AJs, and the apical and lateral cortical actomyosin cytoskeleton attached to the membrane. The septate junctions (SJs) containing Dlg are located laterally to AJs. Right (top view): Cell shape is dictated by cell surface tension, which is determined by the antagonistic cortical tension and adhesion force. (B) DE-cad staining highlighting the hexagonal geometry of a single wild-type pupal eye ommatidium at 40 h APF. The four cone cells (c), two 1° PECs, six 2° PECs, three 3° PECs, and three bristle cells (b) of an ommatidium are marked. (C and C’) A pupal eye disc containing GFP-positive MARCM clones with SqhEE overexpression was stained for DE-cad. PECs with SqhEE overexpression (green labels in C) exhibit decreased apical size compared with the corresponding wild-type PECs (white labels in C) in the same ommatidium. Also note the extra interommatidial cells (yellow asterisks in C) in ommatidia with SqhEE overexpression. 20 ommatidial clusters were used for counting interommatidial cells, and the number on the lower left in C indicates the number of extra cells per cluster. (D and D’) A pupal eye disc containing GFP-positive clones with SqhEE overexpression was stained for ex-lacZ and DNA dye DAPI. Note the elevated ex-lacZ level in clones with SqhEE overexpression. (E and E’) A pupal eye disc containing GFP-positive MARCM clones with α-spec RNAi was stained for DE-cad. PECs with α-spec RNAi (green labels in E) exhibit increased apical size compared to the corresponding wild-type PECs (white labels in E) in the same ommatidium. Also note the extra interommatidial cells (yellow asterisks in E) in ommatidia with α-spec RNAi. 20 ommatidia were used for counting interommatidial cells, and the number on the lower left in E indicates the number of extra cells per cluster. (F and F’) A pupal eye disc containing GFP-positive MARCM clones with α-spec RNAi was stained for ex-lacZ and DNA dye DAPI. Note the elevated ex-lacZ level in clones with α-spec RNAi. (G and G’) A pupal eye disc containing GFP-negative α-specrg41 mutant clone was stained for DE-cad. α-specrg41 mutant PECs (green labels in G) exhibit increased apical size compared with the corresponding wild-type PECs (white labels in G) in the same ommatidium. Also note the absence of the hexagonal geometry of the mutant ommatidium (dashed line boxed region in G) compared with the wild-type ommatidium (B). (H) Quantification of apical area of the indicated mutant 1° PEC relative to the corresponding wild-type 1° PEC in the same ommatidium (means ± SEM, n = 15 for each genotype), ****, P < 0.0001 (Student’s t test, all compared with wild type). Scale bars, 3 µm (B), 5 µm (C’, D’, E’, F’, and G’).
Figure S1.
Figure S1.
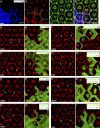
Further analysis of the coupling between cell shape and myosin II activity in wild-type and spectrin mutant PECs. All images are z-projections at AJs. Pupal eye discs containing GFP-positive MARCM clones of the indicated genotypes were stained for p-MLC (red) and DE-cad (green) in A–A”’ or DE-cad (red) in B–I’. Arrowheads indicate mutant 1° PEC and arrows indicate wild-type 1° PEC from the same mosaic ommatidium. PECs with RokCAT overexpression show increased p-MLC and decreased apical size compared with wild-type PECs (compare arrow and arrowhead in A”). Also note the extra interommatidial cells (yellow asterisks in A”) in RokCAT overexpression clones. 20 ommatidia were used for counting interommatidial cells, and the number on the lower left in A” indicates the number of extra cells per cluster. See Fig. 1 H for quantification of apical area of 1° PEC analyzed in A–I. Scale bars, 5 µm.
Figure S2.
Figure S2.
Analysis of ommatidia size, cell polarity, and Ena expression/function in pupal retina. (A–B”’) A pupal eye disc containing GFP-positive MARCM clones with α-spec RNAi was stained for PAR-3 (green) and Dlg (red), which mark the apical and lateral domain of epithelia cells, respectively. (B–B”’) A vertical section shown through the eye disc in A–A”’ in which the position of the vertical section is indicated by a straight dotted line in A. A’ and A” show z-projections around cell apical and lateral plane, respectively. Note the normal distribution of PAR-3 and Dlg in α-spec mutant PECs (arrowheads) compared with wild-type PECs (arrows). Also note α-spec mutant PECs exhibit increased lateral areas than wild-type cells (compare arrowheads and arrows in A” and B”). Quantification of ommatidium size at lateral position is shown in E. (C–D’) A pupal eye disc containing GFP-positive MARCM clones with α-spec RNAi was stained for DE-cad. D and D’ are magnified view of the dashed-line circled wild-type and mutant ommatidia in C’. Note that α-spec mutant ommatidium (green label in C’ and D’) exhibit increased apical size compared with wild-type ommatidium (white label in C’ and D). Quantification of ommatidium size at apical position is shown in E. (E) Normalized mean ommatidium size at apical and lateral position for the indicated genotypes. Data are means ± SEM (n ≥ 15 ommatidia, representative of five animals). ****, P < 0.0001. (F–G’) Pupal eye discs containing GFP-positive β-specC mutant MARCM clones were stained for DE-cad (red, in F and F’), or Dlg (red, in G and G’). β-specC mutant PECs (arrowhead in F) have similar apical size as wild-type PECs (arrow in F) but exhibit increased lateral size (arrowheads in G) compared with wild-type PECs (arrows in G). Quantification of ommatidium apical and lateral size is shown in H. (H) Normalized mean ommatidium apical and lateral size for the indicated genotypes. Data are means ± SEM (n ≥ 15 ommatidia, representative of five animals). ****, P < 0.0001. N.S., no significance. (I and I’) A pupal eye disc containing GFP-positive MARCM clones with α-spec RNAi was stained for Ena (red), showing similar Ena protein level and localization inside and outside the mutant clones. Quantification of Ena membrane intensity is shown in J. (J) Mean Ena membrane intensity analyzed in I. Data are means ± SEM (n ≥ 20 cells, representative of five animals). N.S., no significance. (K and K’) A Triton X-100–permeabilized pupal eye disc containing GFP-positive ena46 mutant MARCM clones was stained for phalloidin (red). Note the similar cortical F-actin level inside and outside the mutant clones. Quantification of phalloidin membrane intensity is shown in L. (L) Mean phalloidin membrane intensity analyzed in K. Data are means ± SEM (n ≥ 20 cells, representative of five animals). Scale bars, 5 µm. N.S., no significance.
Figure 2.
Figure 2.
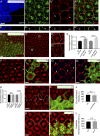
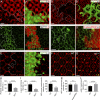
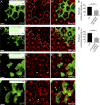
Spectrin is required for attaching cortical F-actin to the cell membrane. (A–B’) A nonpermeabilized pupal eye disc containing RFP-positive MARCM clones with α-spec RNAi was imaged for utABD-GFP at the indicated apical-basal positions. Note normal cortical F-actin in α-spec mutant PECs. Quantification of utABD-GFP membrane intensity is shown in F. (C–D’) A Triton X-100–permeabilized pupal eye disc containing GFP-positive MARCM clones with α-spec RNAi was stained for phalloidin. C and C’ and D and D’ show z-projections around cell apical and lateral plane, respectively. Note the reduced cortical F-actin level in α-spec mutant PECs (arrowheads) in both apical and lateral membrane compared with wild-type PECs (arrows). Quantification of phalloidin membrane intensity is shown in G. (E–E”’) A Triton X-100–permeabilized pupal eye disc containing RFP-positive MARCM clones with α-spec RNAi and mCD8-GFP-utABD expression was imaged for mCD8-GFP-utABD and stained for phalloidin. Note the strong cortical F-actin staining in cell cortex where mCD8-GFP-utABD accumulated (arrowheads in E’ and E”). (F) Quantification of mean utABD-GFP intensity in the specified membrane domains analyzed in A–B’. Note no significant difference between α-spec mutant PECs and wild-type PECs. Data are means ± SEM (n ≥ 20 cells, representative of 10 pupal eyes); N.S., no significance (Student’s t test). (G) Quantification of mean phalloidin intensity in the specified membrane domains analyzed in C–D’. Note significant decrease of phalloidin membrane intensity in α-spec mutant PECs. Data are means ± SEM (n ≥ 20 cells, representative of 10 pupal eyes). ****, P < 0.0001. (H) Reduced cortical tension in spectrin mutant cells. Left: A nub-Gal4 UAS-EGFP driver showing EGFP expression in the wing pouch region in third instar wing discs. Right: Measurement of cortical tension by MPA. The Teff was measured for individual cells of the indicated genotype and plotted in the graph (means ± SEM, n = 15 for spectrin mutant cells, n = 12 for control cells). **, P < 0.01 (Student’s t test). Scale bars, 5 µm (A, C, and E) and 100 µm (H).
Figure 3.
Figure 3.
Spectrin is not required for attaching AJ-associated F-actin to cell membrane or transmission of cortical force to AJs. (A–A”’) A Triton X-100–permeabilized pupal eye disc containing GFP-positive MARCM clones with α-spec RNAi was stained for the AJ marker DE-cad and phalloidin. Note the normal DE-cad and circumferential F-actin cables associated with AJs in α-spec mutant PECs (arrowheads in A’–A”’) compared with those in the neighboring wild-type PECs (arrows in A’–A”’). Quantification of DE-cad and phalloidin intensity is shown in E. (B–B”’) A pupal eye disc containing DsRed-positive clones with α-spec RNAi was imaged for Jub-GFP and stained for p-MLC. Note the increased level of Jub-GFP at AJs (B’) and increased cortical p-MLC (B”) in α-spec mutant PECs. Quantification of Jub-GFP and p-MLC junctional intensity is shown in F. (C and C’) Similar to B–B”’ except that Wts-GFP was examined. Note the increased level of Wts-GFP in α-spec mutant PECs (C). Quantification of Wts-GFP junctional intensity is shown in G. (D and D’) A pupal eye disc containing GFP-positive MARCM clones with α-spec RNAi was stained for Ex. Note the elevated Ex level in clones with α-spec RNAi. (E–G) Quantification of mean membrane intensity of the indicated proteins in the specified membrane domains. Data are means ± SEM (n ≥ 20 cells, representative of 10 pupal eyes). ****, P < 0.0001. Scale bars, 5 µm. N.S., no significance.
Figure 4.
Figure 4.
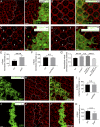
Hts is required for recruiting α-Spec to cell cortex and loss of Hts phenocopies spectrin mutants. The z-projections at lateral domain (A–E) and AJs (F and G), respectively. (A and A’) A Triton X-100–permeabilized pupal eye disc containing GFP-positive htsnull MARCM clones was stained for phalloidin. Decreased cortical F-actin level in htsnull mutant PECs was most obvious in lateral domain (A and A’) but less obvious in apical domain (see Fig. S3, A and A’). Quantification of phalloidin membrane intensity is shown in H. (B and B’) Similar to A and A’ except that α-Spec staining is shown. Note the decreased cortical α-Spec level in htsnull mutant PECs. Quantification of α-Spec membrane intensity is shown in I. (C and C’) A third instar wing disc containing RFP-negative htsnull mutant clones was imaged for GFP–α-Spec. Note the dramatically decreased level of cortical GFP–α-Spec in htsnull mutant clones. Quantification of GFP–α-Spec membrane intensity is shown in J. (D and D’) A third instar wing disc containing DsRed-positive clones expressing α-spec RNAi was imaged for GFP-Hts. Note the similar level of cortical GFP-Hts inside and outside the mutant clones. Quantification of GFP-Hts membrane intensity is shown in K. (E and E’) A pupal eye disc containing GFP-positive MARCM clones with the htsnull mutation was stained for p-MLC. Note the increased level of cortical p-MLC in the htsnull mutant cones. Quantification of p-MLC membrane intensity is shown in L. (F and G) Pupal eye discs of the indicated genotypes were stained for DE-cad. Note the extra interommatidial cells in hts mutant eye discs (yellow asterisks in G). 20 ommatidia of each genotype were used for counting interommatidial cells, and the number on the lower right of each panel indicates the number of extra cells per cluster. (H–L) Quantification of mean membrane intensity of the indicated proteins analyzed in A–E. Data are means ± SEM (n ≥ 20 cells, representative of five animals). ****, P < 0.0001. Scale bars, 5 µm. N.S., no significance.
Figure S3.
Figure S3.
Analysis of cortical F-actin and cell shape in htsnull mutant PECs. (A–B’) A Triton X-100–permeabilized pupal eye disc containing GFP-positive htsnull MARCM clones was stained for phalloidin. A and A’ and B and B’ show z-projections at apical and lateral position, respectively. Note the reduced cortical F-actin level in htsnull mutant PECs in both apical and lateral membrane compared with wild-type PECs. Quantification of phalloidin membrane intensity is shown in E. (C–D’) Pupal eye discs containing GFP-negative htsnull mutant clones (C and C') or GFP-positive htsnull MARCM clones (D and D') were stained for DE-cad (red, in C and C’) or Dlg (red, in D and D’). htsnull mutant PECs (arrowhead in C) have similar apical size as wild-type PECs (arrow in C) but exhibit increased lateral size (arrowheads in D) compared with wild-type PECs (arrows in D). Quantification of ommatidium apical and lateral size is shown in F. (E) Mean phalloidin membrane intensity of htsnull mutant PECs at the indicated apical-basal position analyzed in A–B. Note the decrease of phalloidin membrane intensity in both apical and lateral domains. Data are means ± SEM (n ≥ 20 cells, representative of five animals). ****, P < 0.0001. (F) Normalized mean ommatidium apical and lateral size analyzed in C–D. Data are means ± SEM (n ≥ 15 ommatidia, representative of five animals). ****, P < 0.0001. N.S., no significance. (G) Normalized mean apical membrane phalloidin intensity in PECs of the indicated genotypes. Note the higher apical cortex F-actin level in htsnull mutant PECs compared with α-spec RNAi PECs. ****, P < 0.0001. Scale bar, 5 µm.
Figure S4.
Figure S4.
Analysis of cortical α-Spec level in different genetic background and the importance of the PH domain of β-Spec in cell shape determination. All images are z-projections at lateral position. (A and A’) A pupal eye disc containing GFP-negative cora5 mutant clones was stained for α-Spec. Note the increased cortical α-Spec level in the mutant PECs. Quantification of α-Spec membrane intensity is shown in E. (B and B’) A pupal eye disc containing GFP-positive MARCM clones with ank1 RNAi was stained for α-Spec. Note the normal cortical α-Spec level in ank1 mutant PECs. Quantification of α-Spec membrane intensity is shown in F. (C–D’) Pupal eye discs containing GFP-positive β-specC mutant MARCM clones expressing β-SpecΔPH (C and C’) or Myr-β-SpecΔPH (D and D’) were stained for Dlg. Myr-β-SpecΔPH, but not β-SpecΔPH, rescued the cell expansion phenotype of β-specC mutant PECs. Arrows mark wild-type PECs and arrowheads mark β-spec mutant PECs expressing the indicated β-Spec transgene. Quantification of ommatidium lateral size is shown in G. (E and F) Mean α-Spec membrane intensity in PECs analyzed in A–B. Data are means ± SEM (n ≥ 20 cells, representative of five animals). ****, P < 0.0001. N.S., no significance. (G) Normalized mean ommatidium lateral size analyzed in C–D. Data are means ± SEM (n ≥ 15 ommatidia, representative of five animals). ****, P < 0.0001. N.S., no significance. (H–K) Pupal eye discs containing GFP-positive MARCM clones with cpa RNAi (H–H”) or DiaCA overexpression (J–J”) were stained for α-Spec (red). Cortical α-Spec level remained unchanged in cpa RNAi clones or decreased in DiaCA overexpression clones. Mean α-Spec membrane intensity is shown in I–K. Data are means ± SEM (n ≥ 20 cells, representative of five animals). ****, P < 0.0001. Scale bars, 5 µm. N.S., no significance.
Figure 5.
Figure 5.
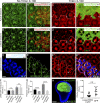
The association of spectrin with cell membrane requires the PH domain of β-Spec, but not its Ank-binding domain. All images are z-projections at lateral position. (A and A’) A Triton X-100–permeabilized pupal eye disc containing GFP-positive β-specC mutant MARCM clones was stained for phalloidin. Note the decreased cortical F-actin level in β-specC mutant PECs. (B) Normalized mean phalloidin membrane intensity in A, C”, D”, E”, and F”. Data are means ± SEM (n ≥ 20 cells, representative of five animals). ****, P < 0.0001. N.S., no significance. (C–F’”) Triton X-100–permeabilized pupal eye discs containing GFP-positive MARCM clones of the indicated genotypes were stained for Myc (epitope on the β-Spec transgenes) and phalloidin. Note the failure of β-SpecΔPH to localize to cell membrane and its inability to rescue cortical F-actin level in β-specC mutant PECs (C–C’”). By contrast, Myr-β-SpecΔPH (D–D’”), wild-type β-Spec (E–E’”), or β-Specα8 (F–F’”) accumulated on cell membrane and rescued the cortical F-actin level in β-specC mutant PECs. Quantification of phalloidin membrane intensity is shown in B. Scale bars, 5 µm.
Figure 6.
Figure 6.
Myr-WASp promotes the recruitment of α-Spec to the cell cortex. All images are z-projections at lateral position. (A and A’) A Triton X-100–permeabilized pupal eye disc containing GFP-positive MARCM clones with Myr-WASp overexpression was stained for phalloidin. Note the increased cortical F-actin level in the overexpression clones. Quantification of phalloidin membrane intensity is shown in F. (B and B’) Similar to A and A’ except that α-Spec staining was examined. Note the increased cortical α-Spec level in the overexpression clones. Quantification of α-Spec membrane intensity is shown in G. (C and C’) A Triton X-100–permeabilized pupal eye disc containing GFP-positive htsnull mutant MARCM clones with Myr-WASp overexpression was stained for phalloidin. Note the decreased cortical F-actin level in htsnull mutant clones with Myr-WASp overexpression. Quantification of phalloidin membrane intensity is shown in F. (D and D’) Similar to C and C’ except that α-Spec staining was examined. Note the decreased cortical α-Spec level in htsnull mutant clones with Myr-WASp overexpression. Quantification of α-Spec membrane intensity is shown in G. (E and E’) A pupal eye disc containing GFP-positive arpc1Q25sd mutant MARCM clones was stained for α-Spec. Note the decreased cortical α-Spec level in arpc1 mutant clones. (F and G) Normalized mean membrane intensity of α-Spec or phalloidin staining for the indicated genotypes. Data are means ± SEM (n ≥ 20 cells, representative of five animals). ****, P < 0.0001. Scale bars, 5 µm.
Figure 7.
Figure 7.
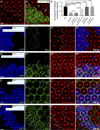
Cortical F-actin and cell shape defects in spectrin mutant PECs are rescued by inactivation of cpa. The z-projections at apical domain (A and B) and AJs (C–E), respectively. (A and A’) A Triton X-100–permeabilized pupal eye disc containing GFP-positive MARCM clones with cpa RNAi was stained for phalloidin. Note the increased cortical F-actin level in cpa mutant PECs. Quantification of phalloidin membrane intensity is shown in F. (B and B’) Similar to A and A’ except that MARCM clones with RNAi of both cpa and α-spec were examined. Note the modestly increased cortical F-actin level in the mutant PECs. Quantification of phalloidin membrane intensity is shown in F. (C–C”’) A pupal eye disc containing GFP-positive MARCM clones with cpa RNAi was stained for p-MLC (white, C’) and DE-cad (red, C”). Note the normal p-MLC level in the mutant PECs. Also note the normal apical area of cpa mutant 1° PEC (arrowhead, C”) compared with the wild-type 1° PEC (arrow, C”) in the same mosaic ommatidium. Quantification of apical area of 1° PEC is shown in G. (D–D”’) Similar to C–C’” except that MARCM clones with RNAi of both cpa and α-spec were examined. Note the increased p-MLC level in the mutant PECs. Also note the dramatic decrease in apical area in the mutant 1° PEC (arrowhead, D”) compared with the wild-type 1° PEC (arrow, D”) in the same mosaic ommatidium. Quantification of apical area of 1° PEC is shown in G. (E–E”’) Similar to D–D’” except that the eye disc was treated by the Rok inhibitor Y27632 for 1 h before fixation. Note the similar p-MLC level inside and outside the mutant clones (E’). Also note the increased apical area in the mutant 1° PEC (arrowhead, E”) compared with the wild-type 1° PEC (arrow, E”) in the same mosaic ommatidium. Quantification of apical area of 1° PEC is shown in G. (F) Normalized mean phalloidin membrane intensity analyzed in A–B. Data are means ± SEM (n ≥ 20 cells, representative of five animals). ****, P < 0.0001; **, P < 0.01 (Student’s t test, all compared with wild type). (G) Quantification of 1° PECs apical area of the indicated genotypes analyzed in C–E (means ± SEM, n = 15 for each genotype). ****, P < 0.0001. Scale bars, 5 µm.
Figure S5.
Figure S5.
Myr-WASp overexpression did not rescue the cortical F-actin and cell shape defects in spectrin mutant PECs. The z-projections at lateral domain (A and C) and z-projections at AJs (E–F). (A–A”) A Triton X-100–permeabilized pupal eye disc containing GFP-positive MARCM clones with α-spec RNAi and Myr-WASp overexpression was stained for phalloidin. Note the decreased cortical F-actin level in the mutant clones. Quantification of phalloidin membrane intensity is shown in B. (B) Mean phalloidin membrane intensity analyzed in A–A”. Data are means ± SEM (n ≥ 20 cells, representative of five animals). ****, P < 0.0001. (C–C”) A Triton X-100–permeabilized pupal eye disc containing GFP-positive MARCM clones with cpa/α-spec double RNAi and Myr-WASp overexpression was stained for phalloidin. Note the decreased cortical F-actin level in the mutant clones. Quantification of phalloidin membrane intensity is shown in D. (D) Mean phalloidin membrane intensity analyzed in C–C”. Data are means ± SEM (n ≥ 20 cells, representative of five animals). ****, P < 0.0001. (E–F”) Pupal eye discs containing GFP-positive MARCM clones with α-spec RNAi and Myr-WASp overexpression (E–E”) or with Myr-WASp overexpression only (F–F”) were stained for DE-cad to reveal cell shape. Note the increased apical area of 1° PEC with α-spec RNAi and Myr-WASp overexpression (arrowhead in E’) compared with wild-type 1° PEC (arrow in E’) in the same mosaic ommatidium. Also note that Myr-WASp overexpression alone did not affect apical area of 1° PEC (compare arrowhead and arrow in F’). Scale bars, 5 µm.
Figure 8.
Figure 8.
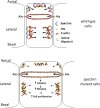
A schematic model depicting the role of spectrin in coupling cell shape, cortical tension, and Hippo signaling. Top: WASp-mediated actin polymerization causes Hts-dependent recruitment of spectrin to cellular cortex, where spectrin tethers newly produced F-actin to cell membrane and transmits cortical actomyosin force to cell membrane to support appropriate cell shape. Bottom: Activation of myosin II in spectrin mutant PECs causes higher tension at AJs (larger arrows), leading to accumulation of Jub-Wts complex at AJs and inhibition of Wts activity, which in turn activates Yki and cell proliferation. However, cortical tension at non–AJ membrane domains is lower due to the failure of transmitting cortical actomyosin force to cell membrane (dashed arrows), leading to expanded cell diameter.

Similar articles

Cited by

References

    1. Aragona M., Panciera T., Manfrin A., Giulitti S., Michielin F., Elvassore N., Dupont S., and Piccolo S.. 2013. A mechanical checkpoint controls multicellular growth through YAP/TAZ regulation by actin-processing factors. Cell. 154:1047–1059. 10.1016/j.cell.2013.07.042 - DOI - PubMed
    1. Bennett V., and Baines A.J.. 2001. Spectrin and ankyrin-based pathways: metazoan inventions for integrating cells into tissues. Physiol. Rev. 81:1353–1392. 10.1152/physrev.2001.81.3.1353 - DOI - PubMed
    1. Bennett V., Gardner K., and Steiner J.P.. 1988. Brain adducin: a protein kinase C substrate that may mediate site-directed assembly at the spectrin-actin junction. J. Biol. Chem. 263:5860–5869. - PubMed
    1. Benz P.M., Blume C., Moebius J., Oschatz C., Schuh K., Sickmann A., Walter U., Feller S.M., and Renné T.. 2008. Cytoskeleton assembly at endothelial cell-cell contacts is regulated by alphaII-spectrin-VASP complexes. J. Cell Biol. 180:205–219. 10.1083/jcb.200709181 - DOI - PMC - PubMed
    1. Benz P.M., Merkel C.J., Offner K., Abeßer M., Ullrich M., Fischer T., Bayer B., Wagner H., Gambaryan S., Ursitti J.A., et al. . 2013. Mena/VASP and αII-Spectrin complexes regulate cytoplasmic actin networks in cardiomyocytes and protect from conduction abnormalities and dilated cardiomyopathy. Cell Commun. Signal. 11:56 10.1186/1478-811X-11-56 - DOI - PMC - PubMed

Publication types