. 2020 Feb 27;7(8):1902130.
doi: 10.1002/advs.201902130. eCollection 2020 Apr.

ATO (Arsenic Trioxide) Effects on Promyelocytic Leukemia Nuclear Bodies Reveals Antiviral Intervention Capacity

Affiliations

ATO (Arsenic Trioxide) Effects on Promyelocytic Leukemia Nuclear Bodies Reveals Antiviral Intervention Capacity

Samuel Hofmann et al. Adv Sci (Weinh). .

Abstract

Human adenoviruses (HAdV) are associated with clinical symptoms such as gastroenteritis, keratoconjunctivitis, pneumonia, hepatitis, and encephalitis. In the absence of protective immunity, as in allogeneic bone marrow transplant patients, HAdV infections can become lethal. Alarmingly, various outbreaks of highly pathogenic, pneumotropic HAdV types have been recently reported, causing severe and lethal respiratory diseases. Effective drugs for treatment of HAdV infections are still lacking. The repurposing of drugs approved for other indications is a valuable alternative for the development of new antiviral therapies and is less risky and costly than de novo development. Arsenic trioxide (ATO) is approved for treatment of acute promyelocytic leukemia. Here, it is shown that ATO is a potent inhibitor of HAdV. ATO treatment blocks virus expression and replication by reducing the number and integrity of promyelocytic leukemia (PML) nuclear bodies, important subnuclear structures for HAdV replication. Modification of HAdV proteins with small ubiquitin-like modifiers (SUMO) is also key to HAdV replication. ATO reduces levels of viral SUMO-E2A protein, while increasing SUMO-PML, suggesting that ATO interferes with SUMOylation of proteins crucial for HAdV replication. It is concluded that ATO targets cellular processes key to HAdV replication and is relevant for the development of antiviral intervention strategies.

Keywords: antivirals; arsenic; human adenoviruses; promyelocytic leukemia nuclear bodies; small ubiquitin‐like modifiers (SUMO).


Conflict of interest statement

The authors declare no conflict of interest.

Figures

Figure 1
Figure 1
ATO efficiently reduces HAdV progeny production. A,B) H1299 cells were infected with HAdV‐C5 wt at a multiplicity of 5 FFU per cell, treated with the depicted concentrations of ATO at 2 h p.i., fixed 48 h p.i. with 4% PFA and double labeled with mAb B6‐8 (α‐E2A) and pAb L133 (α‐capsid). Primary antibodies were detected using Alexa488 (E2A, green) and Alexa568 (capsid, red) conjugated secondary antibodies. A) Representative overview pictures of n = 40 pictures are shown. Scale bar represents 200 µm. B) The number of E2A and capsid expressing cells, respectively, was counted in n = 40 overview pictures, normalized to untreated, infected cells, and represented in bar charts. Bar charts represent average values and standard deviations based on four independent experiments. C) H1299 cells were infected with HAdV‐C5 at a multiplicity of 20 FFU per cell, and treated with the depicted concentrations of ATO at 2 h p.i. Viral particles were harvested 48 h p.i. and virus yield was determined by quantitative E2A immunofluorescence staining in 293 cells. Bar charts represent average values and standard deviations based on three independent experiments. Statistically significant differences were determined using a one‐way ANOVA and Dunnet's T3 test. *p ≤ 0.05, **p ≤ 0.01, ***p ≤ 0.001, ****p ≤ 0.0001.
Figure 2
Figure 2
ATO induces a dose dependent reduction of HAdV infectivity with minor effects on cell viability. A) H1299 cells were infected with HAdV‐C5 wt at a multiplicity of 20 FFU per cell and treated with the depicted concentrations of ATO at 2 h p.i. 24 or 48 h p.i., cell viability was assessed using the Promega CellTiter‐Blue Cell Viability Assay system, prior to fixation with 4% PFA and cells were double labeled with mAb B6‐8 (α‐E2A) and pAb L133 (α‐capsid). Primary antibodies were detected using Alexa488 (E2A, green) and Alexa647 (capsid, red) conjugated secondary antibodies. Fluorescence intensity was measured using a Tecan Infinite 200M plate reader using an excitation and emission wavelength of 488 and 520 nm for Alexa488 and 640 and 670 nm for Alexa647, respectively. Fluorescence intensity was normalized to untreated, infected cells. xy charts represent average values and standard deviations based on three independent experiments measured in triplicates. B) H1299 cells were infected with an HAdV‐C5 delta E3 virus, containing a CMV promoter driven eGFP expression cassette, at a multiplicity of 20 FFU per cell and treated with the depicted concentrations of ATO at 2 h p.i. 24 or 48 h p.i. cell viability was assessed using the Promega CellTiter‐Blue Cell Viability Assay system, and GFP fluorescence intensity was measured using a Tecan Infinite 200M plate reader using an excitation and emission wavelength of 488 and 520 nm. Fluorescence intensity was normalized to untreated, infected cells. xy charts represent average values and standard deviations based on three independent experiments measured in triplicates. C) H1299 cells were infected with an eGFP expressing HAdV‐C5‐based first generation adenoviral vector at a multiplicity of 20 FFU per cell and treated with the depicted concentrations of ATO at 2 h p.i. 24 or 48 h p.i., cell viability was assessed using the Promega CellTiter‐Blue Cell Viability Assay system, and GFP fluorescence intensity was measured using a Tecan Infinite 200M plate reader using an excitation and emission wavelength of 488 and 520 nm. Fluorescence intensity was normalized to untreated, infected cells. xy charts represent average values and standard deviations based on three independent experiments measured in triplicates. D) A549 cells were infected with an HAdV‐C5 delta E3 virus, encoding a CMV promoter driven eGFP expression cassette, at a multiplicity of 20 FFU per cell and treated with the depicted concentrations of ATO at 2 h p.i. GFP‐fluorescence, as well as cell growth via phase‐contrast imaging was assessed for 48 h with a 2 h increment using an IncuCyte S3 Live‐Cell Analysis System. Average fluorescence area (left) and average fluorescence intensity (right) were determined and plotted over the time.
Figure 3
Figure 3
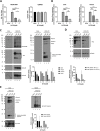
ATO interferes with HAdV gene expression and capsid formation. H1299 cells were infected with HAdV‐C5 wt at a multiplicity of 20 FFU per cell and treated with the depicted concentrations of ATO at 2 h p.i. A) Cells were harvested 24 h p.i., total DNA was isolated and subjected to qPCR using primers specific for the viral e1b coding region. As internal control, primers for GAPDH were used. Bar charts represent average values and standard deviations based on two independent experiments measured in triplicates. B) Cells were harvested 48 h p.i. and total mRNA was isolated using TRIzol, reverse transcribed and quantified by RT‐PCR using primers specific for HAdV E1A and hexon. The data was normalized to the respective 18S mRNA levels. Bar charts represent average values and standard deviations based on two independent experiments measured in triplicates. C) 48 h p.i., proteins from total‐cell protein lysates were separated by SDS‐PAGE and subjected to immunoblotting using mAb 2A‐6 (α‐E1B‐55K), mAb RSA3 (α‐E4orf6), mAb B6‐8 (α‐E2A), mAb6A11 (α‐E4orf3), and pAb L133 (α‐capsid). Relevant proteins are depicted on the right, molecular weights in kDa on the left of each blot, respectively. For quantification of protein expression, densitometric analysis of detected bands was performed using ImageJ (version 1.45s). Relative protein expression was normalized on the respective α‐β‐actin steady state levels. Bar charts represent average values and standard deviations based on three independent experiments. D) Protein lysates from C were separated by SDS‐PAGE and subjected to immunoblotting using pAb NB100‐59787 (α‐PML), and mAb AC‐15 (α‐β‐actin). Relevant proteins are depicted on the right, molecular weights in kDa on the left of each blot, respectively. For quantification of protein expression, densitometric analysis of detected bands was performed using ImageJ (version 1.45s). Relative protein expression was normalized on the respective α‐β‐actin steady‐state levels. Bar charts represent average values and standard deviations based on three independent experiments. E) Cells were lysed using a low stringent NP‐40 lysis buffer. Native lysates were separated by agarose gel electrophoresis and further analyzed by immunoblotting using pAb L133 (α‐capsid). For the determination of protein steady‐state levels, lysates were denatured using Laemmli buffer, separated by SDS‐PAGE, and subjected to immunoblotting using pAb L133 (α‐capsid) and mAb AC‐15 (α‐β‐actin). Relevant proteins are depicted on the right, molecular weights in kDa on the left of each blot, respectively. For quantification of protein expression, densitometric analysis of detected bands was performed using ImageJ (version 1.45s). Relative protein expression was normalized on the respective α‐β‐actin steady‐state levels. Relative capsid levels as detected by NAGE were normalized to input capsid expression levels, as well as the respective α‐β‐actin steady‐state levels. Bar charts represent average values and standard deviations based on three independent experiments. Statistically significant differences were determined using a one‐way ANOVA and Dunnet's T3 test. *p ≤ 0.05, **p ≤ 0.01, ***p ≤ 0.001, ****p ≤ 0.0001.
Figure 4
Figure 4
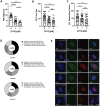
ATO interferes with efficient HAdV replication center formation and reorganization of PML‐NBs. H1299 cells were infected with HAdV‐C5 wt at a multiplicity of 20 FFU per cell, treated with the depicted concentrations of ATO at 2 h p.i., fixed 48 h p.i. with 4% PFA and double labeled with mAb B6‐8 (α‐E2A) and pAb NB100‐59787 (α‐PML). Primary antibodies were detected using Alexa488 (PML, green) and Alexa647 (E2A, red) conjugated secondary antibodies. A) Number of PML‐NBs per cell in uninfected cells was determined using Volocity for at least n = 461 cells from two independent biological replicates. Statistically significant differences were determined using a one‐way ANOVA and Dunnet's T3 test. *p ≤ 0.05, **p ≤ 0.01, ***p ≤ 0.001, ****p ≤ 0.0001. B) The proportion of infected cells showing track‐like redistribution of PML‐NBs was determined by counting for at least n = 212 cells and normalization to untreated infected cells. C) The proportion of infected cells showing formation of HAdV replication centers marked by the viral protein E2A (lower plot) was determined by counting for at least n = 212 cells and normalization to untreated infected cells. D) Cells showing either viral replication centers with PML track‐like structures, replication centers without PML track‐like structures, no replication centers but PML track‐like structures or no replication centers, and no PML track‐like structures were counted for at least n = 214 (virus infected cells due to E2A signal detected: either untreated/0 µm or treated with ATO/1 or 2 µm) and represented in pie charts. Statistically significant differences were determined using a one‐way ANOVA and Dunnet's T3 test. *p ≤ 0.05, **p ≤ 0.01, ***p ≤ 0.001, ****p ≤ 0.0001. E) H1299 cells were infected with HAdV‐C5 wt at a multiplicity of 20 FFU per cell, and treated with 0 or 2 µm of ATO at 2 h p.i. After 48 h, the cells were fixed with 4% PFA and stained using pAb NB100‐59787 (α‐PML) and mAb 6A‐11 (α‐E4orf3). Primary antibodies were detected using Alexa488 (PML, green) and Alexa647 (E4orf3, red) coupled secondary antibodies. Representative staining patterns for at least 30 uninfected cells treated with 0 or 2 µm ATO are shown in panels (a)–(d) and (m)–(p), infected cells treated with 0 or 2 µm ATO are shown in panels (e)–(l) and (q)–(x). Overlays of single fluorescence pictures (merge) are shown in panels (d), (h), (l), (p), (t), and (x). Data corresponds to two independent biological replicates performed and counted by different operators to avoid operator bias. Scale bar represents 10 µm.
Figure 5
Figure 5
ATO highly reduces SUMO2 modification of E2A. A) H1299 cells were transfected with 10 µg of p6xHis‐SUMO2 for 4 h. After transfection, cells were infected with HAdV‐C5 wt at a multiplicity of 20 FFU per cell, treated with 2 µm of ATO and harvested 24 h p.i. Whole‐cell lysates were prepared with guanidinium chloride buffer and subjected to Ni‐NTA purification of 6His‐SUMO2 conjugates. After Ni‐NTA purification, the 6His‐SUMO2 conjugates, as well as proteins from total‐cell protein lysates were separated by SDS‐PAGE and subjected to immunoblotting using mAb B6‐8 (α‐E2A), mAb 6His (α‐6xHis‐tag), and mAb AC‐15 (α‐β‐actin). Relevant proteins are depicted on the right, molecular weights in kDa on the left of each blot, respectively. B) For quantification of protein expression, densitometric analysis of detected bands was performed using ImageJ (version 1.45s). Relative protein expression was normalized on the respective α‐β‐actin steady‐state levels. The degree of E2A SUMO2 modification was further normalized on E2A steady‐state levels. Bar charts represent average values and standard deviations based on three independent experiments.
Figure 6
Figure 6
Proposed mode of action of ATO during HAdV infection. Based on our data, we hypothesize, that ATO interferes with the HAdV characteristic reorganization of PML‐NBs into track‐like structures, as well as with efficient formation of viral replication centers, probably by interference with E2A SUMOylation, which ultimately results in a reconstitution of PML‐NBs and inhibition of HAdV replication.

Similar articles

Cited by

References

    1. Berget S. M., Moore C., Sharp P. A., Proc. Natl. Acad. Sci. USA 1977, 74, 3171. - PMC - PubMed
    1. Chow L. T., Gelinas R. E., Broker T. R., Roberts R. J., Cell 1977, 12, 1. - PubMed
    1. San Martin C., Viruses 2012, 4, 847. - PMC - PubMed
    1. Saha B., Wong C. M., Parks R. J., Viruses 2014, 6, 3563. - PMC - PubMed
    1. Ginn S. L., Alexander I. E., Edelstein M. L., Abedi M. R., Wixon J., J. Gene Med. 2013, 15, 65. - PubMed

LinkOut - more resources