Initiation of X Chromosome Inactivation during Bovine Embryo Development
- PMID: 32325818
- PMCID: PMC7226380
- DOI: 10.3390/cells9041016
Initiation of X Chromosome Inactivation during Bovine Embryo Development
Abstract
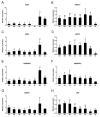
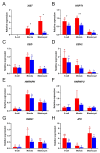
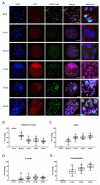
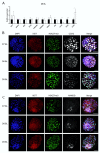
X-chromosome inactivation (XCI) is a developmental process that aims to equalize the dosage of X-linked gene products between XY males and XX females in eutherian mammals. In female mouse embryos, paternal XCI is initiated at the 4-cell stage; however, the X chromosome is reactivated in the inner cell mass cells of blastocysts, and random XCI is subsequently initiated in epiblast cells. However, recent findings show that the patterns of XCI are not conserved among mammals. In this study, we used quantitative RT-PCR and RNA in situ hybridization combined with immunofluorescence to investigate the pattern of XCI during bovine embryo development. Expression of XIST (X-inactive specific transcript) RNA was significantly upregulated at the morula stage. For the first time, we demonstrate that XIST accumulation in bovine embryos starts in nuclei of female morulae, but its colocalization with histone H3 lysine 27 trimethylation was first detected in day 7 blastocysts. Both in the inner cell mass and in putative epiblast precursors, we observed a proportion of cells with XIST RNA and H3K27me3 colocalization. Surprisingly, the onset of XCI did not lead to a global downregulation of X-linked genes, even in day 9 blastocysts. Together, our findings confirm that diverse patterns of XCI initiation exist among developing mammalian embryos.
Keywords: H3K27me3; XCI; XIST; bovine; embryo; inner cell mass.
Conflict of interest statement
The authors declare no conflict of interest.
Figures

Similar articles
-
Eutherian mammals use diverse strategies to initiate X-chromosome inactivation during development.Nature. 2011 Apr 21;472(7343):370-4. doi: 10.1038/nature09872. Epub 2011 Apr 6. Nature. 2011. PMID: 21471966
-
No imprinted XIST expression in pigs: biallelic XIST expression in early embryos and random X inactivation in placentas.Cell Mol Life Sci. 2019 Nov;76(22):4525-4538. doi: 10.1007/s00018-019-03123-3. Epub 2019 May 28. Cell Mol Life Sci. 2019. PMID: 31139846 Free PMC article.
-
Genomic imprinting of Xist by maternal H3K27me3.Genes Dev. 2017 Oct 1;31(19):1927-1932. doi: 10.1101/gad.304113.117. Genes Dev. 2017. PMID: 29089420 Free PMC article.
-
Regulation of X-chromosome inactivation in development in mice and humans.Microbiol Mol Biol Rev. 1998 Jun;62(2):362-78. doi: 10.1128/MMBR.62.2.362-378.1998. Microbiol Mol Biol Rev. 1998. PMID: 9618446 Free PMC article. Review.
-
Concise review: Pluripotency and the transcriptional inactivation of the female Mammalian X chromosome.Stem Cells. 2012 Jan;30(1):48-54. doi: 10.1002/stem.755. Stem Cells. 2012. PMID: 21997775 Free PMC article. Review.
Cited by
-
Compensation of gene dosage on the mammalian X.Development. 2024 Aug 1;151(15):dev202891. doi: 10.1242/dev.202891. Epub 2024 Aug 14. Development. 2024. PMID: 39140247 Free PMC article. Review.
-
Biological Function of Long Non-coding RNA (LncRNA) Xist.Front Cell Dev Biol. 2021 Jun 10;9:645647. doi: 10.3389/fcell.2021.645647. eCollection 2021. Front Cell Dev Biol. 2021. PMID: 34178980 Free PMC article. Review.
-
Silencing XIST on the future active X: Searching human and bovine preimplantation embryos for the repressor.Eur J Hum Genet. 2024 Apr;32(4):399-406. doi: 10.1038/s41431-022-01115-9. Epub 2022 May 19. Eur J Hum Genet. 2024. PMID: 35585273
-
Long noncoding RNAs (lncRNAs) in HIV-mediated carcinogenesis: Role in cell homeostasis, cell survival processes and drug resistance.Noncoding RNA Res. 2022 Jul 31;7(3):184-196. doi: 10.1016/j.ncrna.2022.07.003. eCollection 2022 Sep. Noncoding RNA Res. 2022. PMID: 35991514 Free PMC article. Review.
-
Dysregulated Gene Expression of Imprinted and X-Linked Genes: A Link to Poor Development of Bovine Haploid Androgenetic Embryos.Front Cell Dev Biol. 2021 Mar 18;9:640712. doi: 10.3389/fcell.2021.640712. eCollection 2021. Front Cell Dev Biol. 2021. PMID: 33869192 Free PMC article.
References
Publication types
MeSH terms
Substances
LinkOut - more resources
Full Text Sources

