. 2020 Apr 3:13:56.
doi: 10.3389/fnmol.2020.00056. eCollection 2020.

Nystatin Regulates Axonal Extension and Regeneration by Modifying the Levels of Nitric Oxide

Affiliations

Nystatin Regulates Axonal Extension and Regeneration by Modifying the Levels of Nitric Oxide

Cristina Roselló-Busquets et al. Front Mol Neurosci. .

Abstract

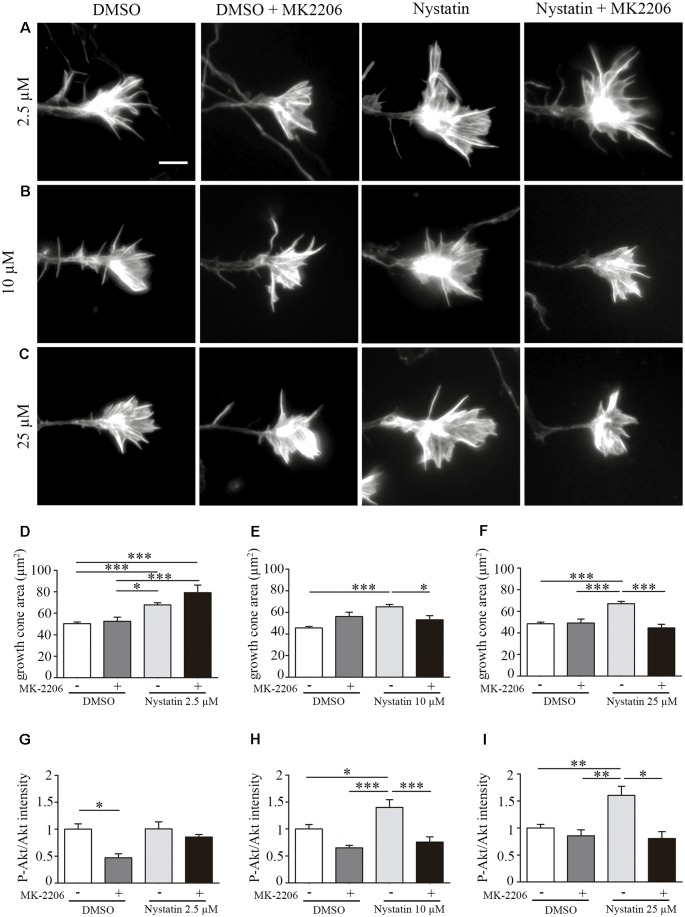
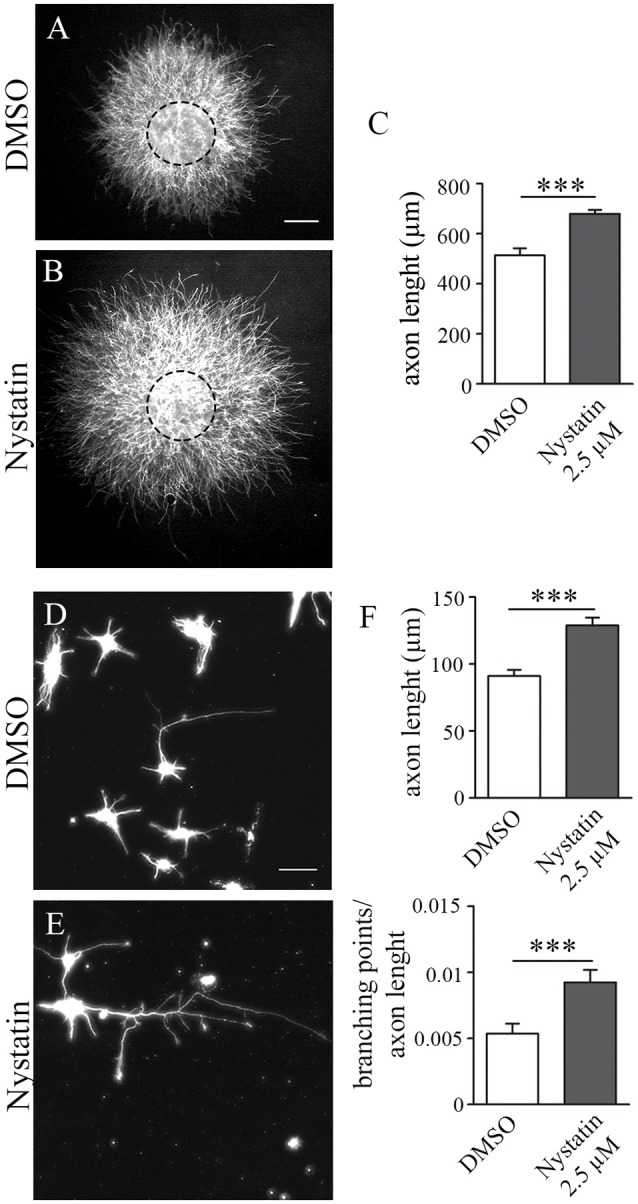
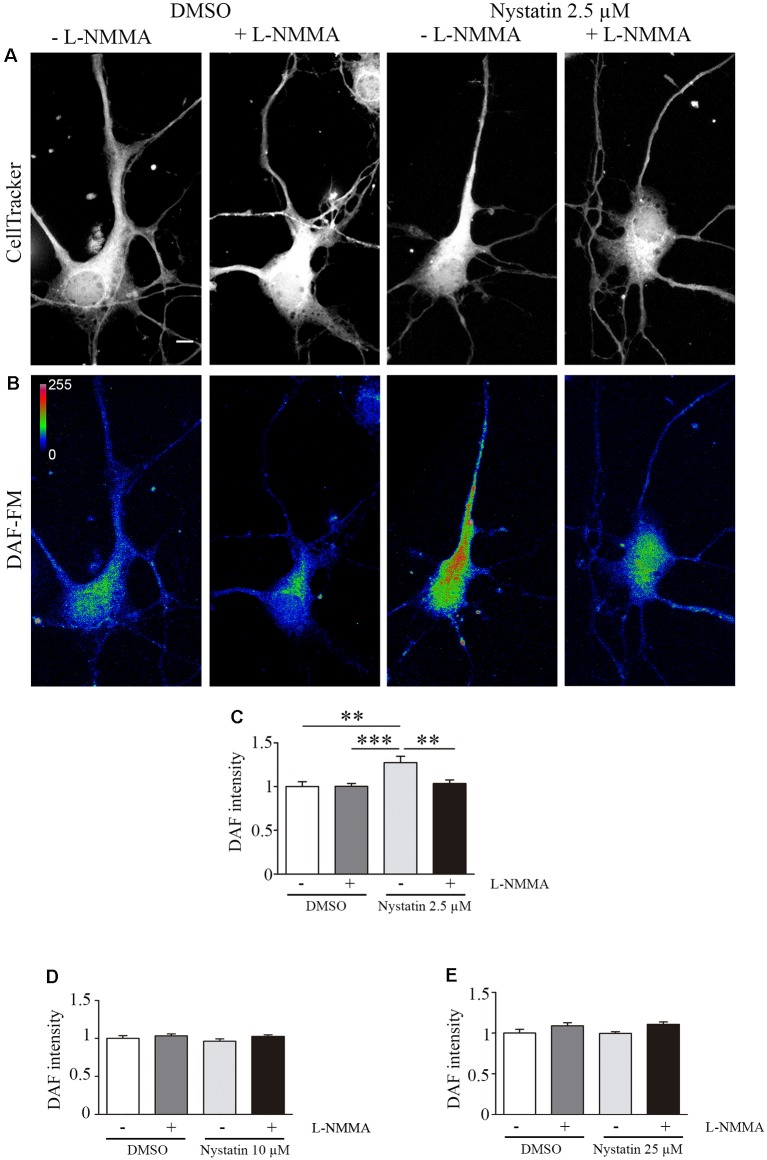
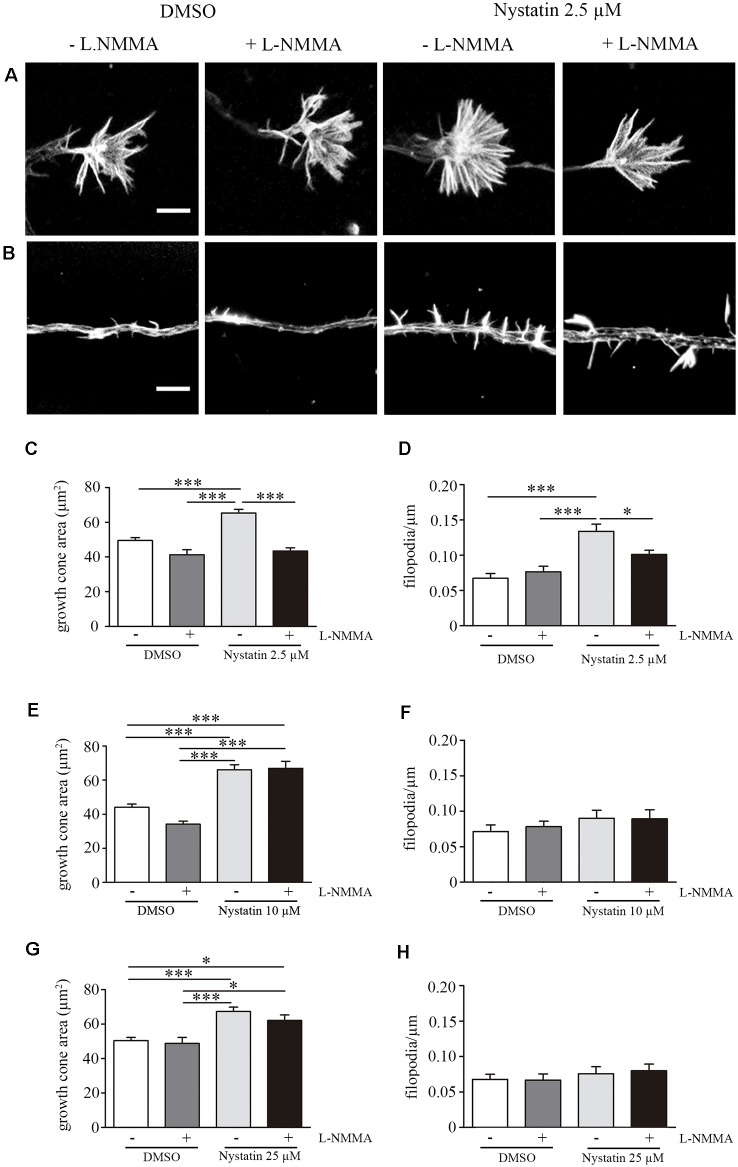
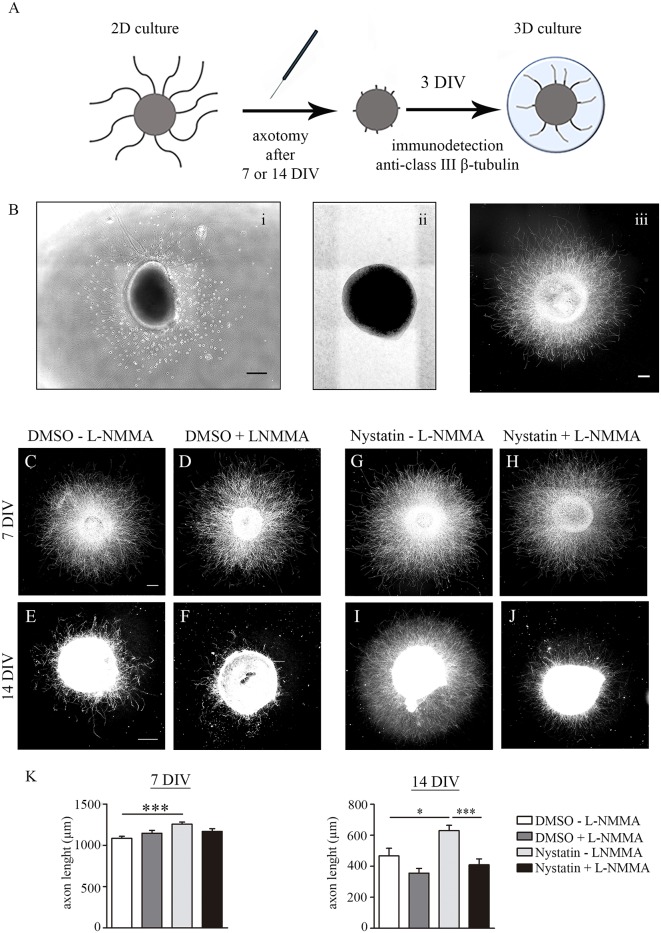
Nystatin is a pharmacological agent commonly used for the treatment of oral, mucosal and cutaneous fungal infections. Nystatin has also been extensively applied to study the cellular function of cholesterol-enriched structures because of its ability to bind and extract cholesterol from mammalian membranes. In neurons, cholesterol level is tightly regulated, being essential for synapse and dendrite formation, and axonal guidance. However, the action of Nystatin on axon regeneration has been poorly evaluated. Here, we examine the effect of Nystatin on primary cultures of hippocampal neurons, showing how acute dose (minutes) of Nystatin increases the area of growth cones, and chronic treatment (days) enhances axon length, axon branching, and axon regeneration post-axotomy. We describe two alternative signaling pathways responsible for the observed effects and activated at different concentrations of Nystatin. At elevated concentrations, Nystatin promotes growth cone expansion through phosphorylation of Akt; whereas, at low concentrations, Nystatin enhances axon length and regrowth by increasing nitric oxide levels. Together, our findings indicate new signaling pathways of Nystatin and propose this compound as a novel regulator of axon regeneration.

Keywords: axon growth; axon regrowth post-axotomy; growth cone; nitric oxide synthase; nystatin.


Figures

Figure 1
Figure 1
Acute incubation with different concentrations of Nystatin increases the growth cone size of hippocampal neurons. Representative images of growth cones from hippocampal neurons cultured during 3 DIV and incubated with control medium (DMSO; A–C) or Nystatin at 2.5 μM (D), 10 μM (E) and 25 μM (F) for 30 min. Growth cone area quantification for each treatment (G). Neuronal actin was stained incubating cells with phalloidin-TRITC (1 μg/ml) for 30 min. Data shows mean ± SEM. n = 80–120 neurons in each condition. Two-tailed, unpaired Student’s t-test was performed. **p < 0.01, ***p < 0.001. Scale bar 5 μm.
Figure 2
Figure 2
Dose-specific Nystatin effect to Akt phosphorylation. Western blots from E16 cortex primary cell cultures, cultured during 3 DIV and incubated with control medium (DMSO) or Nystatin 2.5 μM, 10 μM or 25 μM for 30 min. P-Akt and Akt were detected (A). The ratio of P-Akt/Akt was quantified with Gelpro software. n = 3 neuronal extracts in each condition. Two-tailed, unpaired Student’s t-test was performed (B). Representative images of hippocampal growth cones treated with Nystatin at the doses described above, stained with phalloidin and labeled against P-Akt (C). Quantification of the relative P-Akt intensity in the growth cones and neuronal cell bodies (D). Data shows mean ± SEM. n = 30–50 neurons in each condition. Two-tailed, unpaired Student’s t-test was performed. *p < 0.05, ***p < 0.001. Scale bar 5 μm.
Figure 3
Figure 3
Effect on growth cone size by high concentrations of Nystatin requires Akt phosphorylation. Representative images of growth cones from hippocampal neurons cultured during 3 DIV and incubated with Nystatin at 2.5 μM (A), 10 μM (B) and 25 μM (C) for 30 min in the presence or not of Akt inhibitor MK-2206. Growth cone area quantification for each treatment (D–F). Neuronal actin was stained incubating cells with phalloidin-TRITC (1 μg/ml) for 30 min. Immunocytochemistry quantification of the ratio of P-Akt/Akt in growth cones for each treatment (G–I). Data shows mean ± SEM. n = 20–30 neurons for Akt intensity and 150–200 neurons for growth cone area in each condition. One-way ANOVA, Tukey’s multiple comparison test; *p < 0.05, **p < 0.01, ***p < 0.001. Scale bar 5 μm.
Figure 4
Figure 4
Chronic treatment of Nystatin increases axon length and branching in hippocampal neurons. Representative images of hippocampal explants cultured inside a collagen matrix (A,B) or dissociated neurons (D,E), cultured in the presence of DMSO control media (A,D) or 2.5 μM Nystatin (B,E) for 3 DIV. Axon length quantification from explants (C) or dissociated neurons (F, upper graph). Quantification of the density of branching points in the axon (F, lower graph). Neuronal class III β-tubulin was immunoassayed to identify axons and measure their length. Data shows mean ± SEM. n = 15–20 explants, 200 neurons in each condition. Two-tailed, unpaired Student’s t-test was performed ***p < 0.001. Scale bar 250 μm (A,B), 50 μm (D,E).
Figure 5
Figure 5
Nystatin increases nitric oxide production in hippocampal neurons. Representative images of hippocampal neurons stained with CellTracker™ Dye (A) and DAF-FM (B) to detect nitric oxide production under the presence of DMSO control conditions (± the NOS inhibitor L-NMMA) or 2.5 μM Nystatin (± the NOS inhibitor L-NMMA) incubated during 30 min. Images in (B) are shown in a pseudo-color scale where magenta color indicates high levels of NO and blue color indicates low levels of NO. DAF-FM intensity was quantified in each condition and presented relative to the DMSO control condition (C). Similarly, DAF-FM intensity was also quantified for neurons treated with 10 μM Nystatin (D) or 25 μM Nystatin (E) and presented relative to DMSO control condition. Data shows mean ± SEM. For each condition, n = 20–30 neurons were used for DAF intensity, n = 150–200 growth cones (one per neuron) for growth cone area, and n = 40–60 axons for filopodia density. One-way ANOVA, Tukey’s multiple comparison test; **p < 0.01, ***p < 0.001. Scale bar 5 μm.
Figure 6
Figure 6
Acute treatment of Nystatin increases growth cone and filopodia density trough nitric oxide production. Representative images of growth cones (A) and filopodia (B) treated during 30 min with DMSO (± L-NMMA) or 2.5 μM Nystatin (± L-NMMA). Quantification of growth cone area (C) and filopodia density (D) for each treatment under DMSO or 2.5 μM Nystatin. Similarly, growth cone area (E,G) and filopodia density (F,H) were also quantified for neurons treated with 10 μM Nystatin (E,F) or 25 μM Nystatin (G,H). Neuronal actin was used to identify growth cone morphology and axon filopodia. Actin was stained by incubating cells with phalloidin-TRITC (1 μg/ml) for 30 min. Data shows mean ± SEM. n = 20–30 neurons in each condition. One-way ANOVA’s multiple comparison test; *p < 0.05, ***p < 0.001. Scale bar 5 μm.
Figure 7
Figure 7
Chronic treatment of Nystatin increases axon regeneration through nitric oxide production. Scheme of axotomy procedure (A). Representative bright-field images of explants before axotomy (Bi) and immediately after axotomy (Bii). Representative immunofluorescence image of an explant 3 days after axotomy (Biii). Scale bar 200 μm. Representative images of hippocampal explants axotomized after 7 DIV or 14 DIV and regrowth for three additional days inside a collagen matrix in control medium (C–F) or 2.5 μM Nystatin (G–J), and without the NOS inhibitor L-NMMA (C,E,G,I) or with the NOS inhibitor L-NMMA (D,F,H,J). Neuronal class III β-tubulin was immunoassayed to identify axons and measure their length. Quantification of explant axon length (K). Data shows mean ± SEM. n = 25–30 explants in each condition. One-way ANOVA, Tukey’s multiple comparison test; *p < 0.05, ***p < 0.001. Scale bar 250 μm.

Similar articles

Cited by

References

    1. Berry M., Ahmed Z., Morgan-Warren P., Fulton D., Logan A. (2016). Prospects for mTOR-mediated functional repair after central nervous system trauma. Neurobiol. Dis. 85, 99–110. 10.1016/j.nbd.2015.10.002 - DOI - PubMed
    1. Blanquie O., Bradke F. (2018). Cytoskeleton dynamics in axon regeneration. Curr. Opin. Neurobiol. 51, 60–69. 10.1016/j.conb.2018.02.024 - DOI - PubMed
    1. Bolard J. (1986). How do the polyene macrolide antibiotics affect the cellular membrane properties? Biochim. Biophys. Acta 864, 257–304. 10.1016/0304-4157(86)90002-x - DOI - PubMed
    1. Bradke F., Fawcett J. W., Spira M. E. (2012). Assembly of a new growth cone after axotomy: the precursor to axon regeneration. Nat. Rev. Neurosci. 13, 183–193. 10.1038/nrn3176 - DOI - PubMed
    1. Cooke R. M., Mistry R., Challiss R. A. J., Straub V. A. (2013). Nitric oxide synthesis and cGMP production is important for neurite growth and synapse remodeling after axotomy. J. Neurosci. 33, 5626–5637. 10.1523/JNEUROSCI.3659-12.2013 - DOI - PMC - PubMed

LinkOut - more resources