. 2020 Apr 21;11(1):1921.
doi: 10.1038/s41467-020-15593-2.

A Cdc42-mediated supracellular network drives polarized forces and Drosophila egg chamber extension

Affiliations

A Cdc42-mediated supracellular network drives polarized forces and Drosophila egg chamber extension

Anna Popkova et al. Nat Commun. .

Abstract

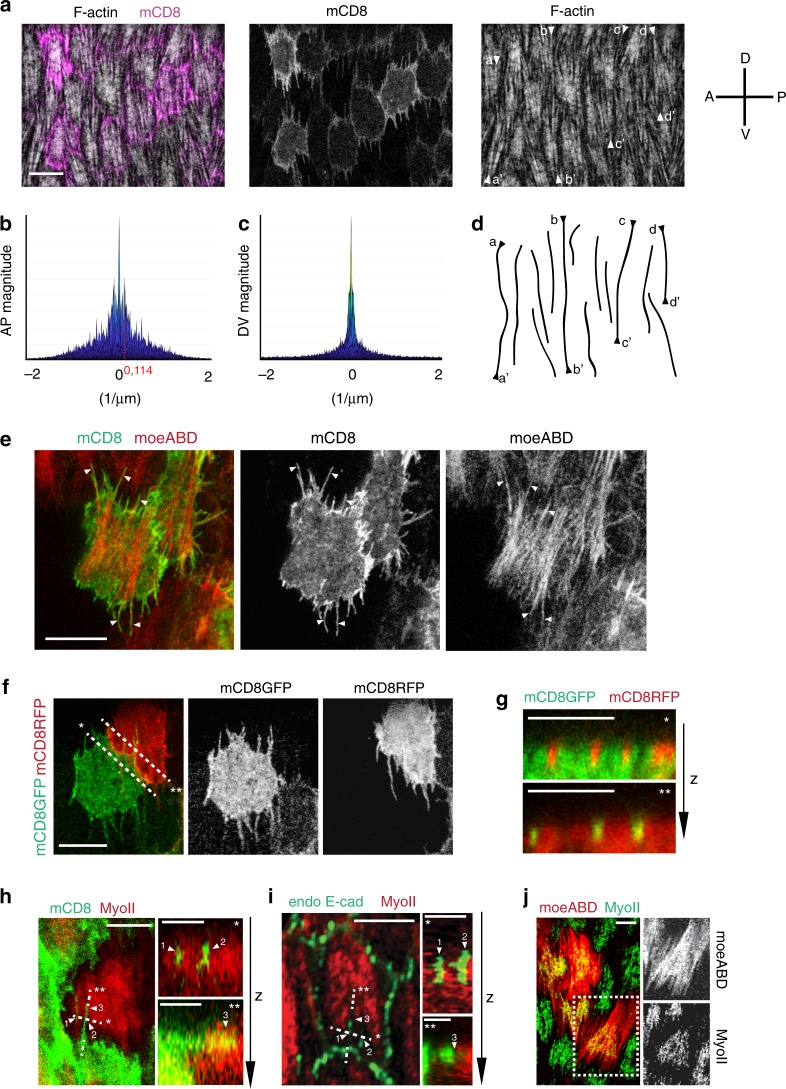
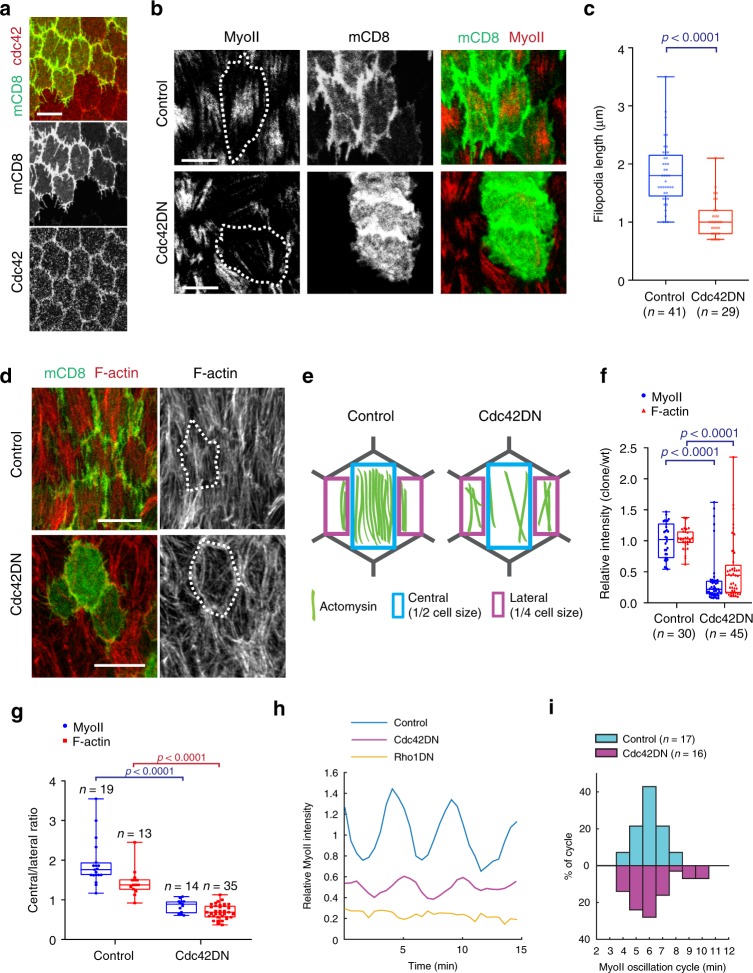
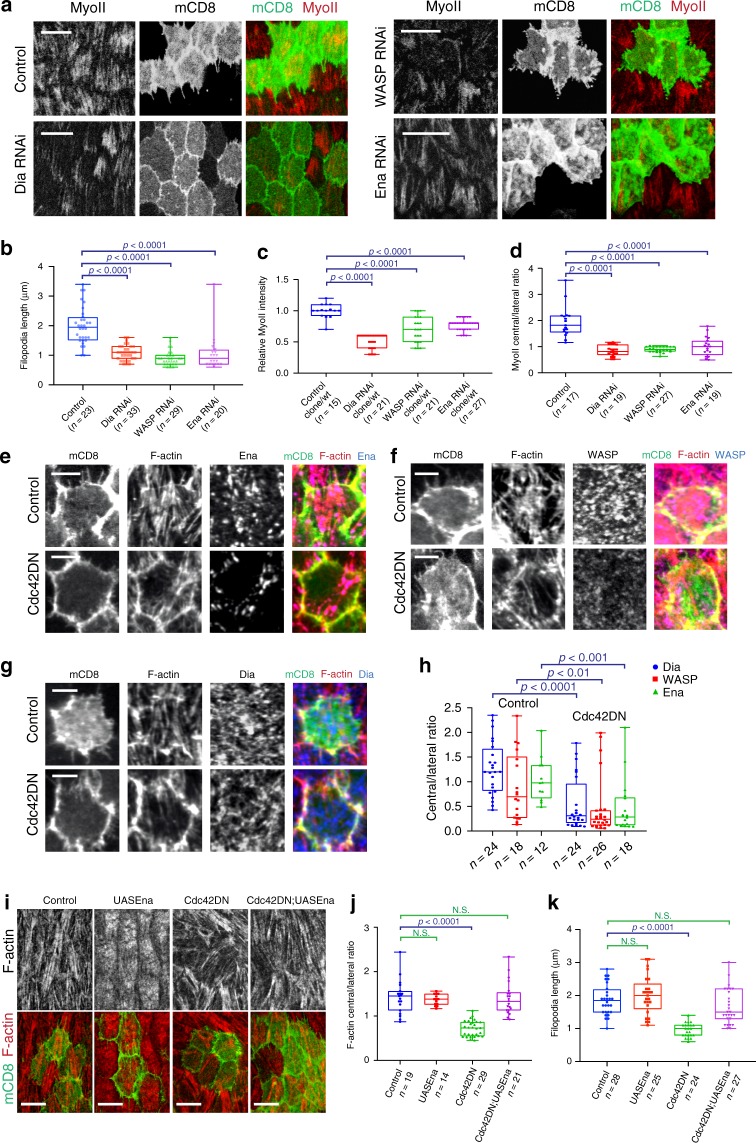
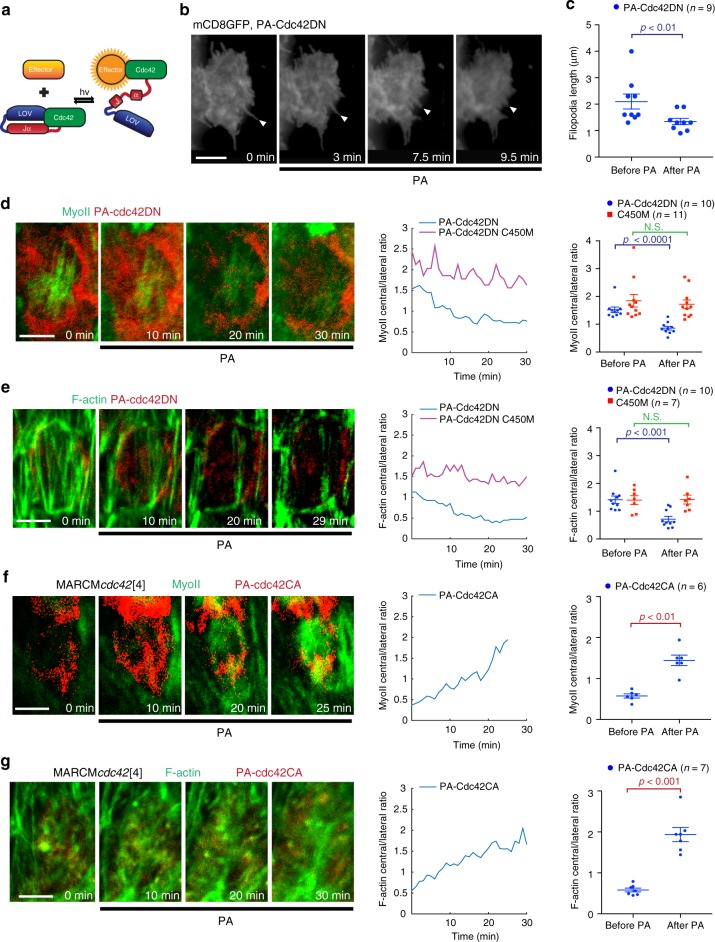
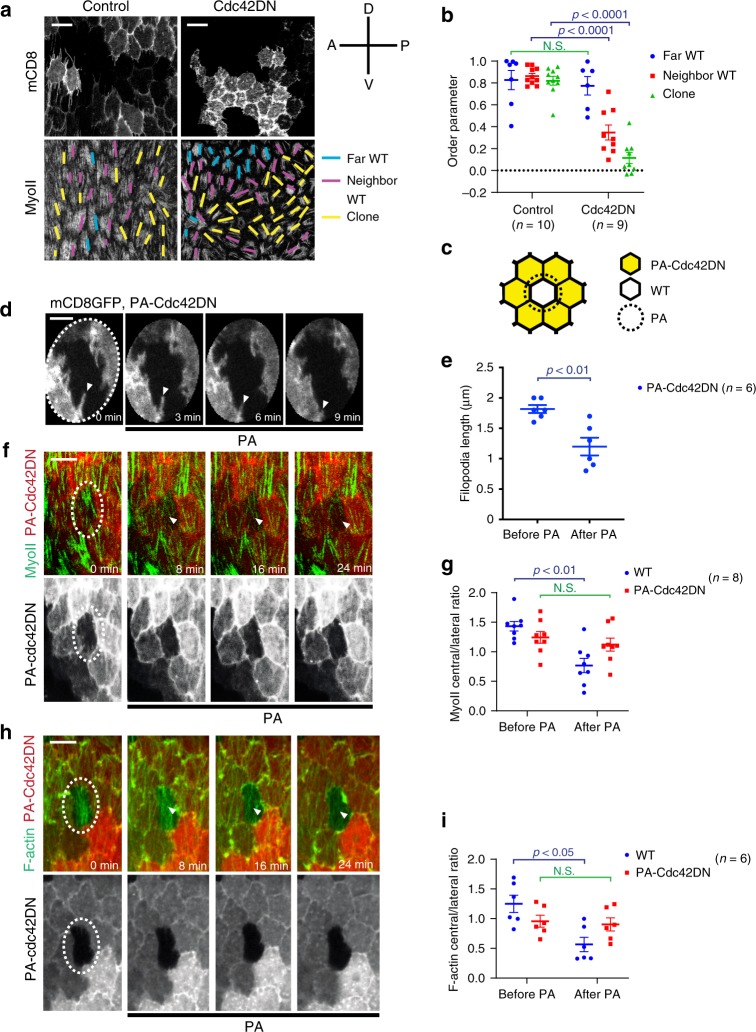
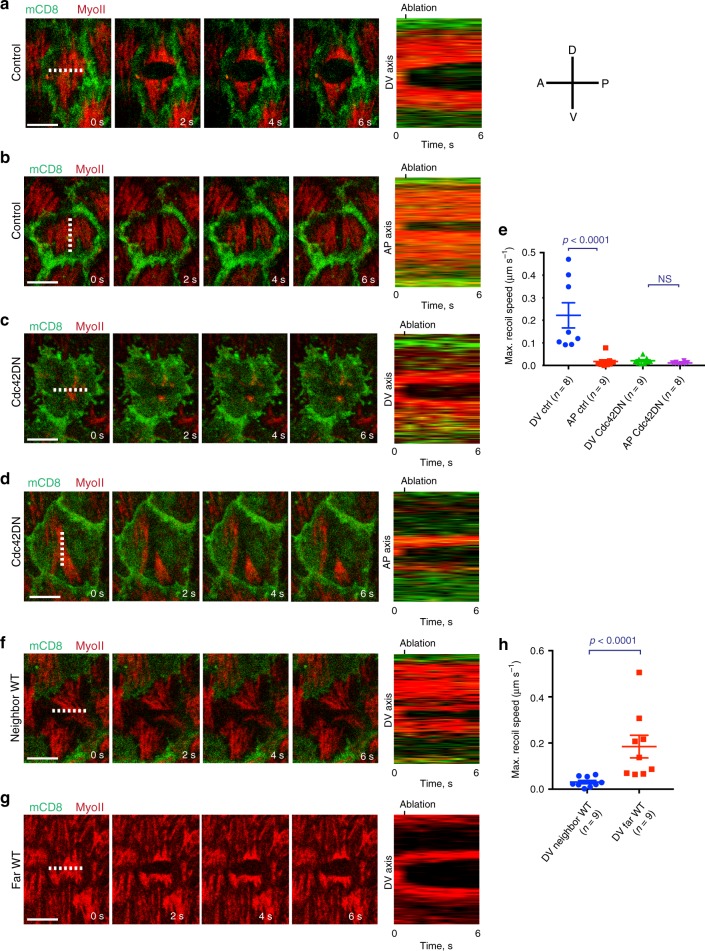
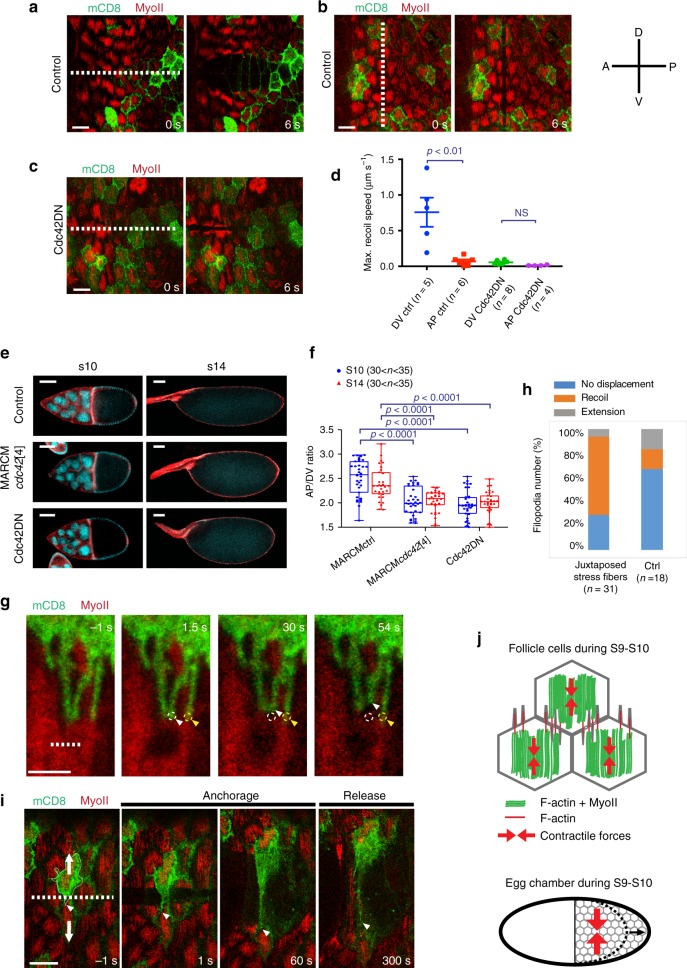
Actomyosin supracellular networks emerge during development and tissue repair. These cytoskeletal structures are able to generate large scale forces that can extensively remodel epithelia driving tissue buckling, closure and extension. How supracellular networks emerge, are controlled and mechanically work still remain elusive. During Drosophila oogenesis, the egg chamber elongates along the anterior-posterior axis. Here we show that a dorsal-ventral polarized supracellular F-actin network, running around the egg chamber on the basal side of follicle cells, emerges from polarized intercellular filopodia that radiate from basal stress fibers and extend penetrating neighboring cell cortexes. Filopodia can be mechanosensitive and function as cell-cell anchoring sites. The small GTPase Cdc42 governs the formation and distribution of intercellular filopodia and stress fibers in follicle cells. Finally, our study shows that a Cdc42-dependent supracellular cytoskeletal network provides a scaffold integrating local oscillatory actomyosin contractions at the tissue scale to drive global polarized forces and tissue elongation.


Conflict of interest statement

The authors declare no competing interests.

Figures

Fig. 1
Fig. 1. Supracellular actin stress fibers emerge from interdigitating filopodia.
a Basal view of follicle cells at stage 10A (S10A), with stochastic induction of mCD8GFP expression (magenta). F-actin is marked by phalloidin staining. A-P and D-V indicate the anterior-posterior and ventral-dorsal axes. Arrow heads indicate the extremities of supracellular F-actin fiber patterns. b, c Fourier analysis of F-actin distribution along the AP (b) and DV (c) axes. d Lines corresponding to the supracellular F-actin fiber patterns indicated in a. e Basal view of follicle clone cells co-expressing mCD8GFP and moeABD-mCherry. Arrow heads indicate filopodia that radiate from the medial-basal stress fiber network. f Basal view of two follicle clone cells in contact, one marked with mCD8GFP and the other with mCD8RFP showing filopodia interdigitating. g Cross-sections of cells along the two dashed lines shown in f: filopodia marked by mCD8RFP insert into the mCD8GFP-expressing cell (*, top panel); filopodia marked by mCD8GFP insert into the mCD8RFP-expressing cell (**, bottom panel). The z-axis indicates the basal to apical direction. h Left panel: close-up view of intercellular filopodia from follicle clone cells with stochastic expression of mCD8GFP (green). MyoII (red) is visualized by using a MyoII-mCherry construct. Right panels: cross-sections along the two dashed lines indicated in the left panel showing filopodia penetrating the actomyosin cortex of the neighboring cell. The z-axis indicates the basal to apical direction. i Left panel: close-up view of follicle cells marked by MyoII-mCherry (red) and E-caderin-GFP (endo E-cad, green). Right panels: cross-sections along the two dashed lines indicated in the left panel showing filopodia penetrating the actomyosin cortex of a neighboring cell. The z-axis indicates the basal to apical direction. j Left panel: basal view of follicle cells, labeled with moeABD-mCherry and MyoII-GFP. Right panels: moeABD and MyoII shown separately. Scale bars are 10 μm in a, e, f, 5 μm in h left panel, i left panel, g and j, 2 μm in h right panels and i right panels. The results shown in a, ej have been successfully repeated from the at least four independent experiments.
Fig. 2
Fig. 2. Cdc42 activity controls intercellular filopodia and stress fiber formation at the basal domain of follicle cells.
a Basal view of follicle cells at stage 10A (S10A): Cdc42-mCherry (red) and stochastic clone expression of mCD8GFP (green). b Basal views of follicle cell clones not expressing (top panels) and expressing (bottom panels) the Cdc42DN transgene marked by mCD8GFP coexpression. MyoII is visualized using a MyoII-mCherry construct (Sqh::Sqh-mCherry). c Average filopodia length per cell for the n individual follicle cells not expressing (control, only mCD8GFP-expressing) and expressing Cdc42DN. For each analyzed individual cell, all filopodia not <0.5 µm were measured (3–11 filopodia per cell for control and 2–7 filopodia per cell for Cdc42DN). Nine egg chambers were analyzed for control and five for Cdc42DN. p < 0.0001 by two-sided Mann–Whitney test. d Basal view of follicle cell clones not expressing (control, only mCD8GFP expressing, top panels) and expressing (bottom panels) the Cdc42DN transgene, marked by mCD8GFP coexpression. F-actin is marked by phalloidin staining. The results shown in a, b, d have been successfully repeated from the at least four independent experiments. e Schematic representation of the actomyosin distribution at the basal side of follicle cells in control and Cdc42DN-expressing backgrounds. f Relative (clone/wild type) MyoII and F-actin intensities in the n individual control (only mCD8GFP expressing) and Cdc42DN cells. p < 0.0001 by two-sided Mann–Whitney test. g Relative (central/lateral) distribution of MyoII and F-actin intensity in the n individual control (only mCD8GFP expressing) and Cdc42DN cells. p < 0.0001 by two-sided Mann–Whitney test. In c, f, g boxes extend from the 25th to 75th percentiles, the mid line represents the median and the whiskers indicate the maximum and the minimum values. h MyoII-mCherry intensity over time for a representative cell in the control (only mCD8GFP expressing), Cdc42DN and Rho1DN backgrounds. The average MyoII intensity in the control background is set to 1. i Percentage of oscillating cycle time periods in the n individual control (only mCD8GFP expressing) and Cdc42DN-expressing cells. Scale bars are 10 µm in a, b, d.
Fig. 3
Fig. 3. Filopodia and stress fibers are under the control of Cdc42 downstream effectors.
a Basal view of follicle cells showing Dia RNAi, WASP RNAi and Enabled RNAi clones marked with mCD8GFP coexpression. MyoII is visualized by using a MyoII-mCherry construct. b Average filopodia length per cell for the n individual cells (from at least four egg chambers) in the indicated genetic backgrounds. For all comparisons, p < 0.0001 by two-sided Mann–Whitney test. c Relative (clone/wild type) MyoII intensity in the n individual cells under the indicated genetic backgrounds. For all comparisons, p < 0.0001 by two-sided Mann–Whitney test. d Relative (central/lateral) distribution of MyoII intensity in the n individual cells under the indicated genetic backgrounds. For all comparisons, p < 0.0001 by two-sided Mann–Whitney test. eg Representative confocal micrographs showing Enabled (e), WASP (f), and Dia (g) at LS9 in a cell not expressing (control, only mCD8GFP expressing) or expressing the Cdc42DN transgene marked by mCD8GFP coexpression. F-actin is marked by phalloidin staining. The results shown in eg have been successfully repeated from the at least four independent experiments. h Relative (central/lateral) distribution of downstream effectors in the n individual control (only mCD8GFP expressing) and Cdc42DN-expressing cells. For Dia signal comparison: p < 0.0001; for WASP signal comparison: p = 0.0032; for Enabled signal comparison: p = 0.0009; all by two-sided Mann–Whitney test. i Basal view of follicle cell clones expressing the indicated transgenes marked by mCD8GFP coexpression. F-actin is marked by phalloidin staining. j Relative (central/lateral) distribution of F-actin intensity in the n individual cells under the indicated genetic backgrounds. For the control vs. UAS-Enabled comparison: p = 0.6197; for the control vs. Cdc42DN comparison: p < 0.0001; for the control vs. Cdc42DN/UAS-Enabled comparison: p = 0.6628; all by two-sided Mann–Whitney test. k Average filopodia length per cell for the n individual follicle cells (from at least three egg chambers) in the indicated genetic backgrounds. For the control vs. UAS-Enabled comparison: p = 0.3191; for the control vs. Cdc42DN comparison: p < 0.0001; for the control vs. Cdc42DN/UAS-Enabled comparison: p = 0.0841; all by two-sided Mann–Whitney test. Scale bars are 10 μm in a, i, and 5 μm in eg. In bd, h, j, k boxes extend from the 25th to 75th percentiles, the mid line represents the median and the whiskers indicate the maximum and the minimum values.
Fig. 4
Fig. 4. Optogenetics reveal specific spatial and temporal control of Cdc42.
a Schematic diagram showing the mechanism of PA-Cdc42 photoactivation by blue light (hv). b, d, e, f, g. Time-lapse series of representative mCherry-tagged PA-Cdc42DN-expressing (b, d, e) and mCherry-tagged PA-Cdc42CA-expressing follicle cell with cdc42[4] mutant genetic background (f, g), labeled with mCD8GFP (b), MyoII-GFP (d, f) and UtrABD-GFP (e, g). PA indicates the time of photoactivation. Arrow heads indicate filopodia in b. c Average filopodia length per cell (from seven egg chambers) in the n individual PA-Cdc42DN clone cells before and 10–15 min after photoactivation. p = 0.0099 by two-sided Mann–Whitney test. d, e, f, g (central panel). Relative (central/lateral) distribution over time of MyoII (d, f) and F-actin (e, g) for a representative case in the indicated genetic backgrounds. d, e, f, g (right panel). Relative (central/lateral) distribution of MyoII (d, f) and F-actin (e, g) before and 25–30 min after photoactivation in the n individual cells under the indicated genetic backgrounds. For MyoII signal, the PA-Cdc42DN before- vs. after- photoactivation comparison: p < 0.0001, the PA-Cdc42DN C450M before- and after- photoactivation comparison: p = 0.7107; for F-actin signal, the PA-Cdc42DN before- vs. after- photoactivation comparison: p = 0.0005, the PA-Cdc42DN C450M before- and after- photoactivation comparison: p = 0.972; for MyoII signal, the PA-Cdc42CA before- vs. after- photoactivation comparison: p = 0.0022; for F-actin signal, the PA-Cdc42CA before- vs. after- photoactivation comparison: p = 0.0006; all by two-sided Mann–Whitney test. Data are presented as mean values +/− SEM. Scale bars are 5 μm in b, d, e, f, g.
Fig. 5
Fig. 5. Cdc42 has a non-cell autonomous role in stress fiber organization.
a Micrographs showing follicle cell clones not expressing (left panels) and expressing (right panels) the Cdc42DN transgene marked by mCD8GFP coexpression. MyoII is visualized by using a MyoII-mCherry construct. Yellow lines, purple lines and blue lines mark the orientation of the basal stress fibers in the clone cells, in the wild-type cells that neighbor clone cells and in the wild-type cells that are not neighboring the clone cells, respectively. A-P and D-V indicate the anterior-posterior and ventral-dorsal axes. b Order parameter for the three types of follicle cells indicated from the n egg chambers not expressing (control, only mCD8GFP expressing) and expressing the Cdc42DN transgene. For the far WT comparison: p = 0.5338; for the neighbor WT comparison: p < 0.0001; for the clone comparison: p < 0.0001; all by two-sided Mann–Whitney test. c Schematic diagram showing the region of photoactivation (PA, dashed circle) in experiments where one wild-type cell is surrounded by PA-Cdc42DN-expressing clones. Only the sub-basal cell–cell contact zones of PA-Cdc42DN clones facing the wild-type cells are photoactivated. d, f, h Time-lapse series showing the experiment represented in c for PA-Cdc42DN-expressing clonal cells labeled with mCD8GFP (d), MyoII-GFP (f), and UtrABD-GFP (h), respectively. Dashed ellipses indicate the photoactivated region. Arrow heads indicate filopodia in d and medial-basal regions in f, h. e Average filopodia length per cell (from four egg chambers) measured before and 10–15 min after photoactivation in the n individual cells of the experiments represented in c and d. p = 0.0065 by two-sided Mann–Whitney test. g, i Relative (central/lateral) distribution of MyoII (g) and F-actin (i) in the n individual wild-type and PA-Cdc42DN-expressing cells before and 20–30 min after photoactivation as shown in c. For relative distribution of MyoII signal, the WT before- vs. after- photoactivation comparison: p = 0.0011, the PA-Cdc42DN before- vs. after- photoactivation comparison: p = 0.3282; for relative distribution of F-actin signals, the WT before- vs. after- photoactivation comparison: p = 0.0108, the PA-Cdc42DN before- vs. after- photoactivation comparison: p = 0.6991; all by two-sided Mann–Whitney test. Data are presented as mean values +/− SEM. Scale bars are 10 μm in a, f, h and 5 μm in d.
Fig. 6
Fig. 6. Cortical tension anisotropy is under the control of Cdc42.
ad Time-lapse series of a representative cell not expressing (a, b) and expressing (c, d) the Cdc42DN transgene marked by mCD8GFP coexpression, before (panel on the left) and after ablation (indicated by the dashed line) of the basal actomyosin network along the AP (a, c) and the DV (b, d) axes. MyoII is visualized by using a MyoII-mCherry construct. Right panel: kymographs illustrating network recoil along the DV (a, c) and the AP (b, d) axes after ablation. The results shown in ad have been successfully repeated from the at least four independent experiments. e Maximum recoil speed after ablations in the n individual control (only mCD8GFP expressing) and Cdc42DN clones. For the control DV vs. AP comparison: p < 0.0001; for the Cdc42DN DV vs. AP comparison: p = 0.0788; both by two-sided Mann–Whitney test. f, g Time-lapse series of a representative wild-type cell, neighboring (f) or distantly located (g) from Cdc42DN-expressing clones, before and after ablation (indicated by the dashed line) of the actomyosin network along the AP axis. Right panel: kymographs illustrating network recoil after ablation. The results shown in f, g have been successfully repeated from the at least four independent experiments. h Maximum recoil speed after ablations in the n individual wild-type cells that are neighboring or distantly located from Cdc42DN-expressing clones. p < 0.0001 by two-sided Mann–Whitney test. Data are presented as mean values +/− SEM. Scale bars are 5 μm in a, b, c, d, f, g.
Fig. 7
Fig. 7. Cdc42 controls DV-polarized supracellular tension and AP-directed global tissue elongation.
ac Time-lapse series of a representative egg chamber not expressing (a, b) and expressing (c) the Cdc42DN transgene marked by mCD8GFP coexpression before and after ablation (indicated by the dashed line) of the basal actomyosin network over a 100 µm line along the AP (a, c) and the DV (b) axes. MyoII is visualized by using a MyoII-mCherry construct. d Maximum recoil speed after ablations in the n individual control (only mCD8GFP expressing) and Cdc42DN-expressing egg chambers. Data are presented as mean values +/− SEM. For the control DV vs. AP comparison: p = 0.0043; for the Cdc42DN DV vs. AP comparison: p = 0.1157; both by two-sided Mann–Whitney test. e Egg chamber morphology under the indicated genetic backgrounds at S10 and S14. Armadillo staining in red and DAPI staining in blue. f Anterior-posterior (AP) to dorsal-ventral (DV) length ratio in the n individual egg chambers under the indicated genetic backgrounds at S10 and S14. Boxes extend from the 25th to 75th percentiles, the mid line represents the median and the whiskers indicate the maximum and the minimum values. For all comparisons, p < 0.0001 by two-sided Mann–Whitney test. g Time-lapse images showing the region of contact of one mCD8GFP expressing cell with a wild-type cell before and after nano-ablating (indicated by the dashed line) stress fibers juxtaposed to filopodia (white arrowhead). Circles indicate the initial positions of the filopodia tips juxtaposed to severed (white) or preserved (yellow) stress fibers. Arrow heads indicate the current position of the filopodia. h Percentage of filopodia undergoing either no displacement, recoil or extension during the first minute after ablation. i Time-lapse series of a representative egg chamber, before and after ablation (indicated by the dashed line) of the actomyosin network along the AP axis and across a filopodium. The arrowhead indicates the current position of the filopodium tip. Arrows indicate the actomyosin recoil directions. j Schematic representation of follicle cells and the subcellular distribution of stress fibers and intercellular filopodia forming a supracellular contractile network (top panel) surrounding the egg chamber and generating tissue scale forces driving AP tissue elongation (bottom panel). Scale bars are 10 μm in ac, i, 50 μm in e, and 2 µm in g.

Similar articles

Cited by

References

    1. Landsberg KP, et al. Increased cell bond tension governs cell sorting at the Drosophila anteroposterior compartment boundary. Curr. Biol. 2009;19:1950–1955. doi: 10.1016/j.cub.2009.10.021. - DOI - PubMed
    1. Monier B, Pelissier-Monier A, Brand AH, Sanson B. An actomyosin-based barrier inhibits cell mixing at compartmental boundaries in Drosophila embryos. Nat. Cell Biol. 2010;12:60–69. doi: 10.1038/ncb2005. - DOI - PMC - PubMed
    1. Martin AC, Gelbart M, Fernandez-Gonzalez R, Kaschube M, Wieschaus EF. Integration of contractile forces during tissue invagination. J. Cell Biol. 2010;188:735–749. doi: 10.1083/jcb.200910099. - DOI - PMC - PubMed
    1. Yang Y, Levine H. Role of the supracellular actomyosin cable during epithelial wound healing. Soft Matter. 2018;14:4866–4873. doi: 10.1039/C7SM02521A. - DOI - PubMed
    1. Kiehart DP, Galbraith CG, Edwards KA, Rickoll WL, Montague RA. Multiple forces contribute to cell sheet morphogenesis for dorsal closure in Drosophila. J. Cell Biol. 2000;149:471–490. doi: 10.1083/jcb.149.2.471. - DOI - PMC - PubMed

Publication types