. 2020 Apr 20;10(1):6617.
doi: 10.1038/s41598-020-63629-w.

The TIPE Molecular Pilot That Directs Lymphocyte Migration in Health and Inflammation

Affiliations

The TIPE Molecular Pilot That Directs Lymphocyte Migration in Health and Inflammation

Honghong Sun et al. Sci Rep. .

Abstract

Lymphocytes are some of the most motile cells of vertebrates, constantly navigating through various organ systems. Their specific positioning in the body is delicately controlled by site-specific directional cues such as chemokines. While it has long been suspected that an intrinsic molecular pilot, akin to a ship's pilot, guides lymphocyte navigation, the nature of this pilot is unknown. Here we show that the TIPE (TNF-α-induced protein 8-like) family of proteins pilot lymphocytes by steering them toward chemokines. TIPE proteins are carriers of lipid second messengers. They mediate chemokine-induced local generation of phosphoinositide second messengers, but inhibit global activation of the small GTPase Rac. TIPE-deficient T lymphocytes are completely pilot-less: they are unable to migrate toward chemokines despite their normal ability to move randomly. As a consequence, TIPE-deficient mice have a marked defect in positioning their T lymphocytes to various tissues, both at the steady-state and during inflammation. Thus, TIPE proteins pilot lymphocytes during migration and may be targeted for the treatment of lymphocyte-related disorders.


Conflict of interest statement

Y.H.C. is a member of the advisory boards of Amshenn Co. and Binde Co. None of the other authors have any competing interests to disclose.

Figures
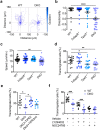
Figure 1
Figure 1
Complete loss of directionality, but not speed, of TIPE-deficient T cells. (a–c) Migration tracks (a) directionality (b) and speed (c) of CD4+ T cells from WT, Tnfaip8−/−, Tipe2−/−, and Tnfaip8−/−Tipe2−/− (DKO) mice (4 mice per group), in response to CCL21, as determined in the μ-slide migration assay. n = 25 cells per group (a); n = 30 cells for WT, 31 for Tnfaip8−/−, 29 for Tipe2−/− and 36 for DKO group (b,c). (df) Transmigration of CD4+ T cells from mice of the indicated genotypes (4 mice per group) (d, n = 18 samples per group), together with DKO cells transfected with the expression plasmids for TIPE2 or TIPE2 mutant (TIPE2mt) (e, n = 8 per group), or cells treated with the PI3K inhibitor LY290004 or Rac inhibitor NSC23766 (f, n = 12 per group), as determined in the transwell transmigration assay with CCL21. Data are representative of at least three independent experiments (a-c), or are pooled from three (e,f) or four experiments (d). Values are mean ± s.e.m. of n biologically independent samples (bf). *P < 0.05; **P < 0.01; ***P < 0.001; ****P < 0.0001 (Mann-Whitney U test (b) or Student’s t-test (cf)).
Figure 2
Figure 2
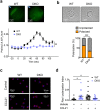
Essential roles of TIPE proteins in chemokine-induced PtdIns(3,4,5)P3 generation, and morphological and Rac1-GTP polarization. (a) PtdIns(3,4,5)P3 levels detected by AKT-PH-GFP biosensor in live WT and DKO CD4+ T cells, in response to point source stimulation of CCL21, as visualized by super-resolution fluorescence video microscopy. Upper panels show a WT and a DKO T cells 60 sec after CCL21 stimulation, with arrows pointing to the source of CCL21. The lower panel shows the changes in PtdIns(3,4,5)P3 levels relative to Time 0 when CCL21 was applied; values are mean ± s.e.m., with n = 20 cells for each group. (b) Morphological polarization of WT and DKO CD4+ T cells, in response to point source stimulation of CCL21, as visualized by phase contrast microscopy. Upper panels show a polarized WT and an unpolarized DKO T cells 10 min after CCL21 stimulation. The lower panel shows the percentages of polarized and unpolarized cells 10 min after CCL21 stimulation; n = 308 cells for WT and 304 cells for DKO group. (c,d) Rac1-GTP polarization in WT and DKO CD4+ T cells, in response to point source stimulation of CCL21, as visualized by immunofluorescence microscopy. Panel-c shows WT and DKO T cells 60 sec after incubation with CCL21 or medium alone (Control). Panel-d shows the calculated polarization index of each group treated as in Panel-c; n = 16–24 cells for WT and 17–18 for DKO group. Values are mean ± s.e.m. The experiments were repeated independently at least three times (ad) with similar results. *P < 0.05; **P < 0.01; ****P < 0.0001 (Mann-Whitney U test (a) or Student’s t-test (b,d)).
Figure 3
Figure 3
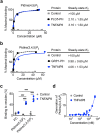
TNFAIP8 binding to phosphoinositides, and its effect on PtdIns(3,4,5)P3 generation by PI3Ks. (a,b) SPR analysis of TNFAIP8 binding to DOPC membranes containing 10% (mole/mole) PtdIns(4,5)P2 (a) or PtdIns(3,4,5)P3 (b) on L1 sensor chip. Purified PLCδ-PH and GRP1-PH domains were used as positive controls, and trypsin inhibitor as a negative control (Control). The percent of maximal binding (Left Panels) and equilibrium KD (Right Panels) are shown. (c) Sedimentation-based phosphoinositide binding assay showing the proportion of TNFAIP8 and control protein trypsin inhibitor bound to SUVs containing 100% PC, 10% PtdIns(4,5)P2 or 10% PtdIns(3,4,5)P3. (d) Phosphorylation of PtdIns(4,5)P2 by PI3Ks as measured in the ADP-Glo kinase assay, in the presence of increasing concentrations of murine TNFAIP8 protein or 2 μM BSA (Control). The values are mean ± s.d. (a–c) or mean ± s.e.m. (d). Data represent three independent experiments (a,b) or are pooled from four (c) or two independent experiments done in duplicates (d). ***P < 0.001 (Student’s t-test (c)).
Figure 4
Figure 4
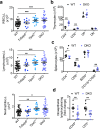
Abnormal positioning of leukocytes in tissues of TIPE-deficient mice under the steady state. (a) The total white blood cell, lymphocyte, and neutrophil counts of the blood of normal 6–8-week-old WT (n = 37), Tnfaip8−/− (n = 10), Tipe2−/− (n = 15), and DKO (n = 35) mice. (b) The numbers of the indicated cell subsets of thymus of WT (n = 6) and DKO (n = 8) mice as determined by flow cytometry. CD4+ and CD8+ denote the respective single positive cells; DP denotes double positive cells; DN denotes double negative cells. (c) The numbers of the indicated cell subsets of spleen of WT (n = 6) and DKO (n = 8) mice as determined by flow cytometry. (d) Relative numbers of the indicated intraepithelial cells per mg of small intestine of WT (n = 10 mice for CD45+ and 9 for CD3+ cells) and DKO (n = 13 for CD45+ and 8 for CD3+ cells) mice as determined by flow cytometry. Data are normalized to the mean of the respective WT group. The values are mean ± s.e.m. (a–d), and are pooled from two (b,c) or three (a,d) independent experiments. *P < 0.05; **P < 0.01; ***P < 0.001 (Student’s t-test (a–d)).
Figure 5
Figure 5
Abnormal positioning of leukocytes in the nervous tissue of TIPE-deficient mice during encephalomyelitis. (a) EAE scores of Rag2−/− mice (n = 4 mice per group) that were injected with MOG-specific WT or DKO CD4+ T cells. (b) The percentages of WT CD45.1+ and DKO CD45.2+ T cells among total CD3+ T cells in the blood (BLD) and spinal cord (Sp Cord) of EAE mice (n = 7 mice per group) that were injected with WT and DKO bone marrow cells at 1:1 ratio. Samples were collected one day after EAE onset. (c) The percentages of transferred CMTMR-labeled WT and CMFDA-labeled DKO cells among total leukocytes in the blood (BLD), spleen (SPL), and spinal cord (Sp Cord) of EAE mice (n = 5 mice per group) that were injected with the respective MOG-specific WT and DKO CD4+ T cells at 1:1 ratio. Samples were collected on the day of the EAE onset. The values are mean ± s.e.m. (a–c), and are pooled from two independent experiments (b,c) or are representative of four independent experiments (a). *P < 0.05; **P < 0.01; ****P < 0.0001 (Mann-Whitney U test (a,b) or Student’s t-test (c)).
Figure 6
Figure 6
The TIPE molecular pilot. Phospholipid second messengers are present in two distinct forms in cells: the lipid membrane-anchored form and the TIPE-anchored form, e.g., TIPE-PIP2 and TIPE-PIP3. The membrane-anchored form has its acyl chains inserted into the lipid bilayer and can function only at the membrane. On the other hand, the TIPE-anchored form of phosphoinositides has its acyl chains hidden inside the TIPE hydrophobic cavity and its charged head group exposed on the surface. The TIPE-anchored form is water-soluble and freely diffusible, and can function at the membrane-cytosol interface and in the cytosol. See text for more details.

Similar articles

Cited by

References

    1. Kunkel EJ, Butcher EC. Chemokines and the tissue-specific migration of lymphocytes. Immunity. 2002;16:1–4. doi: 10.1016/S1074-7613(01)00261-8. - DOI - PubMed
    1. Gregor CE, Foeng J, Comerford I, McColl SR. Chemokine-Driven CD4(+) T Cell Homing: New Concepts and Recent Advances. Adv. Immunol. 2017;135:119–181. doi: 10.1016/bs.ai.2017.03.001. - DOI - PubMed
    1. Jin T, Xu X, Hereld D. Chemotaxis, chemokine receptors and human disease. Cytokine. 2008;44:1–8. doi: 10.1016/j.cyto.2008.06.017. - DOI - PMC - PubMed
    1. Bloes DA, Kretschmer D, Peschel A. Enemy attraction: bacterial agonists for leukocyte chemotaxis receptors. Nat. Rev. Microbiol. 2015;13:95–104. doi: 10.1038/nrmicro3390. - DOI - PubMed
    1. Derfuss T, Kuhle J, Lindberg R, Kappos L. Natalizumab therapy for multiple sclerosis. Semin. Neurol. 2013;33:26–36. doi: 10.1055/s-0033-1343793. - DOI - PubMed

Publication types

MeSH terms

Substances