. 2020 May 5;117(18):9876-9883.
doi: 10.1073/pnas.2002110117. Epub 2020 Apr 17.

Cryo-EM structure of C9ORF72-SMCR8-WDR41 reveals the role as a GAP for Rab8a and Rab11a

Affiliations

Cryo-EM structure of C9ORF72-SMCR8-WDR41 reveals the role as a GAP for Rab8a and Rab11a

Dan Tang et al. Proc Natl Acad Sci U S A. .

Abstract

A massive intronic hexanucleotide repeat (GGGGCC) expansion in C9ORF72 is a genetic origin of amyotrophic lateral sclerosis (ALS) and frontotemporal dementia (FTD). Recently, C9ORF72, together with SMCR8 and WDR41, has been shown to regulate autophagy and function as Rab GEF. However, the precise function of C9ORF72 remains unclear. Here, we report the cryogenic electron microscopy (cryo-EM) structure of the human C9ORF72-SMCR8-WDR41 complex at a resolution of 3.2 Å. The structure reveals the dimeric assembly of a heterotrimer of C9ORF72-SMCR8-WDR41. Notably, the C-terminal tail of C9ORF72 and the DENN domain of SMCR8 play critical roles in the dimerization of the two protomers of the C9ORF72-SMCR8-WDR41 complex. In the protomer, C9ORF72 and WDR41 are joined by SMCR8 without direct interaction. WDR41 binds to the DENN domain of SMCR8 by the C-terminal helix. Interestingly, the prominent structural feature of C9ORF72-SMCR8 resembles that of the FLNC-FNIP2 complex, the GTPase activating protein (GAP) of RagC/D. Structural comparison and sequence alignment revealed that Arg147 of SMCR8 is conserved and corresponds to the arginine finger of FLCN, and biochemical analysis indicated that the Arg147 of SMCR8 is critical to the stimulatory effect of the C9ORF72-SMCR8 complex on Rab8a and Rab11a. Our study not only illustrates the basis of C9ORF72-SMCR8-WDR41 complex assembly but also reveals the GAP activity of the C9ORF72-SMCR8 complex.

Keywords: C9ORF72; GAP activity; SMCR8; WDR41; cryo-EM.


Conflict of interest statement

The authors declare no competing interest.

Figures

Fig. 1.
Fig. 1.
The CSW complex is a dimer of C9ORF72–SMCR8–WDR41. (A) Schematic diagram of the domain arrangement of C9ORF72 (light blue), SMCR8 (light green), and WDR41 (orange). The names and boundaries of domains are labeled. CTR, C-terminal helix of WDR41. The numbers in WDR41 represent WD40 domains: WD1 (41–81), WD2 (88–131), WD3 (137–168), WD4 (177–281), WD5 (226–276), WD6 (281–314), WD7 (326–401), and WD8 (411–432, and β-N). The interactions between different domains are shown in lines: light-blue line, C9ORF72–SMCR8 interaction; orange line, WDR41–SMCR8 interaction. (B) Gel filtration (superpose 6 10/300 GL) profile of reconstituted C9ORF72–SMCR8–WDR41 and C9ORF72–SMCR8 complex. The horizontal axis is elution volume, and the vertical axis is ultraviolet (UV) absorption. The UV absorbance is shown in red (C9ORF72–SMCR8–WDR41) and blue (C9ORF72–SMCR8) lines. The peaks of proteins are labeled. The Coomassie blue-stained sodium dodecyl sulfate–polyacrylamide gel electrophoresis (SDS/PAGE) gel shows the peak fraction of the CSW from gel filtration. (C) Analysis of peak fraction from B by sedimentation velocity AUC. C(S) functions calculated from sedimentation velocity data are shown in blue curve. The calculated molecular mass is denoted. Horizontal axis, sedimentation coefficient; vertical axis, continuous sedimentation coefficient distribution. (D and E) Cryo-EM density map of the CSW complex. (D) The overall map for the dimer. (E) The final map of one protomer of the CSW complex. The components of the CSW complex are indicated in different colors. Light blue, C9ORF72; light green, SMCR8; orange, WDR41.
Fig. 2.
Fig. 2.
The dimer interface of the two protomers in the CSW complex. (A) The overall structure of the CSW complex is shown in cartoon. The CSW complex shows a twofold symmetry. The domains are labeled. The width and height are denoted. C9ORF72, SMCR8, and WDR41 are colored in light blue, light green, and orange, respectively. (B) The density map of the interface between C9ORF72CTR and SMCR8DENN. The unoccupied ambiguous map is highlighted with an oval circle. The last residue presented in the model was denoted with a red dot and labeled. (C) The sequence alignment of C9ORF72CTR in different species. Human, Homo sapiens; mouse, Mus musculus; Xenopus, Xenopus tropicalis; zebrafish, Danio rerio. (D) Gel filtration (superpose 6 10/300 GL) profile of reconstituted C9ORF72∆C–SMCR8–WDR41 complex. C9ORF72∆C represents the construct of C9ORF72 with 461–481 deleted. The UV280 absorption curve of C9ORF72∆C–SMCR8–WDR41 complex is shown in blue, whereas WT C9ORF72–SMCR8–WDR41 complex is shown in orange as comparison. The peak fraction of C9ORF72∆C–SMCR8–WDR41 complex is examined by Coomassie blue-stained SDS/PAGE. (E and F) Analysis of by sedimentation velocity AUC of C9ORF72∆C–SMCR8–WDR41 (E) and C9ORF72–SMCR8Longin (F). C(S) functions calculated from sedimentation velocity data are shown in a blue curve. The calculated molecular mass is denoted. Horizontal axis, sedimentation coefficient; vertical axis, continuous sedimentation coefficient distribution.
Fig. 3.
Fig. 3.
Organization of the CSW protomer. (A) The overall structure of the CSW protomer. The key secondary structures are labeled. The colors are consistent with the previous figures. (B) The structure of the C9ORF72–SMCR8 complex adopts a similar organization to the FLCN–FNIP2 complex. (B, Left) C9ORF72–SMCR8 complex. (B, Right) FLCN–FNIP2 complex. C9ORF72 and SMCR8 are colored as in A. FLCN and FNIP2 are colored in green-cyan and wheat, respectively. The details of the comparison are presented in SI Appendix, Fig. S6. (C and D) Two interfaces between C9ORF72 DENN and SMCR8DENN are shown. (C) Comparison of DENN pair of C9ORF72–SMCR8 and FLCN-FNIP. The key helixes are labeled. The red dash line indicates the position of the interface. (D) The two interfaces between C9ORF72 DENN and SMCR8DENN are shown. The red dash line indicates the positions of the intraprotomer interface, while the blue dash line indicates the positions of the interprotomer interface.
Fig. 4.
Fig. 4.
The interface of SMCR8 and WDR41. (A) The details of the interface of SMCR8 and WDR41. The key residues on the interface are shown in stick model. Secondary structures are shown as cartoon. (A, Left) Front view. (A, Right) Back view. (B) C9ORF72, SMCR8Longin, C9ORF72–SMCR8Longin complex, and C9ORF72–SMCR8 complex were used to pulldown WDR41 and WDR41∆C. (C and D) Mutational analysis of key residues on WDR41CTH (C) and SMCR8 (D) using pulldown assay. The results are visualized by Coomassie blue-stained SDS/PAGE. Protein markers are labeled at left (unit: kilodaltons). (C) WT C9ORF72–SMCR8 complex with N-terminal His-tag was used to pull down untagged WT or indicated mutants of WDR41. WDR41-mutant: WDR41with mutations of S438A-R441A-S442A-L445R-F446R-L449R. Other mutants are shown as the label. (D) Indicated mutants of SMCR8 with N-terminal His-tag were used to pull down untagged WT WDR41. SMCR8M1, C9ORF72–SMCR8M1 (SMCR8 with mutations of T862A, F863A, H865A, L867A, E907A, K910A, Y913A, M914A); SMCR8M2, C9ORF72–SMCR8M2 (SMCR8 with mutations of T862A, F863A, H865A, L867A); SMCR8M3, C9ORF72–SMCR8M3 (SMCR8 with mutations of E907A, K910A, Y913A, M914A); WT, WT C9ORF72–SMCR8.
Fig. 5.
Fig. 5.
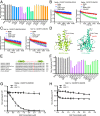
CSW and C9ORF72–SMCR8 complex are GAPs of Rab8a and Rab11a in vitro. (A) The screen of Rabs that can be stimulated by CSW or C9ORF72–SMCR8 complex using bioluminescence-based GTPase activity assay. In this assay, the final concentration of Rabs and C9/CS/CSW was 1.5 µM and 0.75 µM, respectively. The GTP in the reaction system containing no protein was normalized to “1.0.” The proteins or protein mixtures added in the reaction system are indicated below. Buffer, buffer control; C9, C9ORF72; CS, C9ORF72–SMCR8; CSW, WT C9ORF72–SMCR8–WDR41; 7a, Rab7a; 8a, Rab8a; 11a, Rab11a; 39a, Rab39a; 39b, Rab39b. The error bars represent mean ± SD (n = 3). (B and C) MANT-GDP–based nucleotide exchange assay for Rab8a (B) and Rab11a (C). The abbreviations of protein names are the same as A. One hundred micomolar GDP was used to initiate the exchange reaction. Reactions without GDP were monitored as a control. The error bars represent mean ± SD (n = 3). The intrinsic nucleotide exchange rate of Rab11a is negligible. (D) Comparison of the Longin domains of SMCR8 and FLCN. The secondary structures are labeled. The Arg164 of FLCN-Longin domain is highlighted in red. The missing loop of SMCR8Longin is indicated as a red dash line. (E) Sequence alignment of the βL4-βL5 loop of SMCR8. Arg147 of human SMCR8 is conserved across species and corresponds to Arg164 of FLCN. Human, Homo sapiens; mouse, Mus musculus; worm, Caenorhabditis elegans; Xenopus, Xenopus tropicalis zebrafish, Danio rerio. The secondary structures are shown on top of the sequence in light-green, and the βL4-βL5 is shown in red dash line. (F) Test the effect of Arg147 of SMCR8 on the stimulation of Rab8a and Rab11a. The experiment was carried out as in A, and the labels are the same as in A. C∆S, C9ORF72∆C-SMCR8; CSLongin, C9ORF72–SMCR8Longin; CSR147A, C9ORF72–SMCR8R147A; C∆SR147A, C9ORF72∆C-SMCR8R147A; CSLongin+R147A, C9ORF72–SMCR8Longin+R147A; SLongin, SMCR8Longin. The error bars represent mean ± SD (n = 3). (G and H) Measurement of GAP activity to Rab8a (G) and Rab11a (H) using different concentrations of C9ORF72–SMCR8 or C9ORF72–SMCR8Arg147. The final concentration of Rabs in this assay was 2 µM. The concentrations of C9ORF72–SMCR8 or C9ORF72–SMCR8Arg147 are indicated in the horizontal axis. The relative amount of nonhydrolyzed GTP in the system is shown in the vertical axis. Each concentration of GAP was measured in triplicate. The value of each measurement is shown in as “○” (C9ORF72–SMCR8) and “▽” (C9ORF72–SMCR8Arg147) since the error bars of several measurements are too small to be shown clearly in the figure. The curve was fitted to using the Stimulation Model in Graphpad.

Similar articles

Cited by

References

    1. Dion P. A., Daoud H., Rouleau G. A., Genetics of motor neuron disorders: New insights into pathogenic mechanisms. Nat. Rev. Genet. 10, 769–782 (2009). - PubMed
    1. Rowland L. P., Shneider N. A., Amyotrophic lateral sclerosis. N. Engl. J. Med. 344, 1688–1700 (2001). - PubMed
    1. Balendra R., Isaacs A. M., C9orf72-mediated ALS and FTD: Multiple pathways to disease. Nat. Rev. Neurol. 14, 544–558 (2018). - PMC - PubMed
    1. Ling S. C., Polymenidou M., Cleveland D. W., Converging mechanisms in ALS and FTD: Disrupted RNA and protein homeostasis. Neuron 79, 416–438 (2013). - PMC - PubMed
    1. DeJesus-Hernandez M., et al. , Expanded GGGGCC hexanucleotide repeat in noncoding region of C9ORF72 causes chromosome 9p-linked FTD and ALS. Neuron 72, 245–256 (2011). - PMC - PubMed

Publication types

MeSH terms

Associated data

LinkOut - more resources