. 2020 May 21;78(4):765-778.e7.
doi: 10.1016/j.molcel.2020.03.023. Epub 2020 Apr 15.

Gene-Specific Control of tRNA Expression by RNA Polymerase II

Affiliations

Gene-Specific Control of tRNA Expression by RNA Polymerase II

Alan Gerber et al. Mol Cell. .

Abstract

Increasing evidence suggests that tRNA levels are dynamically and specifically regulated in response to internal and external cues to modulate the cellular translational program. However, the molecular players and the mechanisms regulating the gene-specific expression of tRNAs are still unknown. Using an inducible auxin-degron system to rapidly deplete RPB1 (the largest subunit of RNA Pol II) in living cells, we identified Pol II as a direct gene-specific regulator of tRNA transcription. Our data suggest that Pol II transcription robustly interferes with Pol III function at specific tRNA genes. This activity was further found to be essential for MAF1-mediated repression of a large set of tRNA genes during serum starvation, indicating that repression of tRNA genes by Pol II is dynamically regulated. Hence, Pol II plays a direct and central role in the gene-specific regulation of tRNA expression.

Keywords: RNA Pol II; RNA Pol III; auxin degron; tRNA differential expression.


Conflict of interest statement

Declaration of Interests The authors declare no competing interests.

Figures
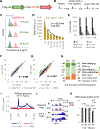
Figure 1.
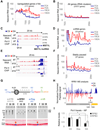
Figure 1.. Establishment of a cell line for rapid and inducible depletion of RPB1
(A) Schematic representation of the tagged RPB1 construct expressing a full length human RPB1 cDNA flanked with an N-terminal Flag-HA tag and a C-terminal Flag tag followed by a minimal auxin- sensitive degron, a V5 epitope and an mKO2 orange fluorescent protein. (B) Standard protocol for RPB1 depletion. (C) Time course flow cytometry experiment for clone #7 showing the progressive loss of fluorescence of DA-treated cells (in green). In red, untreated fluorescent cells. In blue, parental non-fluorescent cells. (D) Kinetics of fluorescence decay in all three clones. (E) % of remaining fluorescent cells at different time points during DA treatment for all 3 clones. (F) Correlation between gene expression levels in untreated (Ctl) and DOX-treated (Dox) pools of RNA prepared from all three clones. (G) Same as (F) but showing correlation between Ctl versus DA expression levels. (H) Number and type of genes affected >2-fold in the microarray analysis presented in (F) and (G). (I) Profile of RPB3 enrichment scores at all RefSeq genes for RPB1- expressing (Ctl) or RPBl-depleted (DA) clones #7 and 19#. TSS, transcription start site. TES, transcription end site. (J) Overlays of normalized nascent RNA and input-subtracted RPB3 ChlP-seq coverage at the MYC locus in RPBl-expressing (Ctl, blue) and RPBl-depleted (DA, red) cells for clones #7 and #19. (K) Quantification of RNA content in whole cell extract (Total) or nascent RNA fractions (Nascent) for clone #7 and #19 relative to Ctl. Data represent the average +/− SD.
Figure 2.
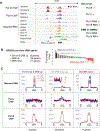
Figure 2.. DA-treatment converts a fraction of initiated Pol II into termination-incompetent Pol IIB
(A) Profile of nascent RNA scores at Pol II genes > lkb upregulated in the microarray analysis in RPBl- expressing (Ctl) or RPBl-depleted (DA) cells for clones #7 and 19#. TSS, transcription start site. TES, transcription end site. (B) Same as (A) but genome-wide profile (all RefSeq RNA clusters) of nascent RNA scores downstream of TES. (C) Overlays of normalized nascent RNA and input-subtracted RPB3 coverage at the MST1L IncRNA locus (anti-sense of MST1L), showing termination site read-through from the upstream snRNA Ul-4 gene in DA treated clone #7 and #19. (D) Same as (B) but profile of nascent RNA scores downstream of all snRNA genes. (E) same as (C) at and downstream of the stably paused UBC gene showing termination site read-through for DA-treated clones #7 and #19 cells. (F) same as (B) but profiles of nascent RNA scores downstream of stably paused genes. (G) Schematic representation of tagged RPB1 protein and the different antibodies used to evaluate RPB1 degradation efficiency and immunoblot and corresponding Ponceau-stained membrane of chromatin pellets prepared from DA-treated and control cells. (H) Mirror plot presenting the summed extracted areas of peptides obtained from full length (Ctl, blue) and truncated RBP1 (DA, red) normalized to the signal at residue 365–382. Note that the peptides covering the perfect heptad repeats (1615–1804) are not included because two peptides could match multiple regions. (I) Quantification of the levels of Pol II subunit expression in nuclear extracts and chromatin pellets (see Figure S2C). Data represent the average +/− SD; *p<0.05 (T-test).
Figure 3.
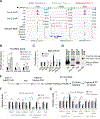
Figure 3.. Pol II transcription interferes with RNA Pol III activity
(A) Overlays of input-subtracted RPC62 and RPB3 ChlP-seq coverage and normalized nascent RNA in RPBl-expressing (Ctl, blue) or RPBl-depleted (DA, red) clone #7 and #19 cells at a MIR locus that is transcribed by Pol III in the anti-sense direction from the Pol ll-transcribed POLR3E gene. The nascent RNA coverage tracks of DRB-treated (yellow) and mock-treated (green) cells from Werner and Ruthenburg (2015) are also shown. The loss of elongating Pol II at this locus is correlated with an increase in Pol III occupancy and transcription of the MIR element in both DA-treated cells and DRB-treated cells. (B) tRNA genes affected >1.5-fold at the nascent RNA level with a FDR<0.05 in DRB-treated HEK293 cells (data ranked by Log2 fold change). tRNA genes affected significantly in DA-treated clones #7 and #19 cells are indicated by purple bars. Black rectangles identify the 3 model tRNA genes used in following experiments. (C) Profiles of nascent RNA, RPB3 and RPC62 enrichment scores at tRNA genes upregulated in both DA-treated and DRB-treated cells (1), upregulated in DRB only (2) or downregulated in DRB only (3) as defined in (B).
Figure 4.
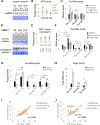
Figure 4.. RPB1 depletion affects tRNA transcription rates
(A) Overlays of input-subtracted RPC62 and RPB3 ChlP-seq coverage and normalized nascent RNA in RPBl-expressing (Ctl, blue) or RPBl-depleted (DA, red) clone #7 and #19 cells. The nascent RNA coverage tracks of DRB-treated (yellow) and mock-treated (green) cells are also shown. (B) Relative RNA expression levels in all three clones normalized to DMSO Ctl in RPBl-expressing (Ctl) or RPBl- depleted (DA) cells pre-treated with DRB or DMSO. (C) DA/Ctl ratios for data presented in (B). (D) Northern blot analysis of mature and pre-tRNAs in HEK293 cells treated with DRB or DMSO. Precursor sizes in HEK293 were obtained from SSB/La PAR-CLIP data from Gogakos et al. (2017). (E) Protocol used for the analysis of demethylated total and ethynyl-uridine (EU) labelled RNAs by RT-qPCR. (F) Relative expression levels of selected Pol I and Pol II RNAs in RPBl-expressing (Ctl) or RPBl-depleted (DA) cells for all 3 clones normalized to their levels under Ctl conditions. Data show the levels in total (Total) or metabolically labelled (EU-labelled) RNAs. (G) Same as (F) but for the three selected mature or precursor tRNAs. Data in (B), (C) and (F), (G) represent the average +/− SD; *p<0.05 (T-test)..
Figure 5.
Figure 5.. Pol II activity regulates tRNA transcription directly and indirectly and is essential for the repression of most tRNA genes in serum-deprived cells
(A) MYC immunoblot and corresponding Coomassie-stained membrane of nuclear extracts prepared from untreated (Ctl), Dox-treated and DA-treated cells for all three clones. (B) Quantification of data shown in (A). Histogram represents the average expression levels. (C) Relative pre-tRNA expression levels normalized to siCtl-treated cells for all 3 clones transfected with a non-targeting (siCtl) or MYC-targeting pool of siRNAs (siMyc) prior to RPB1 depletion. (D) MAF1 immunoblots and corresponding Coomassie-stained membrane of nuclear and cytoplasmic extracts. (E) MAF1 protein levels in cytoplasmic extracts prepared from RPBl-expressing or RPBl-depleted cells for all 3 clones. Histograms represent the average expression levels. (F) Relative pre-tRNA levels normalized to Ctl DMSO levels in RPBl-expressing (Ctl) or RPBl-depleted (DA) cells for all three clones treated with Rapa prior to or after auxin addition (see also Figure S5D and S5E). (G) Relative pre-tRNA levels normalized to Ctl cells kept in serum in RPBl-expressing (Ctl) or RPBl-depleted (DA) cells for all three clones cultured in the presence (black) or absence (white) of serum prior to and during RPB1- depletion. (H) DA/Ctl ratios for data shown in (G). (I) Microarray analysis of pools of RNA prepared from all three clones cultured in the presence (serum) or absence of serum (starved) for 20hrs. (J) Same as (I) but for cells treated with DA. Data in (C), (F), (G) and (H) represent the average +/− SD; *p<0.05, ns non-significant (T-test).
Figure 6.
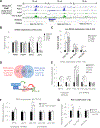
Figure 6.. Pol II repression of tRNA genes is not limited to HEK293 cells and likely occurs directly from local Pol II promoters
(A) ChlP-seq coverage for total and Ser2-phosphorylated RPB1 and corresponding input (data from ENCODE) in HeLa S3 cells at three model pre-tRNA loci. (B) Relative mRNA levels in HeLa S3 cells treated for lhr with LDC, DRB and Trip normalized to levels in DMSO-treated cells. (C) Same as (B) but showing normalized relative pre-tRNA levels. (D) Venn diagram showing that half of the tRNA genes up-regulated by DRB in HEK293 cells are bound by TCF4 (within 500 bps from the tRNA genes) in HCT116 cells and Model of β-catenin/TCF4-mediated repression of tRNA genes sensitive to Pol II repression. (E) same as (B, C) but for HCT116 cells. Pre-GIu is used as a control (Pol ll-independent). (F) Relative mRNA and pre-tRNA levels in HCT116 cells transiently cotransfected with plasmids expressing a dominant-negative TCF4 construct (AN-TCF4) and an EGFP or just an EGFP (control). (G) Relative fold-change of Pol II occupancy at the tRNA-Thr, tRNA-Ala loci and MYC promoter in HCT116 cells cotransfected as in (F). Data in (B), (C) and (E)-(G) represent the average +/− SD; *p<0.05 (T- test).
Figure 7.
Figure 7.. A model for direct repression of Pol III activity at tRNA genes by Pol II transcription
Model for the Pol II regulation of tRNA transcription rates. See Discussion for details

Similar articles

Cited by

References

    1. Afgan E, Baker D, Batut B, van den Beek M, Bouvier D, Čech M, Chilton J, Clements D, Coraor N, Grüning BA, et al. (2018). The Galaxy platform for accessible, reproducible and collaborative biomedical analyses: 2018 update. Nucleic Acids Res. 46, W537–W544. - PMC - PubMed
    1. Arimbasseri GA (2018). Interactions between RNAP III transcription machinery and tRNA processing factors. Biochim. Biophys. Acta BBA - Gene Regul. Mech. 1861, 354–360. - PubMed
    1. Arimbasseri AG, Rijal K, and Maraia RJ (2014). Comparative overview of RNA polymerase II and III transcription cycles, with focus on RNA polymerase III termination and reinitiation. Transcription 5, e27369. - PMC - PubMed
    1. Barski A, Chepelev I, Liko D, Cuddapah S, Fleming AB, Birch J, Cui K, White RJ, and Zhao K (2010). Pol II and its associated epigenetic marks are present at Pol III-transcribed noncoding RNA genes. Nat. Struct. Mol. Biol. 17, 629–634. - PMC - PubMed
    1. Benjamini Y, and Hochberg Y (1995). Controlling the False Discovery Rate: A Practical and Powerful Approach to Multiple Testing. J. R. Stat. Soc. Ser. B Methodol. 57, 289–300.

Publication types

MeSH terms