. 2020 Apr 14;52(4):668-682.e7.
doi: 10.1016/j.immuni.2020.03.004.

The Unfolded Protein Response Mediator PERK Governs Myeloid Cell-Driven Immunosuppression in Tumors through Inhibition of STING Signaling

Affiliations

The Unfolded Protein Response Mediator PERK Governs Myeloid Cell-Driven Immunosuppression in Tumors through Inhibition of STING Signaling

Eslam Mohamed et al. Immunity. .

Abstract

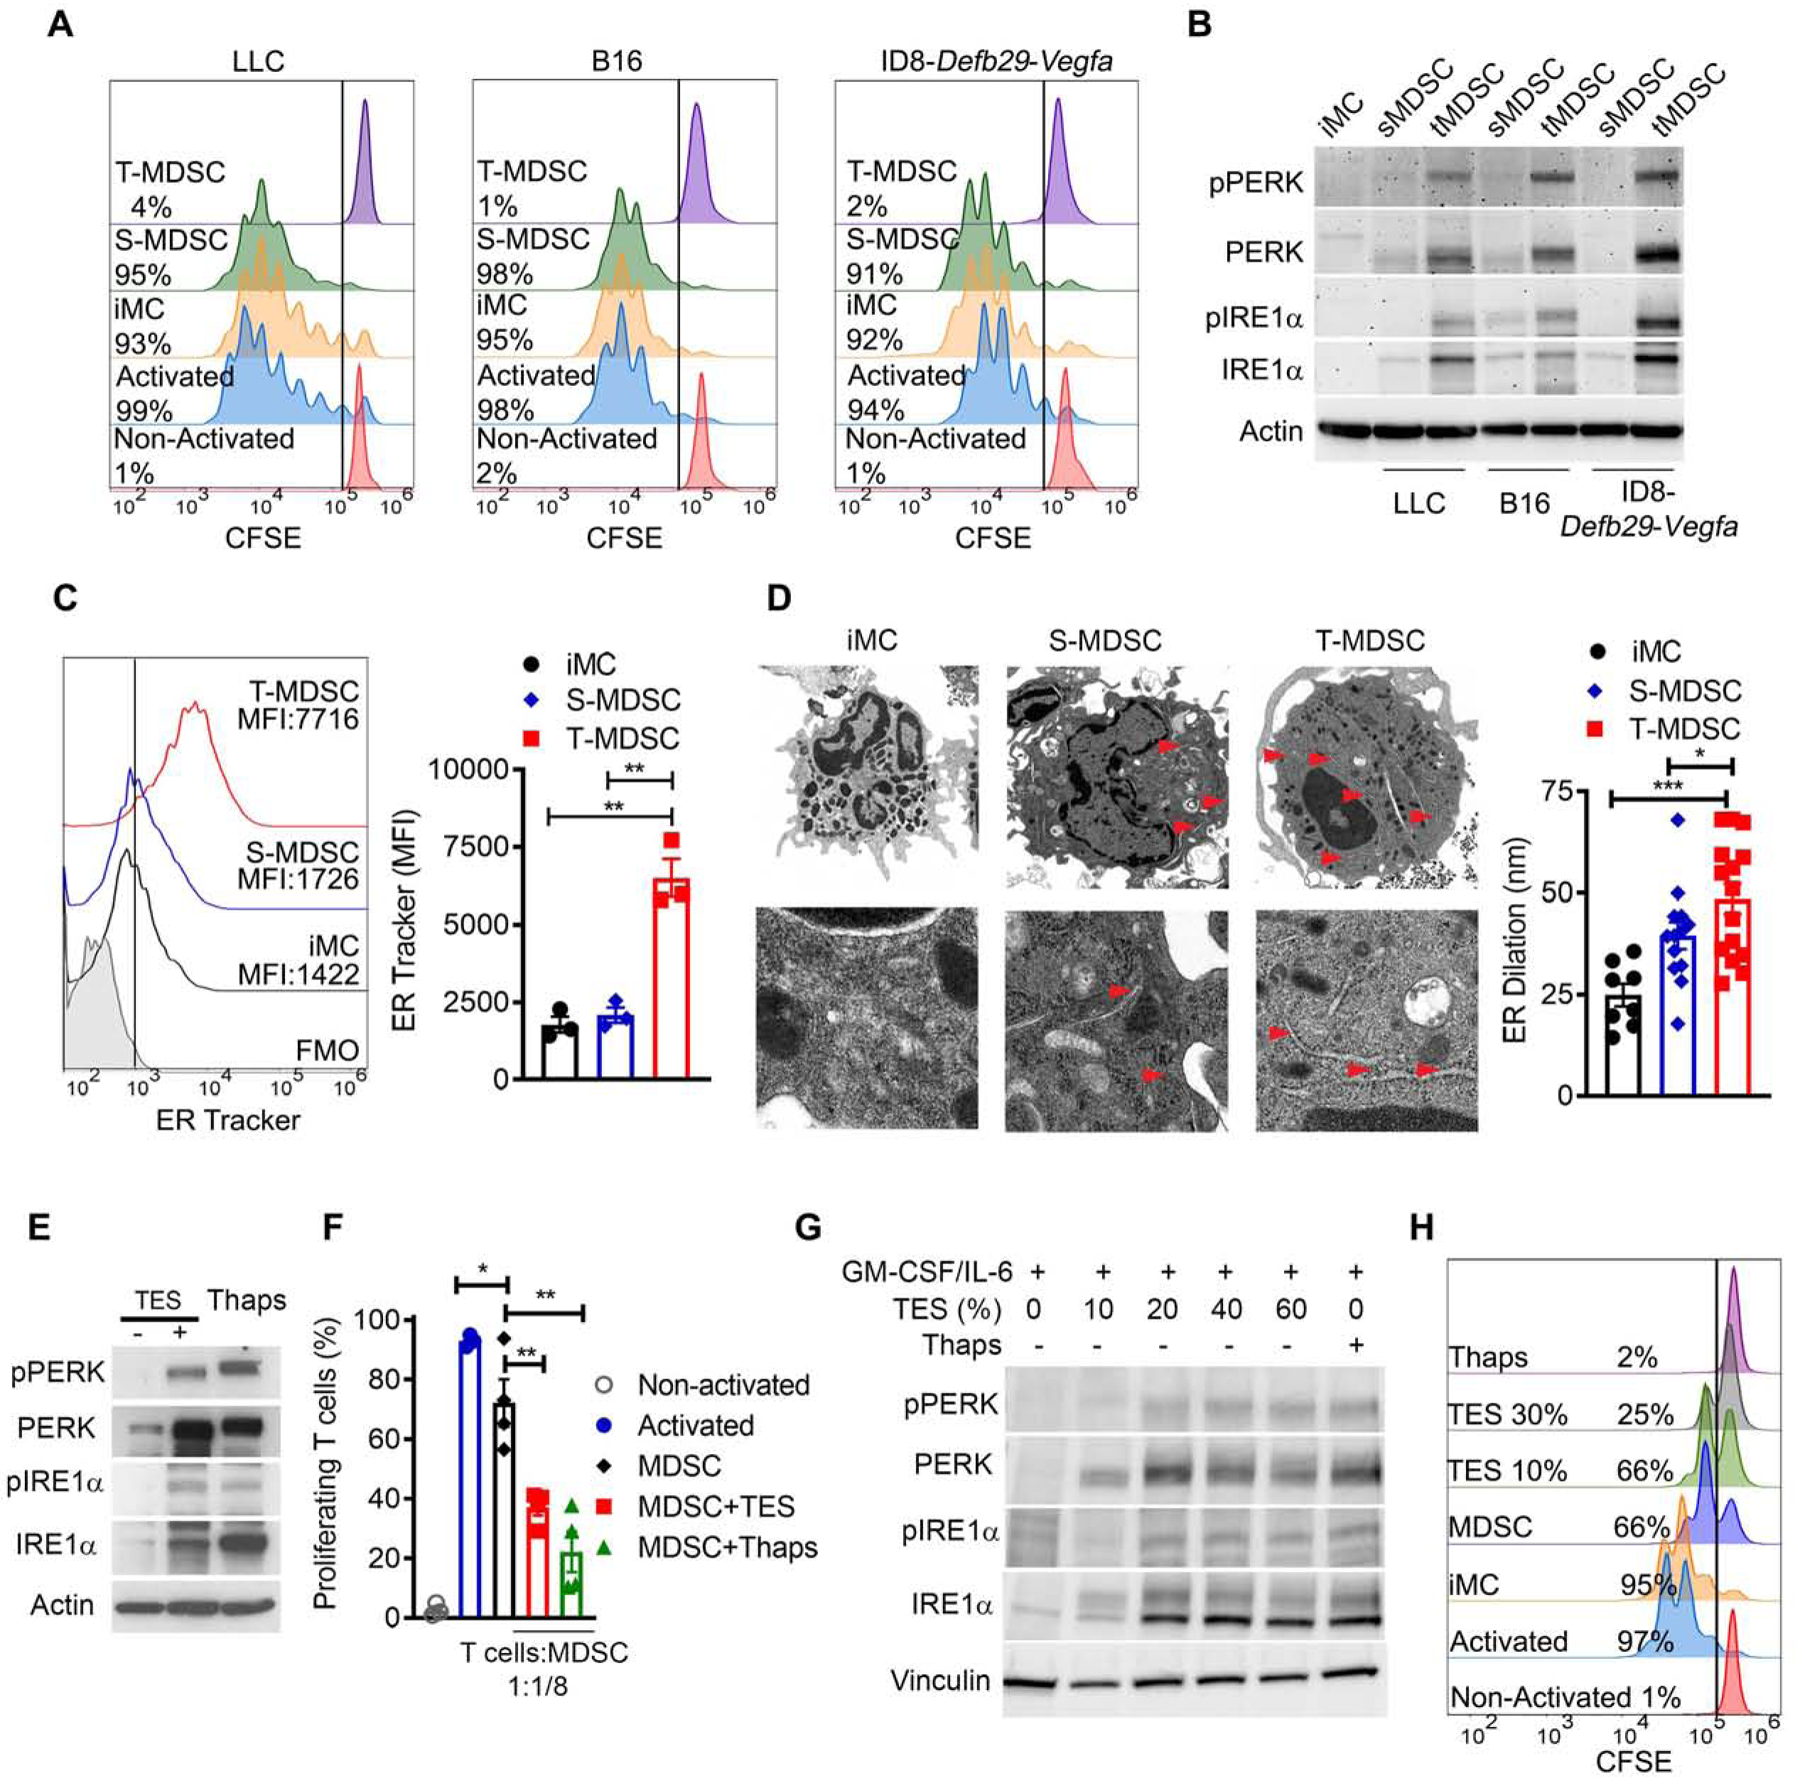
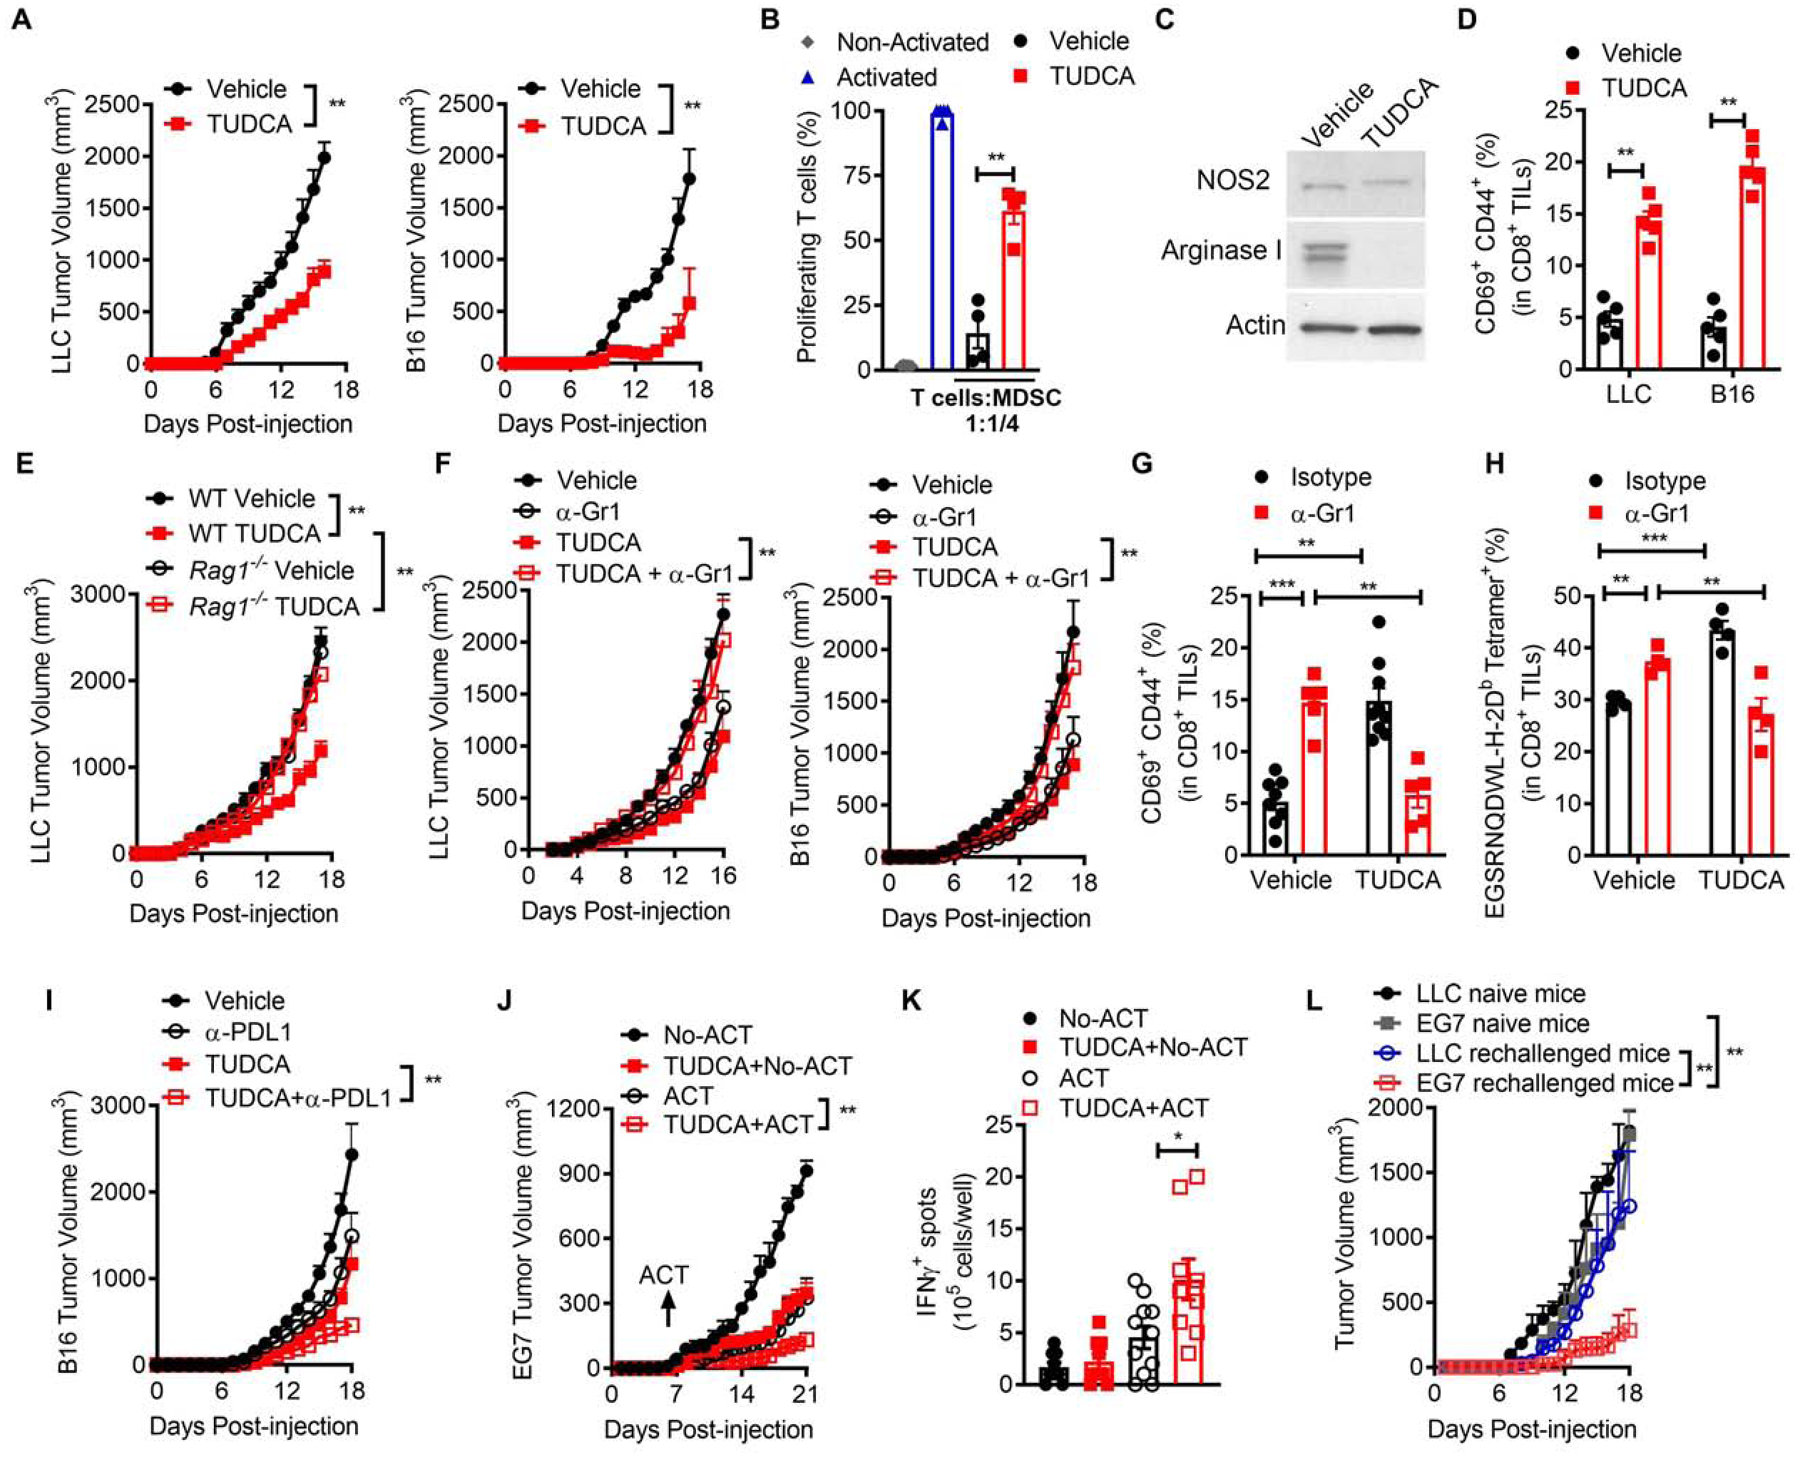
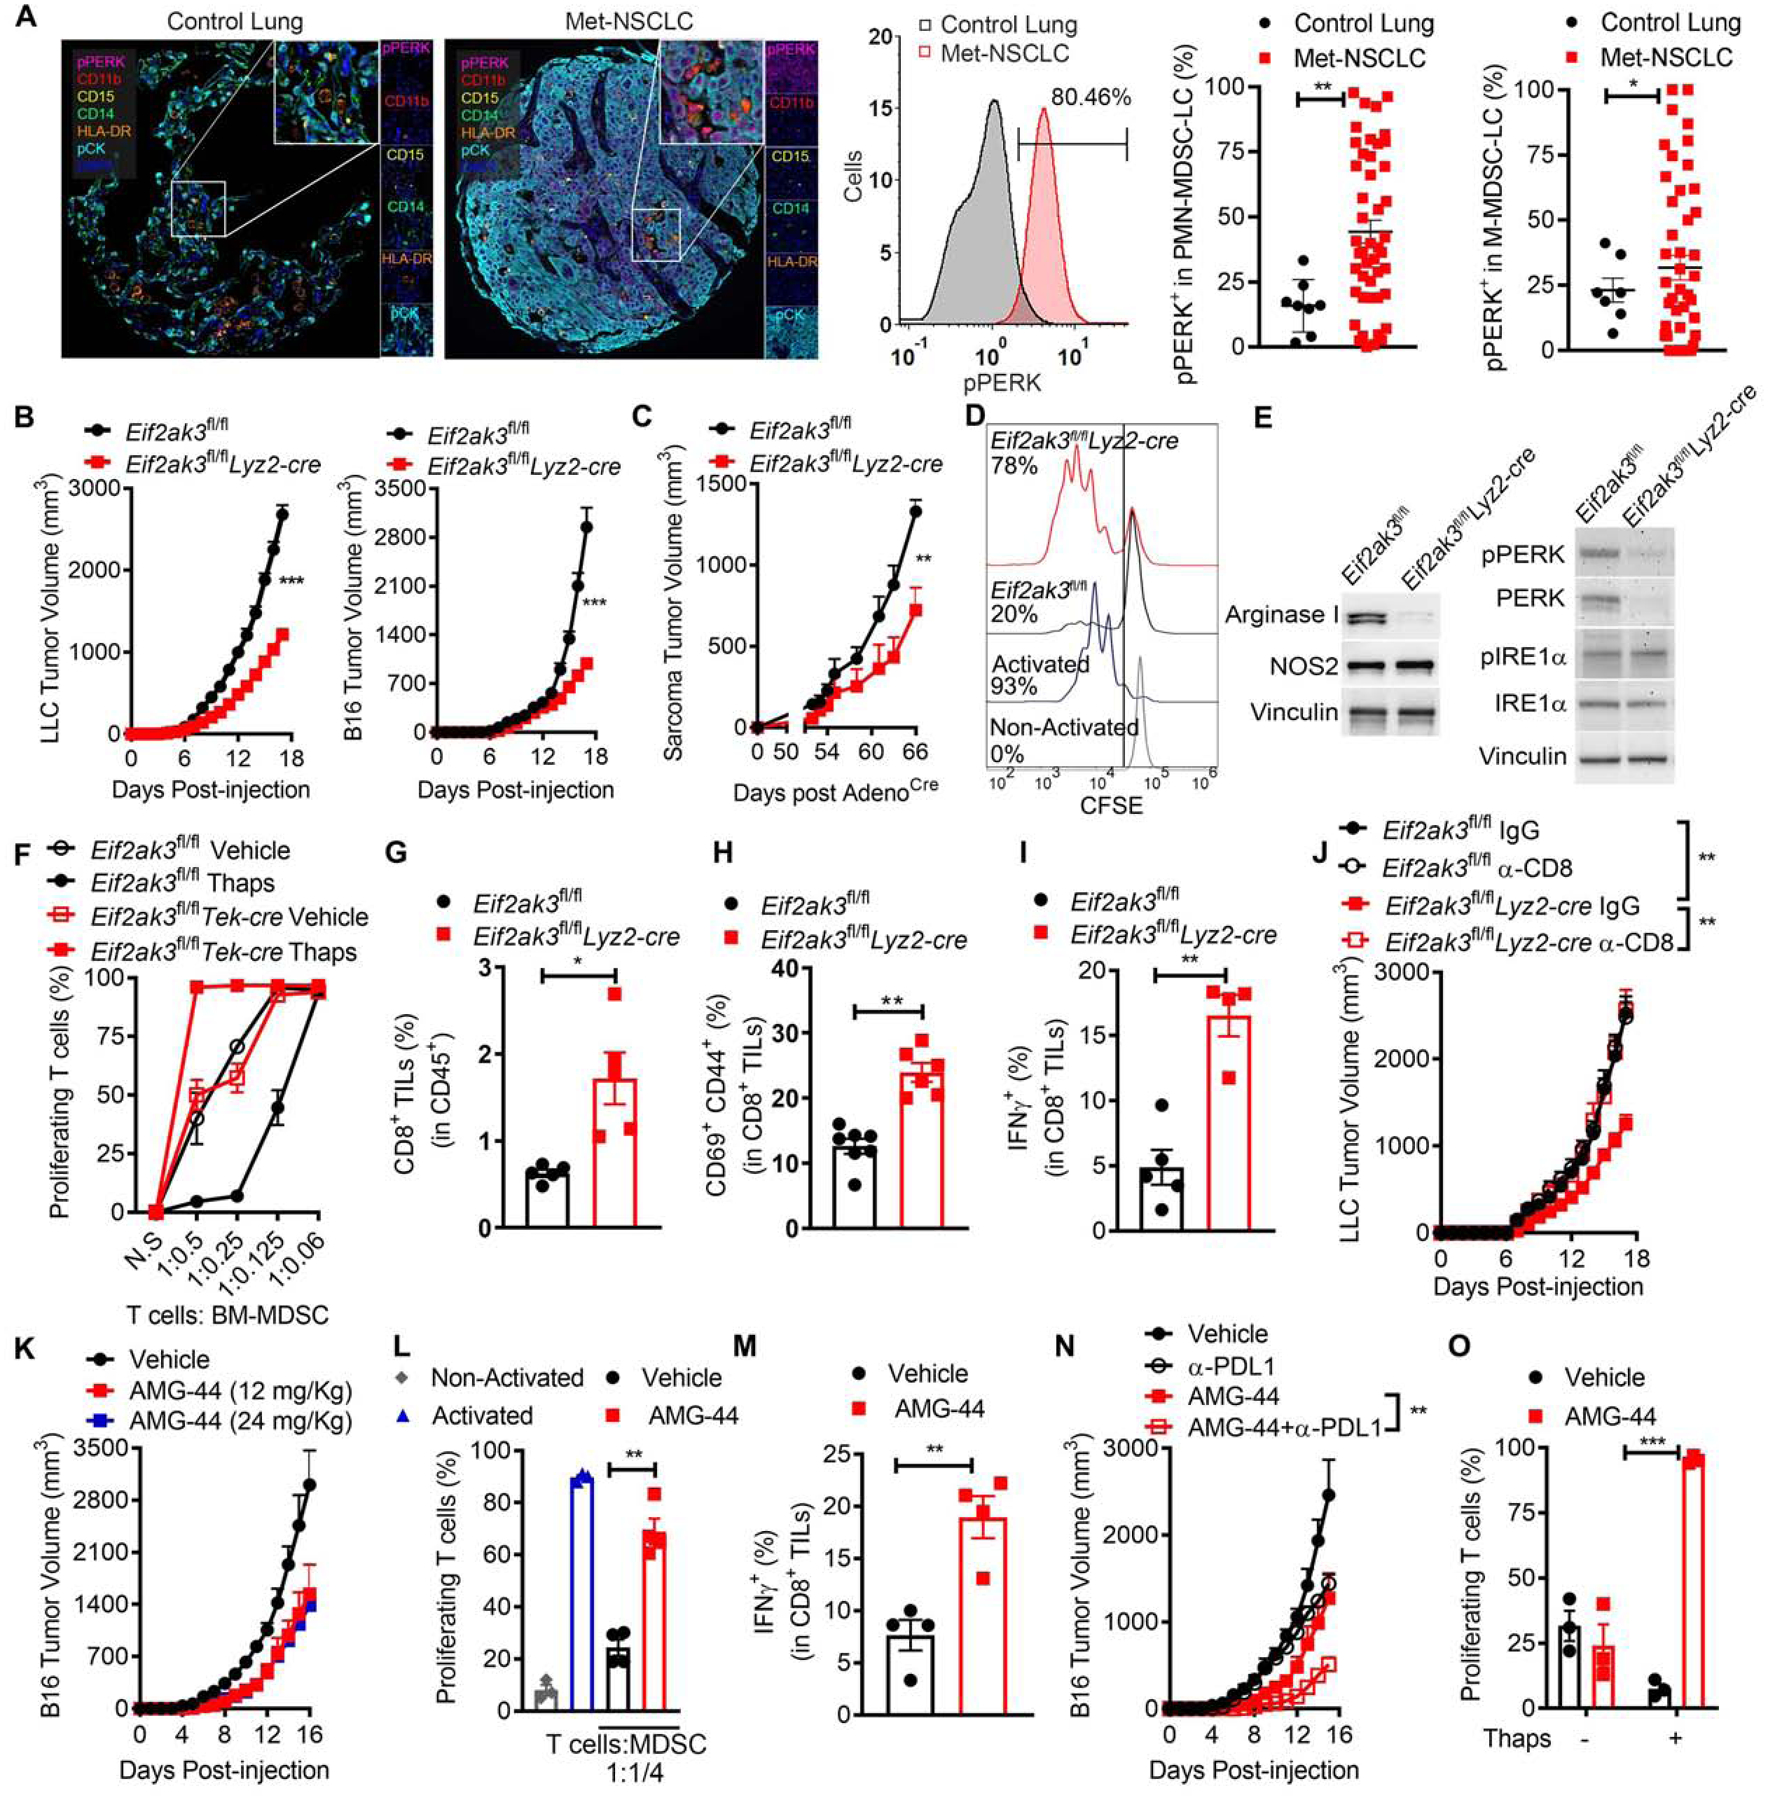
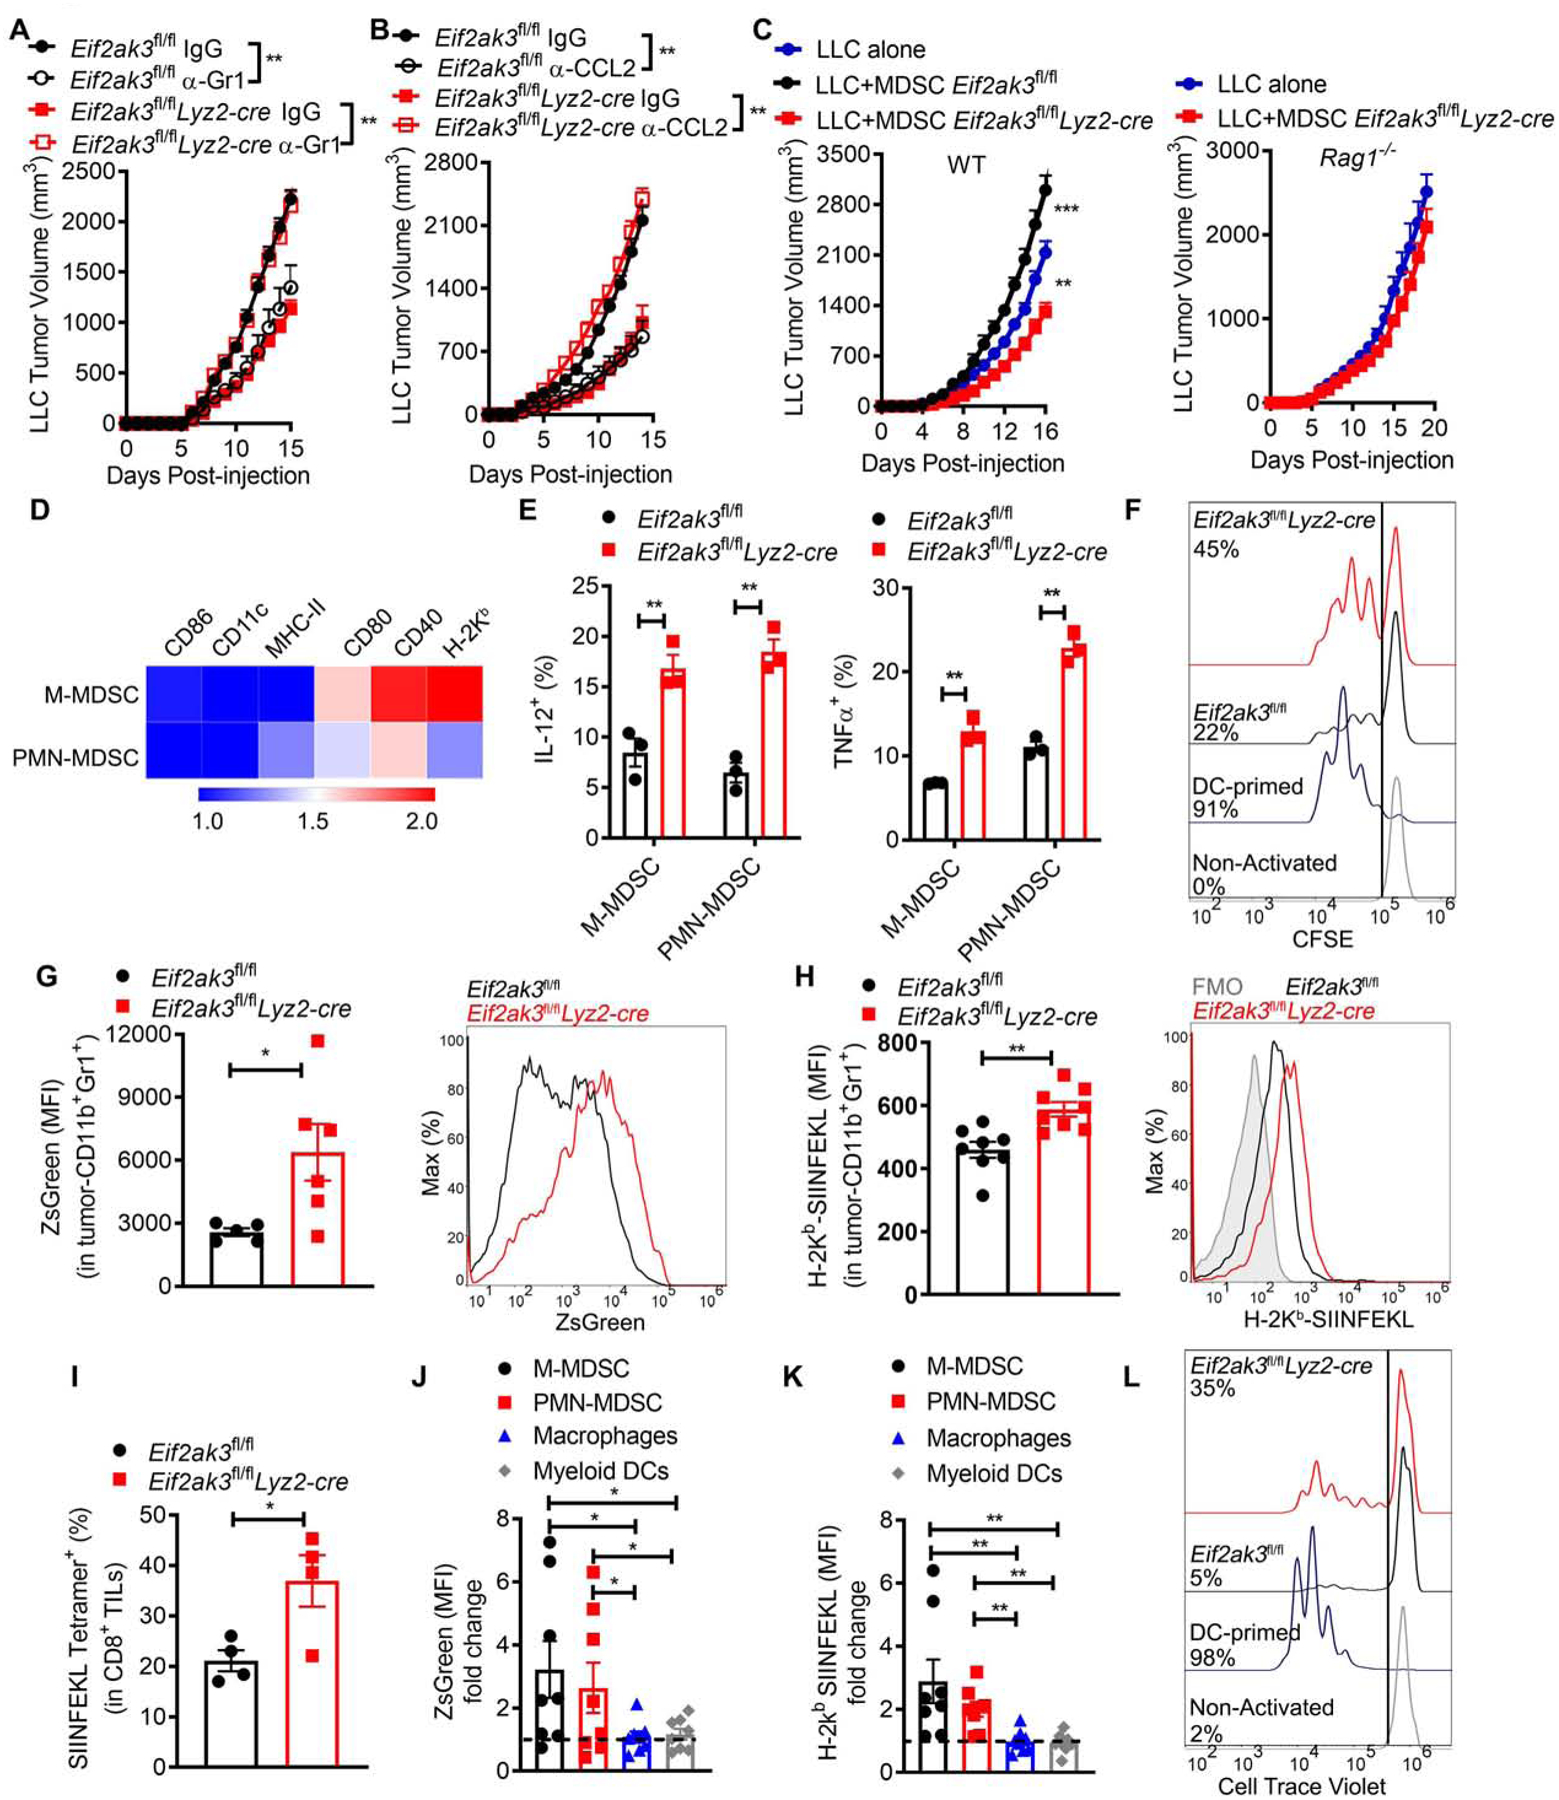
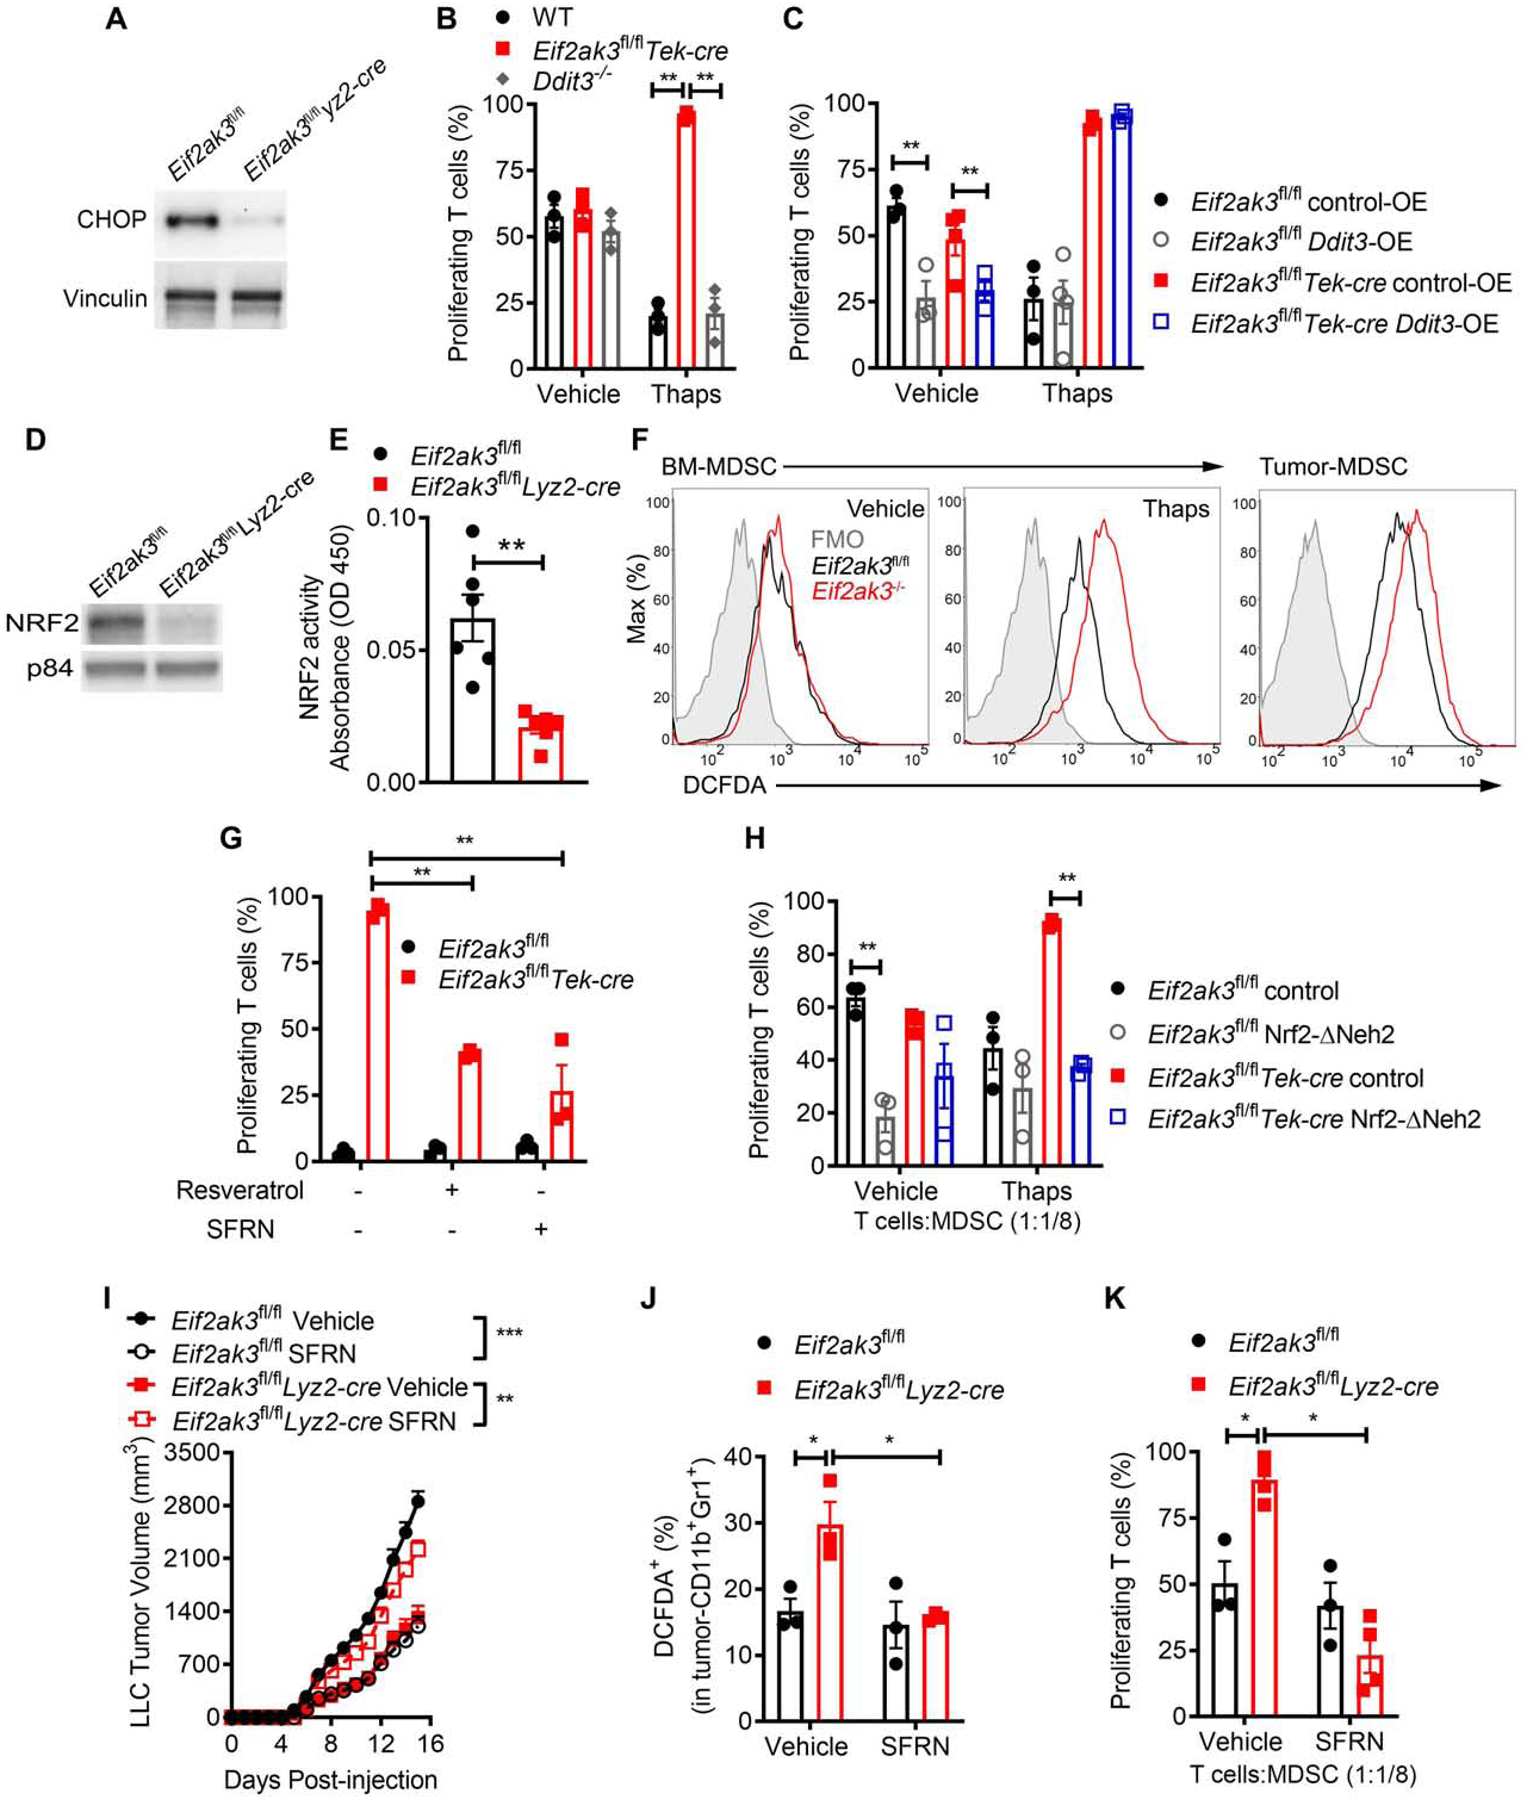
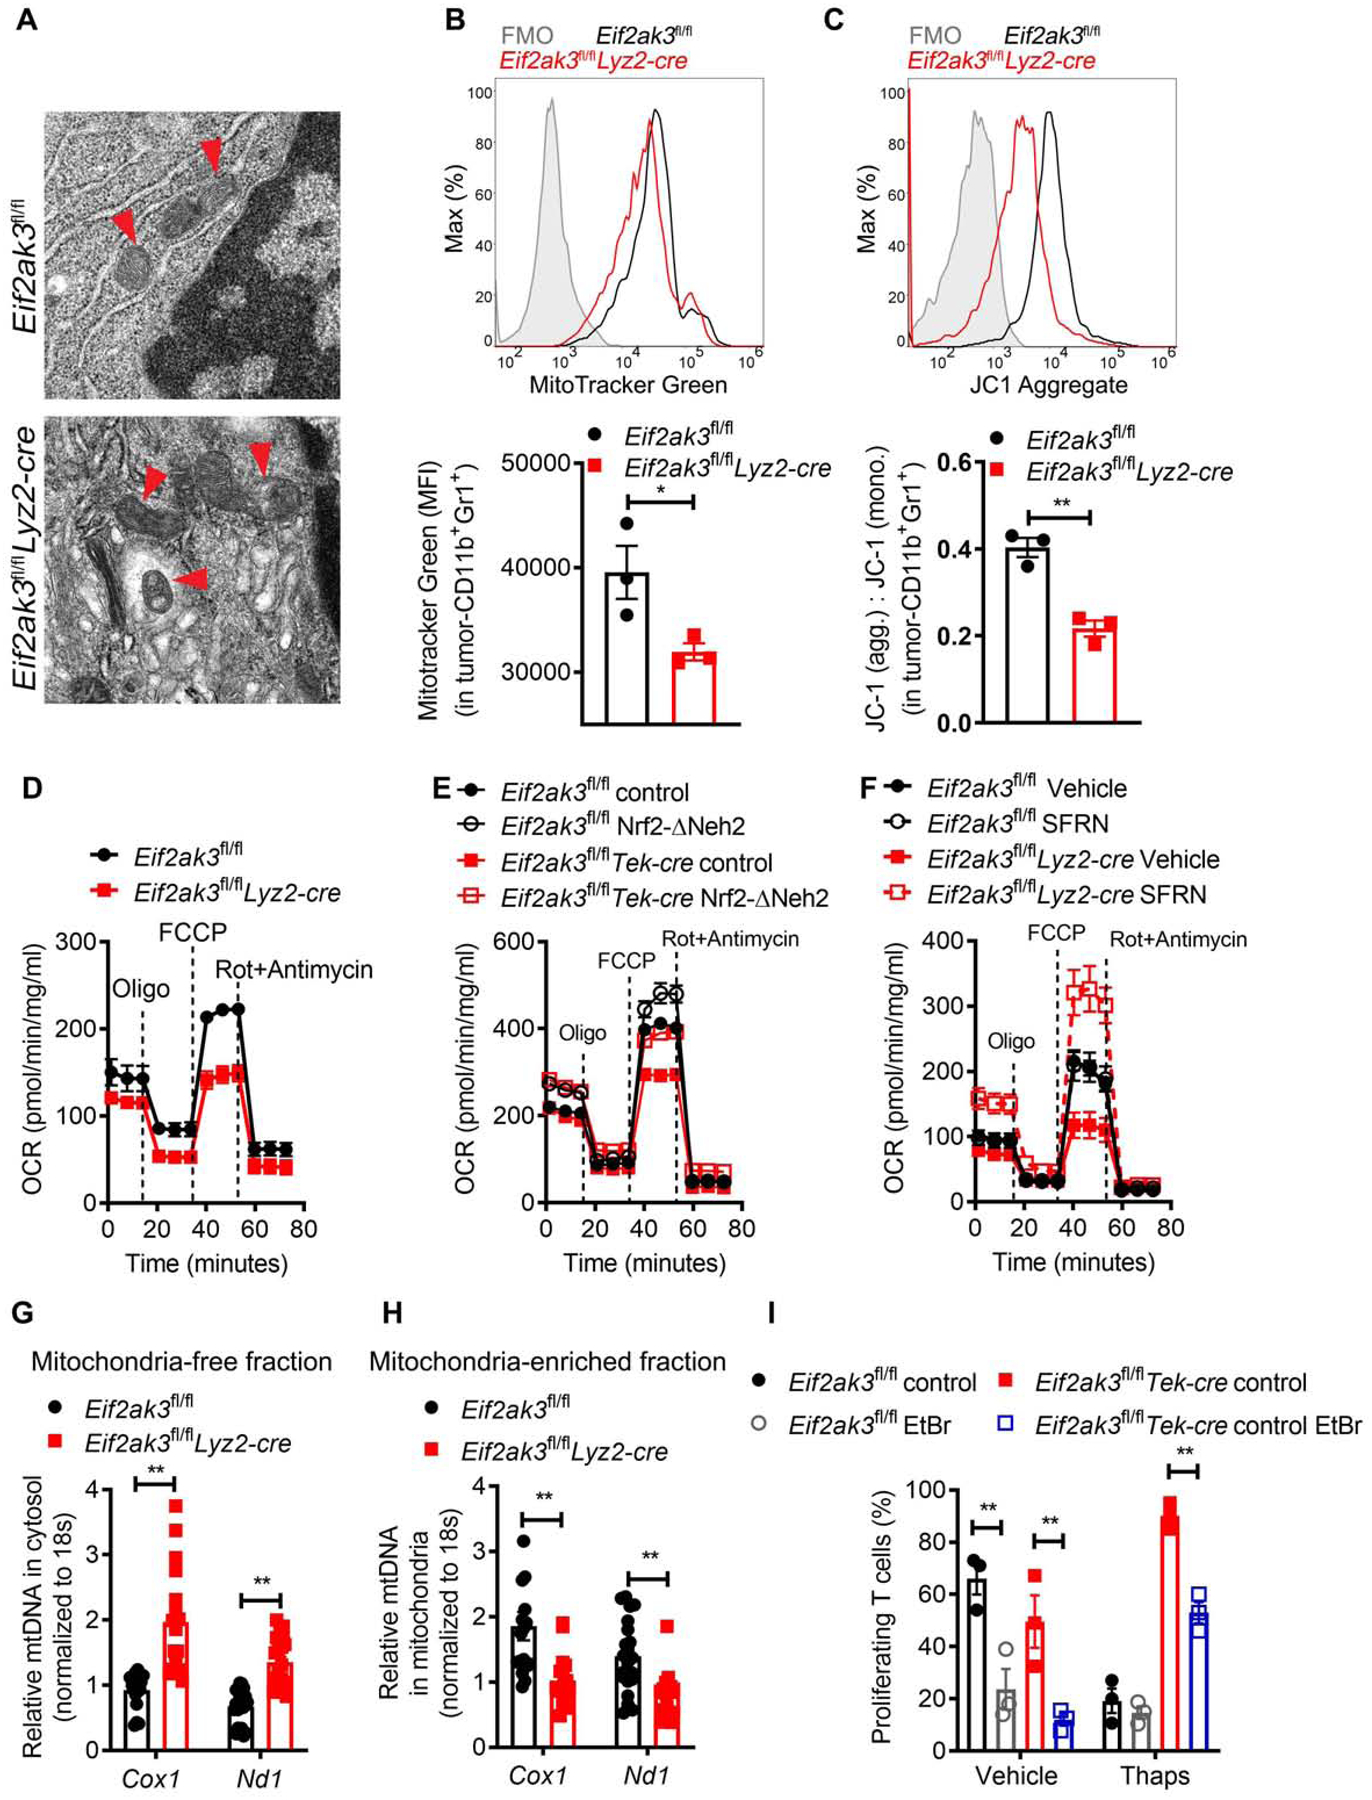
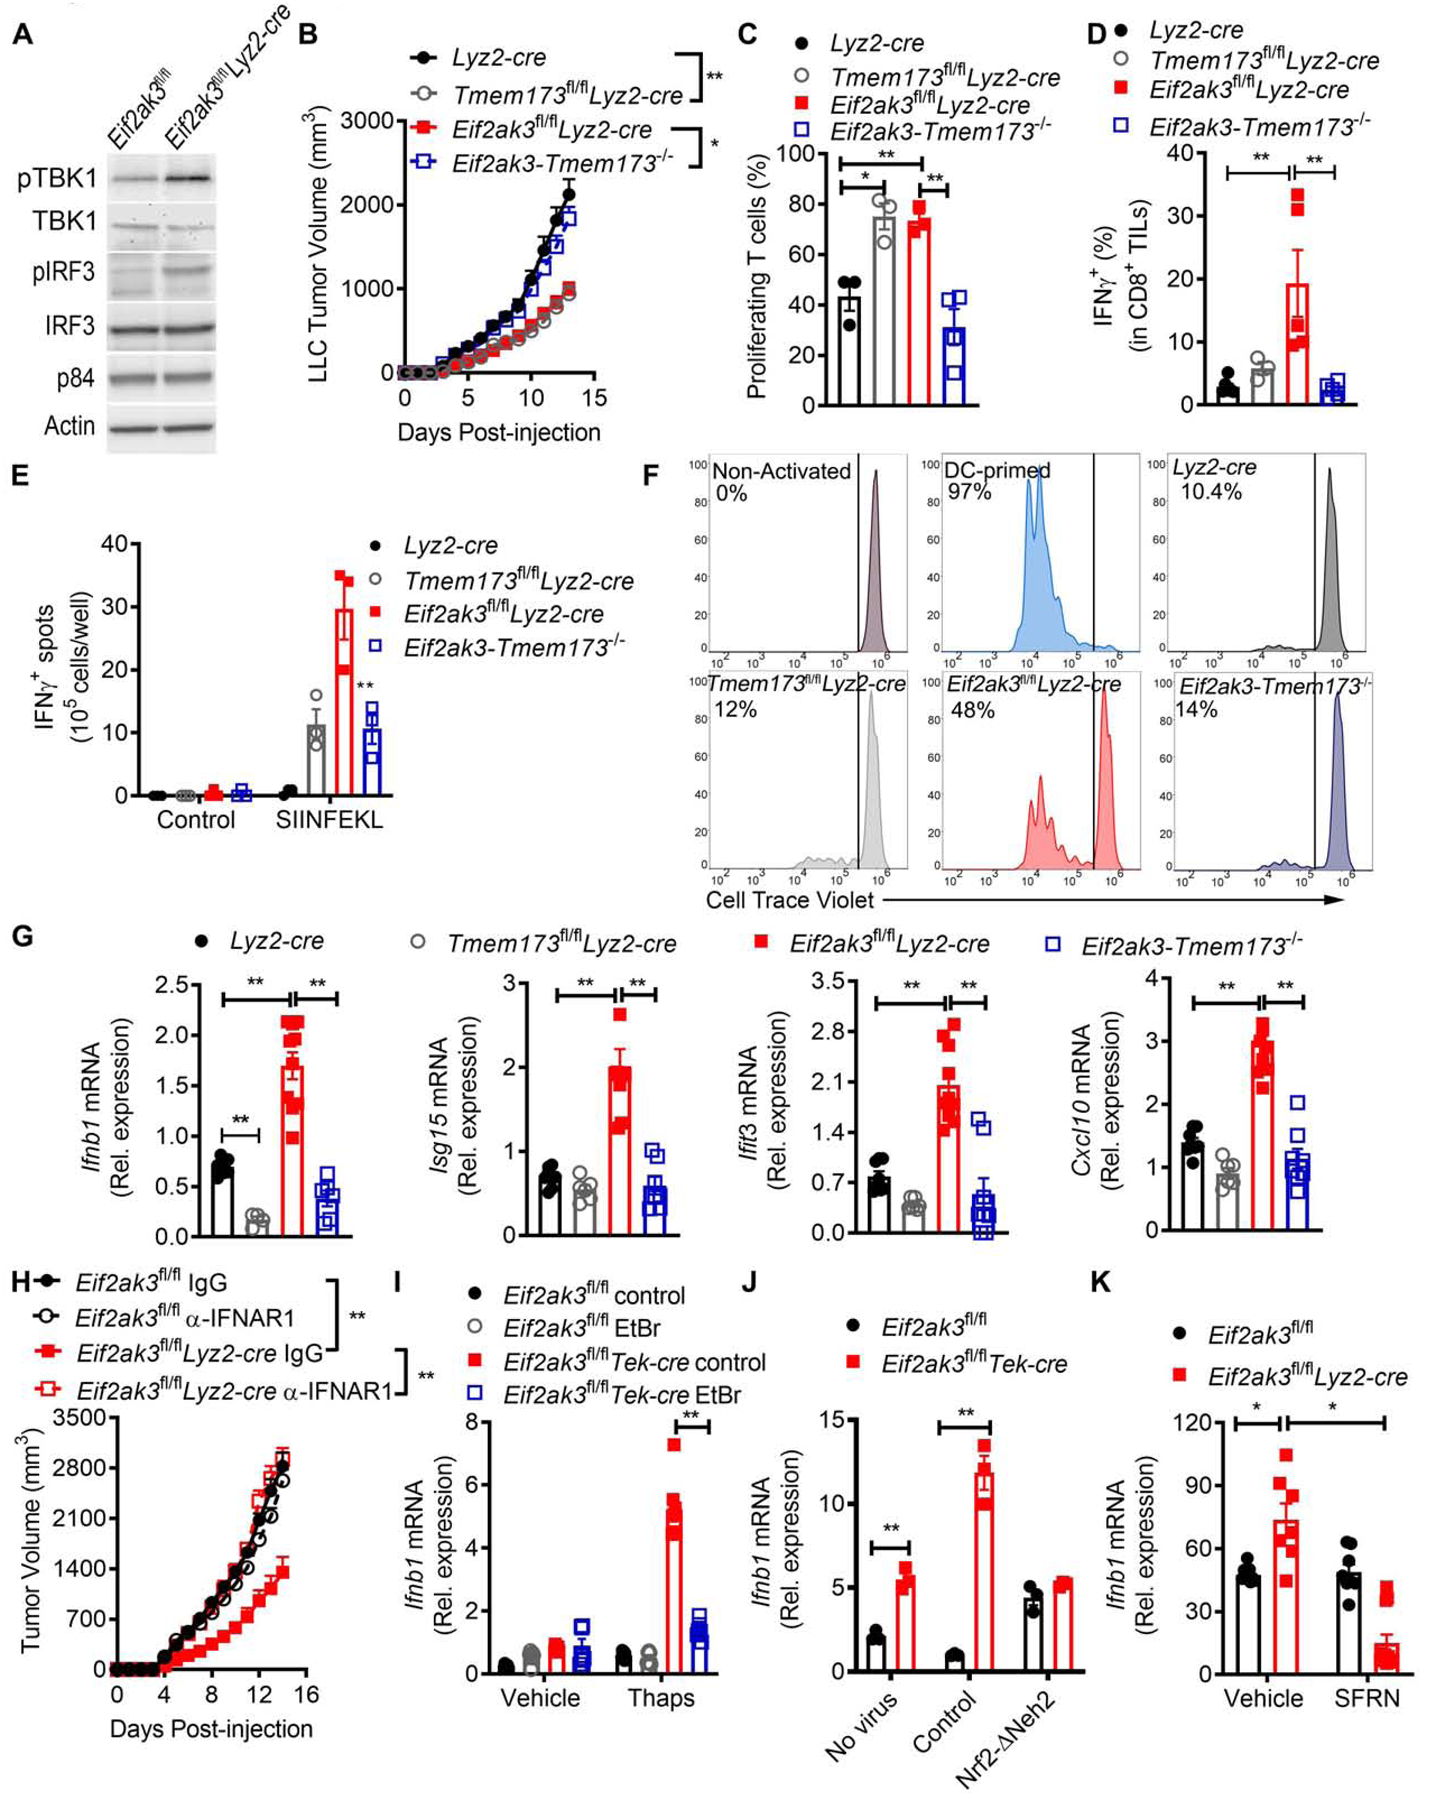
The primary mechanisms supporting immunoregulatory polarization of myeloid cells upon infiltration into tumors remain largely unexplored. Elucidation of these signals could enable better strategies to restore protective anti-tumor immunity. Here, we investigated the role of the intrinsic activation of the PKR-like endoplasmic reticulum (ER) kinase (PERK) in the immunoinhibitory actions of tumor-associated myeloid-derived suppressor cells (tumor-MDSCs). PERK signaling increased in tumor-MDSCs, and its deletion transformed MDSCs into myeloid cells that activated CD8+ T cell-mediated immunity against cancer. Tumor-MDSCs lacking PERK exhibited disrupted NRF2-driven antioxidant capacity and impaired mitochondrial respiratory homeostasis. Moreover, reduced NRF2 signaling in PERK-deficient MDSCs elicited cytosolic mitochondrial DNA elevation and, consequently, STING-dependent expression of anti-tumor type I interferon. Reactivation of NRF2 signaling, conditional deletion of STING, or blockade of type I interferon receptor I restored the immunoinhibitory potential of PERK-ablated MDSCs. Our findings demonstrate the pivotal role of PERK in tumor-MDSC functionality and unveil strategies to reprogram immunosuppressive myelopoiesis in tumors to boost cancer immunotherapy.

Keywords: ER stress; MDSCs; NRF2; PERK; STING; tumor immunity; type I IFN; unfolded protein responses.


Conflict of interest statement

Declaration of Interests The authors declare no competing interests.

Figures

Figure 1.
Figure 1.. TME drives immunosuppressive function and UPR activation in MDSC
(A) Proliferation assessed by flow cytometry in CFSE-labeled T cells primed with anti-CD3 and anti-CD28 and co-cultured for 72 hours with S-MDSC or T-MDSC from mice bearing LLC (left), B16 (middle) or ID8-Defb29-Vegfa (right) tumors; or from splenic iMC from tumor-free mice (1:1/4 ratio). Sample from 3 independent repeats. (B) Immunoblot for the UPR sensors in iMC, S-MDSC, and T-MDSC from (A). Results are representative of 3 independent studies. (C) Sample of ER-Tracker compared to fluorescence minus one (FMO) from 3 distinct repeats (left) and merged mean fluorescence intensity data (MFI, right) in iMC, S-MDSC, or T-MDSC from LLC-bearing mice. (D) Transmission electron microscopy image from 3 independent repeats from cells as in (C) (left). Arrows indicate ER. Scale bar, 2 μm (upper) and 200 nm (lower). Quantification of data (right). (E-F) BM-MDSC derived using G-CSF and GM-CSF (20 ng/ml each) and in the presence of LLC-TES (30%) or Thaps (200 nM, 24 hours) were tested for the UPR drivers (E) or capacity block T cell proliferation (ratio 1:1/8) (F). Immunoblot and suppression assay are representative of 3 distinct repeats. (G-H) Human-MDSC derived using GM-CSF and IL-6 (10 ng/ml each) and in the presence of 10–60% supernatants from the 786–0 cell line or Thaps were tested for the expression of UPR drivers (G) or ability to blunt primed T cell proliferation (ratio 2:1) (H). Immunoblot and histograms are representative from 5 independent repeats. Statistics were done using one-way ANOVA or Student’s t-test. *, p<0.05; **, p<0.01. Please also see Figure S1.
Figure 2.
Figure 2.. TUDCA overcomes MDSC-related T cell dysfunction and boosts immunotherapy
(A) Tumor volume ± SEM in mice bearing LLC (left) or B16 (right) cells and treated daily after day 6 post-tumor injection with vehicle or TUDCA (250 mg/kg). n=10. (B) Proliferation of primed CFSE-labelled T cells co-cultured with tumor-MDSC (ratio 1:1/4) from LLC-bearing mice treated with vehicle or TUDCA. n=5. (C) Immunoblot for NOS2 and Arginase I in tumor-MDSC from (A). n=3 independent repeats. (D) Percentage of CD69+CD44+ in CD8+ TILs from tumors as in (A) at day 15. n=5. (E) LLC tumor volume ± SEM in wildtype (WT) and Rag1−/− mice treated as in (A). n=5. (F) Tumor volume ± SEM in mice bearing LLC (left) or B16 (right) tumors treated as in (A) and receiving or not 250 μg anti-Gr1 every 3rd day since the day of tumor injection. n=5. (G-H) Percentage of CD69+CD44+ (G) and EGSRNQDWL-H-2Db tetramer+ (H) in CD8+ TILs from B16-bearing mice treated as in (F). (I) B16 tumor volume ± SEM in mice treated as in (A) and receiving or not 250 μg anti-PD-L1. n=10. (J) Mice bearing EG7 tumors were treated as in (A) and specific cohorts received CD8+ OT-I T cells pre-primed with OVA257–264. Tumor volume ± SEM. n=5. (K) Spleens from (J) tested for IFNγ by EliSpot upon priming with OVA257–264. n=3 repeats of 3 spleens/group. (L) Tumor volume ± SEM for EG7 or LLC tumors injected s.c. in opposite flanks of mice that previously rejected EG7 tumors after TUDCA plus ACT treatment. n=3. Statistics were applied using one-way ANOVA or student’s t-test, *, p<0.05; **, p<0.01. Please also see Figure S2.
Figure 3.
Figure 3.. PERK intrinsically controls MDSC function
(A) Left: Illustrative image of 46 Met-NSCLC tumors and 8 healthy control lung tissues from a TMA (20x resolution and further 10x digital magnification) showing phospho-PERK (Magenta), CD11b (Red), CD15 (Yellow), CD14 (Green), HLA-DR (Orange), pan-Cytokeratin (pCK, Cyan), and DAPI (Blue) by Automated Multispectral Imaging. Center: Sample histogram from samples from left showing pPERK expression on pCKnegCD11b+HLA-DRneg cells from MET-NSCLC and control lungs. Right: Phospho-PERK+ cells ± SEM in PMN-MDSC-LC (pCKnegCD11b+HLA-DRnegCD14negCD15+) or M-MDSC-LC (pCKnegCD11b+HLA-DRnegCD14+CD15neg). n=8 control lung tissues and 46 MET-NSCLC tumors. (B) LLC (left, n=20) and B16 (right, n=10) tumor growth ± SEM in Eif2ak3fl/fland Eif2ak3fl/flLyz2-cre mice. (C) Growth of flank sarcoma initiated after injection with Cre recombinase-coding adenovirus in flank of KrasG12D/+Trp53fl/fl mice previously reconstituted with bone marrow from Eif2ak3fl/flLyz2-cre or Eif2ak3fl/fl mice. n=4. (D) Proliferation of primed CFSE-labeled T cells co-cultured with tumor-MDSC (ratio 1:1/4) from LLC-bearing control or PERK-null mice. Results are representative from 3 independent experiments. (E) Immunoblots for NOS2 and Arginase I (left) and UPR mediators in LLC tumor-MDSC from (D). Representative from 3 distinct experiments. (F) Control and Eif2ak3−/−BM-MDSC pre-treated or not with Thaps (24 hours) were co-cultured with primed-T cells. T cell proliferation was assessed as in (D). n=4. (G-I) Percentage of CD8+ TILs in CD45+ cells (G); and CD69+CD44+ (H) and IFNγ+ cells (I) in CD8+ TILs in LLC tumors as in (B). n=5. (J) LLC growth ± SEM in Eif2ak3fl/fl and Eif2ak3fl/flLyz2-cre mice treated with 400 μg anti-CD8 antibody or isotype. n=5 mice/group. (K) Tumor volume ± SEM in B16-bearing mice treated with vehicle or AMG-44 (12, 24 mg/kg) daily after day 6 post-tumor injection. n=5. (L) Proliferation of primed T cells co-cultured with tumor-MDSC (ratio 1:1/4) from B16-bearing mice treated with vehicle or AMG-44 (12 mg/kg). n=3. (M) Frequency of IFNγ+ in CD8+ TILs from B16-bearing mice treated as in (L). n=4. (N) B16 growth ± SEM in mice treated as in (L) and with or without 250 μg anti-PD-L1. n=5. (O) Proliferation of primed T cells co-cultured with control or Thaps-treated BM-MDSC (ratio 1:1/8) pre-exposed to 5 μM AMG-44. n=3. Statistics were by one-way ANOVA, Student’s t-test, or log-rank (Mantel-Cox)*, p<0.05; **, p<0.01. Please also see Figure S3.
Figure 4.
Figure 4.. PERK deletion functionally reprograms tumor-MDSC
(A-B) LLC volume ± SEM in Eif2ak3fl/fl and Eif2ak3fl/flLyz2-cre mice treated every 3rd day with 250 μg anti-Gr1 (A), 250 μg anti-CCL2 (B) or IgG starting on the day of tumor injection. n=5. (C) Tumor growth in WT (left) and Rag1−/− (right) mice injected with LLC cells alone or co-injected at a 1:1 ratio with LLC-tumor-MDSC from Eif2ak3fl/fl or Eif2ak3fl/flLyz2-cre mice. n=5. (D) Relative expression heatmap of specific markers on tumor MDSC subsets from LLC-bearing Eif2ak3fl/flLyz2-cre mice compared to Eif2ak3fl/fl mice. n=10. Arbitrary units. (E) Percentage of IL-12 (left) and TNF-α (right) in MDSC subsets from (D). n=3. (F) Illustrative from 3 independent experiments showing proliferation of CFSE-labeled OT-I CD8+ T cells co-cultured with LLC-MDSC from Eif2ak3fl/fl or Eif2ak3fl/flLyz2-cre mice, pre-loaded with 1 mg/ml OVA (16 hours). Control OT-I cell proliferation was induced by OVA-loaded DCs. (G-H) Merged MFI ± SEM (left) and sample histogram expression (right) of ZsGreen (G) and OVA-bound H-2Kb (H) in tumor-MDSC from Pan02-Ova-ZsGreen-bearing Eif2ak3fl/fl or Eif2ak3fl/flLyz2-cre mice. n=5 (G) and n= 8 (H). (I) Percentage of SIINFEKL-H-2Kb-tetramer+ in CD8+ TILs from Pan02-Ova-ZsGreen tumors from Eif2ak3fl/fl or Eif2ak3fl/flLyz2-cre mice. n=4. (J-K) Fold MFI change of ZsGreen (J) and SIINFEKL-bound H-2kb (K) in tumor-associated myeloid subsets from Eif2ak3fl/flLyz2-cre mice relative to controls. MFI values of specific myeloid subsets from PERK-null mice were divided over those from control mice. n=5 (L) Proliferation of cell-trace violet-labeled OT-I T cells co-cultured with tumor-MDSC (ratio 1:1/4) from (G). As positive control, OT-1 cells were co-cultured with GM-CSF plus IL-4-induced DCs loaded with OVA257–264 (1:1/4). Representative from 3 distinct repeats. Statistics applied using one-way ANOVA or Student’s t-test, *, p<0.05; **, p<0.01. Please also see Figure S4.
Figure 5.
Figure 5.. Functional switch of PERK-null MDSC occurs through impaired NRF2 signaling
(A) Immunoblot of CHOP in tumor-MDSC from Eif2ak3fl/fl and Eif2ak3fl/flLyz2-cre mice bearing LLC tumors. Sample of n=5 distinct tumors. (B) Proliferation of primed CFSE-labelled T cells co-cultured with wild type (WT), Eif2ak3−/− or Ddit3−/− BM-MDSC pre-treated or not with Thaps (24 hours) (ratio 1:1/8). n=3. (C) Control and Eif2ak3−/− BM-MDSC were transduced with lentivirus expressing Ddit3 (Ddit3-OE) or control (control-OE), after which they were treated with or without Thaps (24 hours) and co-cultured with primed-T cells (ratio 1/8:1). T cell proliferation assessed as in (B). n=3. (D-E) NRF2 immunoblot (D) and NRF2 binding to a consensus DNA-binding sequence (E) using 15 μg nuclear extracts from tumor-MDSC from LLC-bearing Eif2ak3fl/fl or Eif2ak3fl/flLyz2-cre mice. n=3 from distinct experiments. (F) DCFDA in control MDSC (left), Thaps-treated BM-MDSC (middle), or tumor-MDSC (right) from controls and PERK-null mice. Illustrative result from 3 distinct experiments. (G) Proliferation of activated T cells co-cultured for 72 hours with control or Eif2ak3−/− BM-MDSC pre-treated for 3 hours with vehicle, Resveratrol, or Sulforaphane (SFRN) and Thaps for 24 hours. n=3 (H) Proliferation of primed T cells co-cultured with BM-MDSC transduced with lentivirus coding for NRF2-ΔNeh2 or control and treated with Thaps (24 hours). n=3. (I) Tumor Volume ± SEM in Eif2ak3fl/fl or Eif2ak3fl/flLyz2-cre mice bearing LLC-tumors and treated with vehicle or SFRN n=5. (J) Percentages of DCFDA+ MDSC in tumors from (I). n=3. (K) Percentage of proliferating T cells co-cultured with MDSC (ratio 1:1/4) from tumors from (I). n=4. Statistics were applied using one-way ANOVA or student’s t-test, *, p<0.05; **, p<0.01, ***, p<0.001. Please also see Figure S5.
Figure 6.
Figure 6.. NRF2 regulates mitochondrial homeostasis in PERK-null MDSC
(A) Transmission electron microscopy image of tumor-MDSC from LLC-bearing Eif2ak3fl/fl and Eif2ak3fl/flLyz2-cre mice. Arrow heads point to mitochondria. Scale bar, 500 nm. Representative result from 3 independent experiments. (B) Illustrative histogram of 3 distinct repeats (upper) and merged MFI values (lower) of Mitotracker fluorescence in tumor-MDSC from (A). (C) Histogram of aggregated JC-1 fluorescence (upper) and JC-1 aggregates: JC-1 monomers ratio (upper) in tumor-MDSC from (A). n=3 independent repeats. (D) Oxygen consumption rate (OCR) after mitochondrial stress analysis in tumor-MDSC from LLC-bearing Eif2ak3fl/fl and Eif2ak3fl/flLyz2-cre mice. n=5. (E) OCR as in (D) in control and Eif2ak3−/− BM-MDSC transduced with NRF2-ΔNeh2 or control carrying lentivirus and treated with Thaps (24 hours). n=3. (F) OCR as in (D) in tumor-MDSC from Eif2ak3fl/fl and Eif2ak3fl/flLyz2-cre mice bearing LLC tumors and treated with vehicle or SFRN. n=3. (G-H) Relative Cox1 and Nd1 DNA expression in mitochondria-free cytosolic fractions (G) and mitochondrial-enriched fractions (H) from tumor-MDSC from (A). Results are triplicates of 5 samples/group. (I) Proliferation of T cells co-cultured with Control and Eif2ak3−/− BM-MDSC developed in the presence of 150 ng/ml of EtBr and treated with or without Thaps (24 hours). n=3. Statistics were applied using student’s t-test, *, p<0.05; **, p<0.01. Please also see Figure S6.
Figure 7.
Figure 7.. STING-dependent Type I IFN regulates functional switch of PERK-null MDSC
(A) Illustrative immunoblot from 3 independent experiments showing cytosolic phospho-TBK1 (pTBK1) and total TBK1, or nuclear phospho-IRF3 (pIRF3) and IRF3 in LLC-tumor MDSC from Eif2ak3fl/fl and Eif2ak3fl/flLyz2-cre mice. (B) Tumor Volume ± SEM in Lyz2-cre, Eif2ak3fl/flLyz2-cre, Tmem173 fl/flLyz2-cre, and Eif2ak3fl/fl Tmem173 fl/flLyz2-cre (Eif2ak3-Tmem173 −/−) mice bearing LLC tumors for 15 days. n=7. (C) Proliferation of primed CFSE-labeled T cells cultured with tumor-MDSC from (B) (ratio 1:1/4). n=3. (D) Percentage of IFNγ+ in CD8+ TILs from (B). n=4. (E) Tumor-draining lymph nodes from Lyz2-cre, Eif2ak3fl/flLyz2-cre, Tmem173 fl/flLyz2-cre and Eif2ak3-Tmem173 −/− mice bearing Pan02-Ova-ZsGreen tumors for 14 days were tested for IFNγ by EliSpot upon OVA257–264 activation. n=3/group. (F) Proliferation of cell-trace violet-labeled OT-I CD8+ T cells co-cultured with tumor-MDSC from mice from (B). Sample of 5 independent repeats. (G) Relative expression of Infb1, Ifit3, Cxcl10, mRNA in tumor-MDSC from (B). Duplicates from 5 samples/group. (H) Tumor volume ± SEM in LLC-bearing Eif2ak3fl/fl and Eif2ak3fl/flLyz2-cre mice treated or not every 3 days with 1 mg anti-IFNAR1 antibody from day of tumor injection. n=5. (I) Relative Ifnb1 mRNA expression in control and Eif2ak3−/− BM-MDSC developed in the presence of 150 ng/ml of EtBr and treated with Thaps (24 hours). n= 3. (J) Relative Ifnb1 mRNA in control and Eif2ak3−/− BM-MDSC transduced with lentivirus coding for NRF2-ΔNeh2 or control and then treated with Thaps (24 hours). (K) Relative Ifnb1 mRNA expression in LLC tumor-MDSC from Eif2ak3fl/fl and Eif2ak3fl/flLyz2-cre mice treated with vehicle or SFRN. Statistics were applied using one-way ANOVA, *, p<0.05; **, p<0.01. Please also see Figure S7.

Comment in

Similar articles

Cited by

References

    1. Ahn J, Son S, Oliveira SC, and Barber GN (2017). STING-Dependent Signaling Underlies IL-10 Controlled Inflammatory Colitis. Cell Rep 21, 3873–3884. - PMC - PubMed
    1. Ahn J, Xia T, Konno H, Konno K, Ruiz P, and Barber GN (2014). Inflammation-driven carcinogenesis is mediated through STING. Nat Commun 5, 5166. - PMC - PubMed
    1. Atkins C, Liu Q, Minthorn E, Zhang SY, Figueroa DJ, Moss K, Stanley TB, Sanders B, Goetz A, Gaul N, et al. (2013). Characterization of a novel PERK kinase inhibitor with antitumor and antiangiogenic activity. Cancer Res. 73, 1993–2002. - PubMed
    1. Bettigole SE, and Glimcher LH (2015). Endoplasmic reticulum stress in immunity. Annu Rev Immunol 33, 107–138. - PubMed
    1. Bettigole SE, Lis R, Adoro S, Lee AH, Spencer LA, Weller PF, and Glimcher LH (2015). The transcription factor XBP1 is selectively required for eosinophil differentiation. Nat Immunol 16, 829–837. - PMC - PubMed

Publication types

MeSH terms